Physico Chemical Assessment and Comparison of Quality of Underground Water for Drinking Purpose At Periodic Interval in the Village of Srikurmam, Gara Mandal in Srikakulam District, Andhra Pradesh, India
Vaddi Dhilleswara Rao1 , Mushini Venkata Subba Rao1 * and M. P. S. Murali Krishna2
1
Department of Chemistry,
G.M.R Institute of Technology,
Rajam,
532127
Srikakulam District Andhra Pradesh
India
2
Department of Chemistry,
Andhra Polytechnic,
Kakinada,
533003
Andhra Pradesh
India
DOI: http://dx.doi.org/10.12944/CWE.9.3.32
Copy the following to cite this article:
Rao V. D, Rao M. V. S, Krishna M. P. S. M. Physico Chemical Assessment and Comparison of Quality of Underground Water for Drinking Purpose At Periodic Interval in the Village of Srikurmam, Gara Mandal in Srikakulam District, Andhra Pradesh, India. Curr World Environ 2014;9 (3) DOI:http://dx.doi.org/10.12944/CWE.9.3.32
Copy the following to cite this URL:
Rao V. D, Rao M. V. S, Krishna M. P. S. M. Physico Chemical Assessment and Comparison of Quality of Underground Water for Drinking Purpose At Periodic Interval in the Village of Srikurmam, Gara Mandal in Srikakulam District, Andhra Pradesh, India. Curr World Environ 2014;9(3). Available from: http://cwejournal.org?p=562/
Download article (pdf)
Citation Manager
Publish History
Select type of program for download
| Endnote EndNote format (Mac & Win) | |
| Reference Manager Ris format (Win only) | |
| Procite Ris format (Win only) | |
| Medlars Format | |
| RefWorks Format RefWorks format (Mac & Win) | |
| BibTex Format BibTex format (Mac & Win) |
Article Publishing History
| Received: | 2014-09-11 |
|---|---|
| Accepted: | 2014-10-19 |
Water is a natural resource that sustains the necessary needs of all living creatures. It is not only for drinking and it plays a vital role in various sectors as in the form of an essential Engineering material. It is required for sustaining all forms of life, food production, economic development of industry and agriculture
The main resource of fresh water is the ground water,1 which is commonly used for domestic, irrigation and industrial purposes. Ground water is the major source of drinking water in both urban and rural India. It is an important source of drinking water, but now a days, it is polluted in most areas due to increased human population, growth of industrial activities, dumping of industrial waste, improper disposal of garbage, use of fertilizers in agriculture and man made activities.2 Physical, chemical and biological characteristics determine the quality of water. Hence, it becomes essential to ensure the quality of groundwater to utilize it for various purposes.
The domestic, agricultural activities mostly depend on the groundwater in majority areas, and hence it is known to the importance of groundwater quality.3-5 The quality of water and its environment is subjective to the geologic formation of an area and mostly, the groundwater contains more mineral contents than the surface water. It is for this reason that the groundwater movement is slow and hence,longer contacts time with the sediments and the hydrologic conditions have a significant role6 in the change of groundwater quality over a period.
The monitoring of water quality is one of the major tools for sustainable development and provides important information for water management.7 The quality of water is vital concern for humanity since it is directly linked with human welfare. Therefore, monitoring the quality of water is one of the essential issues of drinking water management.8 The quality of underground water in Srikurmam, Gara Mandal of Srikakulam District, Andhra Pradesh is observed closely and continously at periodic interval. Thus, in this research work an attempt has been made to assess the physical and chemical parameters of ground water at Srikurmam.
EXPERIMENTAL
Study area
Srikurmam village is located approximately 13 kilometers east of Srikakulam town near Bay of Bengal and is in the Gara Mandal of Srikakulam District, Andhra Pradesh, India. Srikurmam is located at latitude of 18° 16' N, longitude of 84° 1' E and an altitude of 17 meters (59 feet).
Water sampling
The groundwater samples are collected as per the standard manner4 in the month of June 2011, July 2012, July 2013 and of May 2014.After each sample is collected, they are analyzed immediately for various parameters or preserved safely by taking care with suitable standard precautionary methods to avoid deterioration/alteration. All the water samples are collected in 2 Litres plastic bottles that were washed and double rinsed with distilled water before sampling. The list of sample collection places in Srikurmam is given in the Table 1.
Table 1: List of sample collection sites
|
Sample no. |
Location of sample |
Source |
|
1 |
Brahmin Street | Bore Water |
|
2 |
Kurmanatha Temple opposite | Bore Water |
|
3 |
Vyshnavi Street | Bore Water |
|
4 |
Near Bus Stand | Bore Water |
|
5 |
Secondary Government School | Bore Water |
|
6 |
Karnala Street | Bore Water |
|
7 |
Karnala Street | Well Water |
|
8 |
Kandra Street | Bore Water |
|
9 |
Market Street | Bore Water |
|
10 |
Devara Street | Bore Water |
|
11 |
Segidipeta | Bore Water |
|
12 |
Indiranagar colony | Bore Water |
|
13 |
Velama Street | Well Water |
|
14 |
Panchayati office | Well Water |
|
15 |
Bankers colony(Pratap house) | Bore Water |
Instruments used
The following instruments are used to analyze various constituents present in ground water samples. Atomic Absorption Spectrometer (AAS) (PerkinElmer 400),UV-Visible Double beam Spectrophotometer(Model AU – 2701, Systronics), Digital pH meter (Model 335, Systronics), Nefleometer (Model 132, Systronics), Digital Conductometer(Model 306,Systronics), Micro processor based bunch PH / Ion meter, Cyber scan 2100, Eutech instruments (USA) with fluoride sensitive electrode.
Chemicals used
All the Chemicals used are of Analytical Reagent Grade (Merck, BDH and Qualigens) and the solutions are prepared by using triply distilled water and, water without carbon dioxide is used when required. The following solutions are used for analysis and wherever standard solutions are required, for this the standardization methods9 are followed.The following list of chemicals are used in this research work such as Potassium hydrogen phthalate, Potassium hydrogen phosphate, Potassium dihydrogen phosphate, Calcium Carbonate, EDTA, Na2CO3, HCl, NaCl, AgNO3, Sodium oxalate, Potassium permanganate, Ferrous Ammonium Sulphate, K2Cr2O7,APDC (Ammonium 1- pyrolidiene dicarbomate), MIBK (Methyl Isobutyl ketone) and concentrated HNO3, Hypo, 10 % BaCl2, 10% KI , 1000 ppm of fluoride and Nitrite solution, stock phenol solution, 4-aminoantipyrine, Potassium ferricyanine, chloroform, Borax buffer, Ammonium chloride-ammonium hydroxide buffer solution,TISAB Buffer, AgNO3 – Nitric acid reagent, Vanadate – molybdate reagent, 0.5% Sulphanalamide reagent and indicators of phenolphthalein, methyl orange, EBT, Muroxide, K2CrO4 and 1% Starch.
Procedure of assessment of various constituents in water
For estimation of various constituents present in the groundwater like pH, Electrical Conductivity(EC), Turbidity, Total Dissolved Solids(TDS), Alkalinity, Total Hardness(TH), Ca and Mg Hardness, Fluoride(F-), Chloride(Cl-), Nitrite(NO2-), Sulphate, Phosphate, Phenol &metals like Sodium(Na), Potassium(K), Iron(Fe), Zinc(Zn), Cadmium(Cd), Nickel(Ni), Cobalt(Co) and Lead(Pb) are estimated by following standard methods 10.
Results and Discussion
Based on the results obtained in Periodic interval [Table 2, 3 and 3(a)] the analyzed parameters are compared with the values of WHO11 and BIS12 to know the quality of water. In all periodic intervals (June 2011, July 2012, July 2013 and in the month of May 2014) all the parameters are analysed and compared. It is identified that they maintains almost nearer values in the respective interval times.Many parameters do not match desired limits of potable parameters as per standard guidelines of WHO11and BIS.12 From the obtainedvalues, graphs (Figure1, 2, 3 and 4) are drawn for some of the parameters with their desirable limits for its comparison.
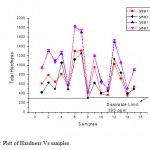 |
Figure 1: Plot of Hardness Vs samples Click here to View figure |
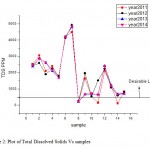 |
Figure 2: Plot of Total Dissolved Solids Vs samples Click here to View figure |
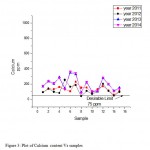 |
Figure 3: Plot of Calcium content Vs samples Click here to View figure |
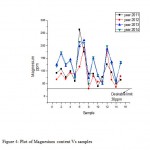 |
Figure 4: Plot of Magnesium content Vs samples Click here to View figure |
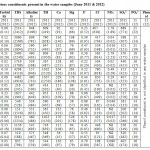 |
Table 2: Values of various constituents present in the water samples (June 2011 & 2012) Click here to View table |
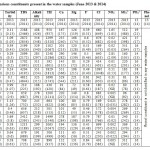 |
Table 3: Values of various constituents present in the water samples (June 2013 & 2014) Click here to View table |
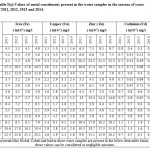 |
Table 3(a): Values of metal constituents present in the water samples in the seasons of years of 2011, 2012, 2013 and 2014.: Click here to View table |
Here the Water Quality Index (WQI)13 values has been calculated and reported based on the results obtained in the samples for the year 2014 to evaluate the suitability of ground water quality for potable purpose.The same procedure was also implemented to the samples that are collected in the years 2011, 2012 and 2013. For calculation of WQI, the following four steps have been taken into account. In the first step, each of the nine analyzed parameters has been assigned a weight (wi) according to its relative importance in the overall quality of water for drinking purposesTable4. In the second step, the relative weight (Wi) is calculated as per the established13-15 method as follows.
Table 4: Chemical Parameters, weight (wi), WHO Standards and calculated weight (Wi) for each Parameter
|
S.No |
Chemical Parameter |
Weight(wi) |
WHO Standards (Si) |
Relative weights (Wi) |
|
1 |
TDS |
5 |
500 |
0.16666 |
|
2 |
Total Hardness |
5 |
300 |
0.16666 |
|
3 |
Chloride |
4 |
250 |
0.13333 |
|
4 |
sulphate |
3 |
250 |
0.1 |
|
5 |
Calcium |
2 |
75 |
0.06666 |
|
6 |
Magnesium |
2 |
50 |
0.06666 |
|
7 |
Fluoride |
4 |
1.5 |
0.13333 |
|
8 |
Sodium |
4 |
200 |
0.13333 |
|
9 |
Pottasium |
1 |
12 |
0.03333 |
| ∑wi = 30 |

Relative weight Here ‘Wi’ is the relative weight, ‘wi’ is the weight of each parameter and ‘n’ is the number of parameters. In the third step a quality rating scale (Qi) for each parameter is calculated by following equation; Qi = ( Ci/Si) × 100, here ‘Ci‘ is the concentration of each chemical parameter in each water sample in mg/L and ‘Si’ is the standard value according to the Guide lines of WHO16 per each chemical parameter [Table 4]. In the fourth step the sub index (Sli) of each chemical parameter is estimated by using the equation
Sli = Wi× Qi.
The overall Water Quality Index was calculated by adding together each sub index values of each water samples as follows;
WQI = Σ Sli.
Based on the results of obtained[Table 5] Water Quality Index from the samples and these values are compared with the standard [Table 5] WQI values17,18 for human consumption.It clearly indicates that the underground water at research sites in most of the areas in Srikurmam is not fit for drinking purposes without any purification.Therefore, based on the overall results the underground water at Srikurmam in almost all areas is not suitable for drinking.
Table 5: Water quality Index of each ground water sample at Srikurmam
| Sample | TDS(Sli) | TH(Sli) | Cl-(Sli) | SO42-(Sli) | Ca2+ (Sli) | Mg2+(Sli) | F-(Sli) | Na+(Sli) | K+(Sli) | WQI |
| 1 | 82.2 | 52.05 | 34.61 | 19.44 | 15.55 | 15.86 | 2.75 | 8.06 | 5.55 | 236 |
| 2 | 95.2 | 73.33 | 36.37 | 15.92 | 21.33 | 23.19 | 4.62 | 6.86 | 4.44 | 281.2 |
| 3 | 87.53 | 59.27 | 30.55 | 10.56 | 18.93 | 17.06 | 4.35 | 6.59 | 4.99 | 239.8 |
| 4 | 72.4 | 71.44 | 33.75 | 4.2 | 25.06 | 18.53 | 4.08 | 4.39 | 2.77 | 236.6 |
| 5 | 56.5 | 33.38 | 21.38 | 8.04 | 11.99 | 9.59 | 2.75 | 5.06 | 4.16 | 152.8 |
| 6 | 139.83 | 100.7 | 55.89 | 7.08 | 32.53 | 28.66 | 3.55 | 9.73 | 7.22 | 385.2 |
| 7 | 161.46 | 96.94 | 50.66 | 2.64 | 30.57 | 28.13 | 5.33 | 12.19 | 7.77 | 395.6 |
| 8 | 7.5 | 23.33 | 9.973 | 3.12 | 7.46 | 6.53 | 5.42 | 1.53 | 2.49 | 67.35 |
| 9 | 22.9 | 67.27 | 35.89 | 3.68 | 20.17 | 20.53 | 6.75 | 6.19 | 3.05 | 186.4 |
| 10 | 24.4 | 34.55 | 9.49 | 11.28 | 9.42 | 11.33 | 7.19 | 1.59 | 2.22 | 111.4 |
| 11 | 21.23 | 28.5 | 9.49 | 10.76 | 9.95 | 7.33 | 4.79 | 1.53 | 3.05 | 96.63 |
| 12 | 79.83 | 85.55 | 40.85 | 9.68 | 25.24 | 26.39 | 7.46 | 4.73 | 3.88 | 283.6 |
| 13 | 39.63 | 58.16 | 37.7 | 14.8 | 17.95 | 17.19 | 4.26 | 4.39 | 3.05 | 197.1 |
| 14 | 22.96 | 27.72 | 12.26 | 11.76 | 9.42 | 7.46 | 4.62 | 1.19 | 1.94 | 99.33 |
| 15 | 24.1 | 50.94 | 20.42 | 12.2 | 12.35 | 18.13 | 7.02 | 3.39 | 2.22 | 150.7 |
| Standard WQI values for water to human consumption | ||||
| WQI Range | Type of Water | |||
| < 50 | Excellent Water | |||
| 50.1 - 100 | Good Water | |||
| 100.1- 200 | Poor Water | |||
| 200.1 - 300 | Very Poor Water | |||
| > 300.1 | Unfit for Water | |||
Further, an attempt is made to know the possibility of removal of hardness from the samples by using a conventional method such as boiling. It is not helpful in any manner.This clearly indicates that the rate of decreasing of hardness is very less in the chosen samples and the underground water in Srikurmam has a characteristic property of more permanent hardness than temporary hardness. In addition,one more attempt is made to remove the excess amounts from the various constituents present in the water; the water is subjected to Reverse Osmosis (RO) process. After treatment by RO, the treated water samples are analyzed and the results obtained clearly indicate that maximum excess amounts are eliminated by RO technique; it indicates that the water in Srikurmam is treated to make it suitable for drinking. Hence, the overall results indicate that the water at Srikurmam is not fit for drinking without using an established purification method.
After thorough observations of the study area and physical chemical analysis of groundwater samples at Srikurmam, the causes of contamination of the ground water may be either because of seepage of sewage and sullage or of natural geological conditions. In addition to this, the waste water from different sources such as kitchens, septic tanks and cesspits is discharged in to drainage canals. Unfortunately, the drainage canals are not properly constructed and maintained. As a result, there is an every possibility of seepage of sewage and sullage to the ground water and it will pollute the underground water in the areas under study.
References
- Sudharsanam, A., BabuAbraham, A., & Shanthakumar, S. Assessment of physico-chemical characteristics of groundwater. A case study, Int Env Health Eng. 2, 34 – 37 (2013)
- Nareshkumar., SukhvinderSingh, P., kritika, R., Ashish, P., & Amitkumar. To study the Physico - Chemical Properties and Bacteriological examination of step well water from Majhwar region in Distt. Mandi of Himachal Pradesh, India. International Journal of Current Research, 5, 4118-4123 (2013).
- Chhaya, V. W., Sudarshan, J., Kokate., Haribhau, R., Aher., & Shashikant. R. K. Physico-Chemical Analysis Of Ground Water In Pravara Area, District Ahmednagar, Maharashtra. Rasayan J. Chem, 2, 234 – 242 (2009).
- Reza, R., & Singh, G., Physico – Chemical analysis of groundwater in Angul – Talcher Region of Orissa, India. Journal of American Science, 5, 53-58 (2009).
- Kalshetty, B. M., Sheth, R. C., Hiremath, P. S., & Kalashetti, M. B. Physicochemical analysis of ground water samples of Jamkhandi town in Bagalkot district, Karnataka state. Int J Chem Sci, 9, 412 – 420 (2011).
- Shahnawaz, M., & Singh, K. M., Groundwater quality of piro and jagdishpur blocks of Bhojpur city: A middle gangatic plain. Int J Pharm Qual Assur,1, 9 – 13 (2009).
- Vasanthavigar, M. Characterization and quality assessment of groundwater with a special emphasis on irrigation utility: Thirumanimuttar sub-basin, Tamilnadu, India. Arabian journal of Geosciences, 1, 1-14 (2010).
- Shama, S., IffatNaz., MohammadIshtiaq, A., & Safia, A. Monitoring of Physico – Chemical and Microbiological Analysis of Under Ground Water Samples of District KallarSyedan, Rawalpindi, Pakistan. Research Journal of Chemical sciences, 1, 24-30 (2011).
- Jeffery, G.H., Bassett, J., Mendham, J., & Denney, R.C. Vogel’s textbook of quantitative chemical analysis, Pearson education (Singapore) Pvt. Ltd, 5th Edition, Revised (1989).
- Subba Rao, M. V., Dhilleswararao, V., & Andtrews, B. S. A. Assessment of Quality of Drinking Water at Srikurmam in Srikakulam District, Andhra Pradesh, India. Int Res J Environment Sci, 1, 13-20 (2012).
- World Health Organization, “Guidelines for Drinking - Water Quality,” 3rd Edition, World Health Organization (WHO), Geneva, Switzerland. WHO (2004).
- Bureau of Indian Standards, Drinking Water – Specification; September, 1991.
- Gebrehiwot, A. B., Tadesse, N., & Jigar, E. Application of water quality index to assess suitability of groundwater quality for drinking purposes in Hantebet Watershed, Tigray, Northern Ethiopia, ISASB. J Food Agri Sci, 1, 22- 30 (2011).
- Brown, R. M., McCleiland, N. J., Deininger, R. A., & O’Connor, M. F., A water quality index -crossing the psychological barrier Proc. Int Conf Water Poll Res ( Jerusalem, Jenkis, S.H. ed.) 6, 787-797 (1972).
- Horton, R. K. An index number system for rating water quality, J Water Pollut Control Fed, 37, 300- 305 (1965).
- World Health Organization, “Guidelines for Drinking-Water Quality,” 3rd Edition, World Health Organization (WHO), Geneva, Switzerland. WHO (2004).
- Sahu, P., & Sikdar, P. K. Hydrochemical framework of the aquifer in and around East Kolkata wetlands, West Bengal, India. Environ Geol, 55, 823-835 (2008).
- Ramakrishnaiah, C. R., Sadashivaiah, C., & Ranganna, G. Assessment of Water Quality Index for the Groundwater in TumkurTaluk, Karnataka State, India. E J Chem, 6, 523-530 (2009).


