Impact of Source Area Desertification on Dust Storm Emission in the Western Parts of Iran
Davoud Akhzari1 * , Behnaz Attaeian1 , Mohammad Bashir Gonbad1 and Kamran Shayesteh2
1
Department of Range and Watershed Management,
Malayer University,
Malayer,
Iran
2
Department of Environmental Sciences,
Malayer University,
Malayer,
Iran
DOI: http://dx.doi.org/10.12944/CWE.9.3.11
Iraq is one of the main sources of western part of Iran’s dust storm. Iran’s western part dust storms considered hazardous problem that cause many environment and socio-economic impacts. Sensitive areas to desertification were identified by Environmental Sensitivity Areas (ESAs) in the source area of western part of Iran’s dust storms for 2003 and 2007. RS and GIS data have been used to assess the desertification severity and its relation with the pervasive dust storms occurrences in western parts of Iran. The comparison of ESAs maps over studied years, indicate the severity of desertification has been increased in 2007. Source area desertification may cause western part of Iran’s dust storms. Generally, the occurrences of western part of Iran’s dust storms have become more frequent over studied years.
Copy the following to cite this article:
Akhzari D, Attaeian B, Gonbad M. B, Shayesteh K. Impact of Source Area Desertification on Dust Storm Emission in the Western Parts of Iran. Curr World Environ 2014;9 (3) DOI:http://dx.doi.org/10.12944/CWE.9.3.11
Copy the following to cite this URL:
Akhzari D, Attaeian B, Gonbad M. B, Shayesteh K. Impact of Source Area Desertification on Dust Storm Emission in the Western Parts of Iran. Curr World Environ 2014;9(3). Available from: http://www.cwejournal.org/?p=7032
Download article (pdf)
Citation Manager
Publish History
Select type of program for download
| Endnote EndNote format (Mac & Win) | |
| Reference Manager Ris format (Win only) | |
| Procite Ris format (Win only) | |
| Medlars Format | |
| RefWorks Format RefWorks format (Mac & Win) | |
| BibTex Format BibTex format (Mac & Win) |
Article Publishing History
| Received: | 2014-07-19 |
|---|---|
| Accepted: | 2014-09-28 |
Introduction
Desertification is one of the most drastic problems in many countries (UNCCD, 2008). This phenomenon resulted by process set in vulnerable environments. Arid and semi-arid natural vegetation resources exploitation causes soil erosion that has led to desertification (Mainguet and Letolle, 1998). Source area wind erosion leads to dust storm emission (Gillette et al., 1980). Loss of vegetative ground cover is the first sight might appear to be desertification.
For identification of areas vulnerable to desertification the ESAs model could be used (Kosmas et al., 1999). The ESAs model was based on four indicators that represent of the soil quality (texture, rock fragments, drainage, parent material, soil depth), the climate (rainfall, aridity, aspects), vegetation (plant cover, fire risk, erosion protection, resistance to aridity) and of the management practices (intensity of land use in rural zones, pastures and forest areas, managerial policies) (Ladisa et al., 2002).
Dust storms occur in arid and semi-arid area (Urban et al., 2009). Dust Storms have hazardous effects in western parts of Iran (Gerivani et al., 2011). Desertification caused dust storms emission (Wang et al., 2006). Middle East is known as an arid and semi-arid region with frequent and severe dust storms that subject to desertification (Harahsheh, 2001). Dust storms occurs when the surface wind shear velocity in the source area exceeds a threshold value, which is a function of surface properties such as the presence of roughness elements containing structural elements such as rocks and vegetation (Marticorena and Bergametti, 1995). Remote sensing techniques could be used to monitor trends of land degradation and desertification (Chen et al., 1998).
Materials and Methods
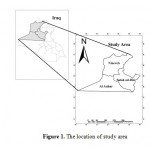
Northern parts of Al Anbar, Nineveh and Salah ad-Din Governorates in western of Iraq have been selected as study area. The study area has been shown in Figure 1.
|
|
Figure 1: The location of study area |
The ESAs model has been applied to assess the desertification severity of the source area. Soil quality, climate quality, vegetation quality and management quality were ESAs model indicators (Basso et al., 1999; Kosmas et al., 1999; Giordano et al., 2002; Ladisa et al., 2002).
Soil quality index (SQI) of ESAs model has been calculated in terms of (a) soil texture, (b) parent material, (c) rock fragment cover, (d) soil depth, (e) slope grade, and (f) drainage conditions using equation 1.
SQI = (texture×parent material×rock fragment×depth×slope×drainage) 1/6 ..................(1)
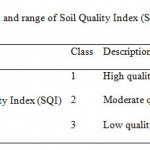
The description and range of Soil Quality Index (SQI) were shown in Table 1.
|
|
Table 1: The description and range |
Climate quality index was extracted from mean annual temperature and precipitation data. Equation 2 has been used to Bagnold-Gosen aridity Index (BGI) calculation.

Where, BGI is Bagnold-Gosen Index, Ti refers to temperature of the i month (°C), Pi insinuate total monthly precipitation of the i month (mm) and k show the frequency of the condition 2Ti-Pi > 0 for the i month (%) (Bagnouls and Gaussen, 1952). Based on equation 3, BGI and average annual rainfall were used to generate climate quality raster layer. Equation 3 has been used for Climate Quality Index (CQI) assessment.
CQI = (rainfall × aridity) 1/2 ..................(3)
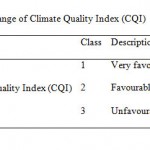
Description and range of Climate Quality Index (CQI) has been shown in Table 2.
|
|
Table 2: Description and range |
Vegetation Quality Index (VQI) of ESAs model has been assessed in terms of (a) fire risk and ability to recover, (b) soil erosion protection, (c) drought resistance and (d) plant cover (Basso et al., 2010). These four vegetation characteristics were assessed to product the vegetation quality index by use of equation 4.
VQI = (fire risk × erosion protection × drought resistance × vegetation cover) 1/4 .............(4)
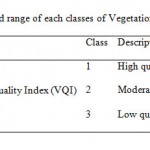
The description and range of each classes of Vegetation Quality Index (VQI) were shown in Table 3.
|
|
Table 3: The description and range of each |
EVI has been used to express the vegetation percentage index. The source area has been divided in 1 square kilometre pixels. The mean values of EVI for each pixel were calculated using the red and NIR reflectance, using Equation 5 (Huete et al., 2002):
EVI= G (NIR- RED)/ (NIR+ C1× RED+ C2× BLUE+ L) .............(5)
Where, C1 and C2 are coefficients designed to correct for dust aerosol scattering and absorption, which use the blue band to correct for dust aerosol influences in the red band. C1 and C2 have been set at 6 and 7.5, while G is a gain factor (set at 2.5) and L is a canopy background adjustment (set at 1.0) (Nagler et al., 2005).
The intensity of land use and the enforcement of policy on environmental protection have been assessed for each land use for any land use type. The management quality index (MQI) was assessed using equation 6.
MQI = (land use intensity × policy enforcement) 1/2 ................(6)
The description and range of each Management Quality Index (MQI) classes have been shown in Table 4.
|
|
Table 4: The description and range of each |
Physical environmental qualities indices (soil, climate, vegetation) and the management quality index were determined for assessing the environmentally sensitive areas (ESA’s) to desertification. The four derived indices are multiplied for the assessment of the ESAs index (ESAI) as equation 7.
ESAI = (SQI × CQI × VQI × MQI) 1/4 .............(7)
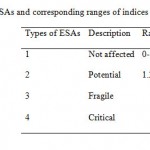
Types of ESAs and corresponding ranges of indices have been shown in Table 5.
|
|
Table 5: Types of ESAs and |
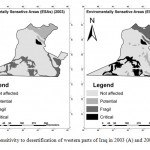
Based on ESAs model, the desertification severity map of source area of western part of Iran’s dust storms has been prepared for 2003 and 2007 (Figure 2).
After that, Meteorological data of 2003 and 2007, including precipitation and dust storm frequency from meteorological stations in western parts of Iraq and pervasive dust storms in western parts of Iran were provided.
The object of this study was to conduct assessment the desertification severity using ESAs model in western parts of Iraq and its relation with the pervasive dust storms occurrences in western parts of Iran based on RS and GIS data.
Results
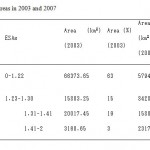
The ESAs model has been used to assess desertification sensitivity in source area of dust storms over several Iranian western cities. The input indices of ESAs model were estimated and summed up to prepare the desertification severity of land use types (Table 6) across the source area. After that, their respective desertification severity maps were then synthesized (Figure 2) for 2003 and 2007.
|
|
Figure 2: Sensitivity to desertification of |
Figure 2 shows the distribution of ESAs in 2003 (A) and 2007 (B) in Northern parts of Al Anbar, Nineveh and Salah ad-Din Governorates in western of Iraq.
Table 6 demonstrates the ESAs areas in 2003 and 2007. It is clear that most of the study area is not affected by desertification; these classes exhibit 63 and 55% of the total area in 2003 and 2007, respectively. Compared with 2003, potential, fragile and critical areas percentages have been increased in 2007 (Table 6).
|
|
Table 6: The ESAs areas in 2003 and 2007 |
On the other hand, Meteorological data of 2003 and 2007 comparison indicate that there were two and five records of pervasive dust storms in western parts of Iran that originated from Iraq for 2003 and 2007, respectively.
Discussion
Iraq is one of the main sources of western part of Iran’s dust storm (Prospero et al., 2002; Kutiel and Furman, 2003; Gerivani et al., 2011; Karimi et al., 2012). Desertification occurs mainly in arid and semi-arid regions [20] and caused dust storm emission (Wang et al., 2006). Western parts of Iraq’s all annual precipitation takes place during winter (Zakaria et al., 2012).
Iraq’s western parts geographical location in a dry area which is characterized by water scarcity and low annual rainfall (Al-Ansari and Knutsson, 2011) with uneven distribution (FAO, 1987) believed to be the major sources of dust storms in the area (Al-Jumaily and Ebrahim, 2013). These regions rainy seasons start in November and nearly end in May (Al-Khalidy, 2004). Summer was mentioned by (Kutiel and Furman, 2003) to be the time dust storms frequently occurred in Iran. The occurrence of dust storms over several Iranian western cities is higher during spring and summer which vegetation percentage value shows reductions in the source areas.
Potential, fragile and critical areas percentages have been increased in 2007 in comparison with 2003 (Table 6). Compared with in situ observations, there were two records of pervasive dust storms in western parts of Iran in 2003. In situ observations comparison indicate that there were five records of pervasive dust storms in western parts of Iran that originated from Iraq for 2007.
Desertification caused increased frequency and severity of dust storms (Wang et al., 2006).
Iraq’s 2003 precipitation was higher than the long term precipitation average (Darvishi et al., 2012). The availability of water cause plants biological activity in arid and semi-arid areas (Lambers et al., 1998). In the arid and semiarid regions, precipitation pulses are important triggers for biological activity (Huxman et al., 2004). Precipitation caused plant species better establishment in Iraq. Plants grow rapidly following the onset of the wet season and remain as ground cover for several months (Herrmann et al., 2005).
But Iraq’s 2007 drought episode corresponds to the driest year case since 1940 (Trigo et al., 2010). Drought led to the extensive destruction of vegetation cover and expansion of wind erosion (Zhibao et al., 2000). Dust aerosols eroded from arid soils. During periods of drought, vegetation cover levels are reduced (McTainsh and Strong, 2007). So, drought conditions caused the source areas vegetation degradations increment and the occurrences of western Iran dust storms have become more frequent.
Drought caused wipe out the vegetation cover. Drought conditions in 2007 caused the source areas vegetation degradations and desertification. So, the occurrences of Western Iran dust storms have become more frequent. But, Desertification process has been shown to be exacerbated by some other anthropogenic activities. Farmlands abandonment (ICARDA, 2013), Overgrazing (Kaul and Thalen, 1971), construction dams (Al-Ansari and Knutsson, 2011; Zakaria et al., 2012) and highest amount of water required for optimal crop production (Doell and Siebert, 2002) has been recorded in Iraq that caused desertification exacerbation.
References
-
Al-Ansari N. A., Knutsson S. (2011). Toward Prudent management of Water Resources in Iraq. Journal of Advanced Science and Engineering Research. 1, 53-67.
-
Al-Jumaily K. J., Ibrahim M. K., (2013). Analysis of synoptic situation for dust storms in Iraq. International Journal of Energy and Environmental. 4 (5), 851-858.
-
Al-Khalidy K. A., (2004). Preparation of Geographical Information System for the South Jazira Irrigation Project with the aid of Remote Sensing Data, M.Sc. thesis, Mosul University. pp. 121-141.
-
Bagnouls F., Gaussen H., (1952). L’indice xérothermique. Bulletin de l’Association de Géographes français.janv.–févr., Paris. pp. 222–223
-
Basso F., Belloti A., Faretta S., Ferara A., Manino G., Pisante M., Quaranta G., Tabemer, M., (1999). Application of the proposed methodology for defining ESAs: The Agri basin, Italy. In: C. Kosmas, M. Kirkby and N. Geeson (eds), The Medalus project: Mediterranean desertification and land use. Manual on key indicators of desertification and mapping environmentally sensitive areas to desertification. European Commission, Project ENV4 CT 95 0119 (EUR 18882). pp. 74–79.
-
Chen Z., Elvidge C.D., (1998). Groenveld, D.P. Monitoring of seasonal dynamics of arid land vegetation using AVIRIS data. Remote Sensing of Environment. 65, 255–266.
-
Darvishi A., Shaygan M., Nabavy O., Azizi R., Hossainpouri A. M., Kavousi M., Darvishi B., (2012). External sources of Iran’s pervasive dust storms. In: University of Tehran RS& GIS Center (UT-RGC), Report 3. p: 72.
-
Doell P., Siebert S., (2002). Global modeling of irrigation water requirements. In: Water Resources Research. 38, 1010-38.
-
FAO., (1987). Improving Productivity of Dry land Areas. Committee on Agriculture (Ninth session). FAO, Rome. http://www.fao.org/docrep/meeting/011/ag415e/ag415e04.htm#4.1.
-
Gerivani H., Lashkaripur G. H., Ghafoori M., Jalili N., (2011). The Source of Dust Storm in Iran: A Case Study based on Geological Information and Rainfall Data. Carpathian Journal of Earth and Environmental Sciences. 6, 1, pp. 297-308.
-
Gillette D. A., Adams J., Endo C., Smith D., (1980). Threshold velocities for input of soil particles into the air by desert soils. J. Geophys. Res. 85, 5621-5630.
-
Giordano L., Giordano F., Grauso S., Lannetta M., Scicortino M., Bonnati G., Borfecchia F., (2002). Desertification vulnerability in Sicily. Proc. of the 2nd Int. Conf. On New Trend in Water and Environmental Engineering for Safety and Life: Eco-Compatible Solution for Aquatic Environments. pp. 44-85.
-
Harahsheh H., (2001). Development of environmental GIS database and its application to desertiï¬cation study in Middle East. Chiba University, Chiba. p 155.
-
Herrmann S. M., Anyamba A., Tucker C. J., (2005). Recent trends in vegetation dynamics in the African Sahel and their relationship to climate. Global Environmental Change. 15, 394-404.
-
Huete A., Didana K., Miura T., Rodriguez E. P., Gao X., Ferreira L. G., (2002). Overview of radiometric and biophysical performance of the MODIS vegetation indices. Remote Sensing and Environment. 83, 195–213.
-
Huxman T. E., Snyder K. A., Tissue D., Leffler A. J., Ogle K., Pockman W. T., Sandquist D. R., Potts D. L., Schwinning S., (2004). Precipitation pulses and carbon fluxes in semiarid and arid ecosystems. Oecologia. 141, 254–268.
-
ICARDA., (2013). Iraq salinity assessment. http://www.icarda.org/iraq-salinity-project/assessment IR imagery of Meteosat: 1. Infrared difference dust index. Journal of Geophysical Research. 106 (D16).
-
Karimi N., Moridnejad A., Golian S., Samani J. M. V., Karimi D., Javadi S., (2012). Comparison of dust source identification techniques over land in the Middle East region using MODIS data. Can. J. Remote Sensing. 38, 5, pp. 586-599.
-
Kaul R. N., Thalen D. C. P., (1971). Range ecology at the Institute of Applied Researches in Natural Resources, Iraq. Nature and Resources. 7, 2-15.
-
Kosmas C., Ferrara A., Briassouli H., Imeson I., (1999). Methodology for mapping ESAs to desertification. In: Kosmas C., Kirkby M., Geeson N. (eds.) The MEDALUS Project – Mediterranean Desertification and Land Use. Manual on key indicators of desertification and mapping Environmentally Sensitive Areas to desertification. EUR 18882. 31–47.
-
Kutiel H., Furman H., (2003). Dust storms in the Middle East: sources of origin and their temporal characteristics. Indoor and Built Environment. 12, 419–426.
-
Ladisa G., Todorovic, M., Trisorio Liuzzi, G., (1999). Characterization of areas sensitive to desertification in Sourthern Italy. In: Becciu G., Maione U., Majone Letho B., Monti R., Paoletti A., Paoletti M., Sanfilippo U. (eds.), Proceedings of the 2nd International Conference “New Trends in Water and Environmental Engineering for Safety and Life: Eco-compatible Solutions for Aquatic Environments”. Capri (Italy), CDSU– Centro Studi Deflussi Urbani, Milano. Essestampa srl. Napoli. ISBN 88-900282-2X, June.
-
Lambers H., Chapin F. S., Pons T. L., (1998). Plant physiological ecology. Springer, Berlin Heidelberg New York. p 540.
-
Mainguet M., Letolle R., (1998). Human-made desertification in the Aral Sea basin: Planning and management failures. In: The Arid Frontier: Interactive Management of Environment and Development, ed. Bruins, H.J., Lithwick, H. 129–142. Dordrecht: Kluwer Academic.
-
Marticorena B., Bergametti G., (1995). Modeling the atmospheric dust cycle: 1. Design of a soil-derived dust emission scheme. Journal of Geophysical Research D8. 100:16,415 16,430.
-
McTainsh G., Strong C., (2007). The role of aeolian dust in ecosystems. Geomorphology. 89, 39–54.
-
Nagler P. L., Cleverly J., Glenna E., Lampkin D., Hu P., (2005). Predicting riparian evapotranspiration from MODIS vegetation indices and meteorological data. Remote Sensing of Environment. 94, 17–30.
-
Prospero J., Ginoux M., Torres P., Nicholson S. E., Gill T. E., (2002). Environmental characterization of global sources of atmospheric soil dust identified with the NIMBUS 7 total ozone mapping spectrometer (TOMS) absorbing aerosol product. Reviews of Geophysics. 40, 2-31.
-
Trigo R.M., Gouveia C.M., Barriopedro D., (2010). The intense 2007–2009 drought in the Fertile Crescent: Impacts and associated atmospheric circulation. Agricultural and Forest Meteorology. 150, 1245–1257.
-
UNCCD., (2008). Desertification – Coping with today’s global challenges in the context of the strategy of the United Nations Convention to combat desertification. Unites Nations Convention to Combat Desertification. Report on the High-Level Policy Dialogue, Bonn, Germany.
-
Urban F.E., Reynolds R.L., Fulton R., (2009). The dynamic interaction of climate, vegetation, and dust emission, Mojave Desert, USA, Chapter 11. In Arid Environments and Wind Erosion, Fernandez- Bernal A, De La Rosa MA (eds). Nova Science Publishers Inc.: Hauppauge, NY. pp. 234-239.
-
Veron S.R., Paruelo J.M., Oesterheld M., (2006). Assessing desertification. Journal of Arid Environments 66. 751–763.
-
Wang X., Chen F., Dong Z., (2006). The relative role of climatic and human factors in desertification in semiarid China. Global Environmental Change 16. 48–57.
-
Zakaria S., Al-Ansari N., Ezz-Aldeen M., Knutsson S., (2012). Rain Water Harvesting at Eastern Sinjar Mountain, Iraq. Geoscience Research. 3(2), 100-108.
-
Zhibao D., Xunming W., Lianyou L., (2000). Soil and Water Conservation Society. All rights reserved. Journal of Soil and Water Conservation. 55(4), 439-444.


