Identifying and Prioritizing Green Management Indicators in the Fields of Energy and Waste
Marjan Daneshvar Tehrani1 * , Hooman Bahmanpour2 , Mojgan Zaeimdar3 and Lobat Taghavi4
1
Department of Environment,
College of Basic Sciences, Shahrood Branch,
Islamic Azad University,
Shahrood,
Iran
2
Department of Environment,
North Tehran Branch,
Islamic Azad University,
Tehran,
Iran
3
Department of Environmental Science,
Graduate School of Environment and Energy, Science and Research Branch,
Islamic Azad University,
Tehran,
Iran
DOI: http://dx.doi.org/10.12944/CWE.9.3.29
Copy the following to cite this article:
Tehrani M. D, Bahmanpour H, Zaeimdar M, Taghavi L. Identifying and Prioritizing Green Management Indicators in the Fields of Energy and Waste. Curr World Environ 2014;9 (3) DOI:http://dx.doi.org/10.12944/CWE.9.3.29
Copy the following to cite this URL:
Tehrani M. D, Bahmanpour H, Zaeimdar M, Taghavi L. Identifying and Prioritizing Green Management Indicators in the Fields of Energy and Waste. Curr World Environ 2014;9(3). Available from:http://www.cwejournal.org/?p=7399
Download article (pdf)
Citation Manager
Publish History
Select type of program for download
| Endnote EndNote format (Mac & Win) | |
| Reference Manager Ris format (Win only) | |
| Procite Ris format (Win only) | |
| Medlars Format | |
| RefWorks Format RefWorks format (Mac & Win) | |
| BibTex Format BibTex format (Mac & Win) |
Article Publishing History
| Received: | 2014-09-16 |
|---|---|
| Accepted: | 2014-10-25 |
Introduction
Development and implementation of green productivity management in any public or private entity will present some environmental, social and economic achievements, so outputs, products and resources ought to increase and costs ought to reduce to increase productivity in country’s economic and social development plan in accordance to Iran’s constitution. On the other hand, while resource conservation is emphasized in green management, environmental and social considerations are evaluated and organizations and corporations should reduce unneeded uses and costs. In general, the system of green government is a set of management tools that in case of being institutionalized, can pave the ground for productive purposes at the level of organizations and companies and finally, country.1 Hospitals are large energy consumers and also, have a great potential in energy savings.2 Since energy costs is the most manageable cost in hospitals, so intelligent intervention can be done in this field. On the other hand, one of the biggest environmental problems in different societies is the correct approach and processing methods hospital solid waste. The correct action in this area requires appropriate management actions due to the potential of pollution emissions and adverse consequences.3
Green Management is a set of comprehensive, targeted and continuous measures and studies implemented at the different levels of organizations and treatment centers to promote and sustain the current status of organization in order to achieve the green government status.4 It should be noted that no study has been done to prioritize green energy and waste management indicators in Iran and consequently, This study is the first one related to this topic. Some studies have been conducted in Iran and around the world in areas like this. Yari and colleagues examined the deployment of model (green hospitals with accreditation approach) in the hospital of Ayatollah Mousavi in Zanjan Iran in 2010. Based on the results, the mean percentage of compliance with the performance standards (JCI) have been achieved 72.47%.5 Erni Setyowati and Arnis Rochma Harani by examining the concepts of green building design in orthopaedic hospital in tropical regions in 2013 came to the result that the issue of global warming is rapidly developing, thus, each health center needs for green building concepts.6 Vandana Rathore and Singh Verma concluded that the high rate of medical wastes has a negative impact on green quality.7 Sahamir and Zachary evaluated the criteria for green building hospitals in Malaysia in 2014. This article discusses the basic criteria in the ranking systems of health care buildings around the world and the differences between them with Malaysia ranking systems.8
Materials and Methods
This research is a case study in Erfan hospital of Tehran on energy and waste sector. Stages of this research are as follows:
Developing Criteria Affecting Green Energy and Waste Management
To prioritize criteria affecting green management, it was initially necessary to select the characteristics of green energy and waste management in a proper and scientific method. There are various methods for surveys and obtaining offers to help in decision-makings. One of these methods is Delphi method.9
Delphi Method
Delphi method is a way to create a group communication process, so that the process allows a group including separate and independent components to participate in solving complex problems.9 Therefore, some questionnaires were designed called experts’ survey and major and minor features were identified in the form of some questions indicating agreement, disagreement or adding a new feature to prioritize green management criteria in Erfan hospital and were given to experts. In the study it was tried that the statistical population to be selected among individuals informed about the field of study, particularly familiar with the subject and studied location. Personal, scientific and work experiences and updated information on subjects connected with the studied location were of the main factors considered in the selection of experts. Completion of the initial questionnaires about each criterion continued so far as the justified and scientific comments of reliable scholars’ audience were provided.
Prioritization of Developed Criteria
Analytical Hierarchy Process AHP10 and the EC software11 are used to prioritize and determine the importance coefficients of criteria.
The Steps of Implementing AHP Method in this Study:
This model, composed of four main steps, can be effective in situations where multiple decision indicators make the selection situation difficult by simultaneously using qualitative and quantitative indicators, and determine the hierarchy of importance and how to prioritize between different indicators. The steps of hierarchical analysis process in this study are as follows. The first step is to create a decision hierarchy tree, that is, the conversion of studied subject or issue to a hierarchical structure, which is the most important part of hierarchical analysis process.8 Hierarchical analysis process begins by identification and prioritization of decision elements. These elements can contain four levels of goals, indices, sub-indices and possible options which are applied in prioritization. The second stage is paired comparisons. At this stage, due to effective factors, a paired matrix is formed based on each criterion that we compare them two by two. The judgment base in this matter is the comparison of a 9-quantity table. Numbers used in the binary comparisons are from 1.9 to 9 as a standard scale (represented by Saaty 1980). In this way, a number from 1.9 to 9 is attributed to each binary comparison. The meaning of each number in have been identified Table 1,10
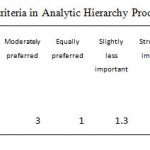 |
Table1: Weight and value of criteria in Analytic Hierarchy Process (AHP) Click here to View table |
An important point about paired comparison matrices is their inconsistency rate that in accordance with Professor Saaty, innovator of AHP, it is necessary that the inconsistency rate of matrices to be less than or equal to 0.1 so that judgments to be stable. Prepared matrices were given to experts familiar with the study area as a questionnaire to enhance the study precision at this step. The average of informed people’s opinions was entered into the software to analyze. Third step: third step is data entry into the EC software and normalization and defining priorities. EC software is a powerful tool for AHP decision making.11 Decision making can be done by the above method with the help of this software. In this step, the paired comparison matrices of specifications, supplemented by specialists after the final conclusion of their opinion, were entered into the software so that criteria importance coefficients to be calculated based on the geometric mean method and their priority to be determined, while the determination of compatibility coefficient makes the review of compatibility in the judgments possible.12 Paired comparison matrix is calculated using the geometric mean as follows. In this study, three main criteria with16 indicators have been analyzed in order to prioritize green energy and waste management indicators in Erfan Hospital of Tehran by using hierarchical analysis technique.
Results
Table 2 represents paired comparison matrix integrated of decision makers for 3 main criteria and figure 1 shows the prioritization of green management indicators.
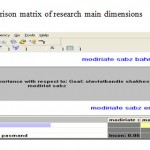 |
Table 2: Paired comparison matrix of research main dimensions |
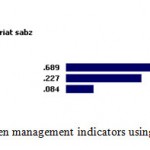 |
Figure 1: prioritization of green management indicators using EXPERT CHOICE software |
After entering data in the Expert Choice program and the entry of paired comparison matrices, dimension weights and standards were obtained. As seen in Figure 1, green management for productivity has the greatest impact with relative weight of 0.689 among the three criteria of green management in Erfan hospital of Tehran and green management for energy has second priority with relative weight of 0. 227 and green management for waste control and disposal has third priority with the weight of 0.084. Paired comparisons inconsistency rate is obtained 0.06, because it is less than 0.10, the compatibility of these comparisons is acceptable.
The calculation of the relative weight of indicators compared to each main indicator
The Relative Importance of Indicators Compared to Green Management for Productivity
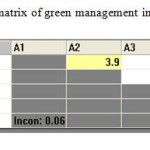 |
Table 3: Paired Comparison Matrix of Green Management Indicators for Productivity Click here to View table |
According to the paired comparison matrix of indicators in Table 3 and Figure 2, compared to green management for productivity, optimal use of resources with relative weight of 0.50 and sustainable development with relative weight of 0.236 were placed in first and second priority and, respectively and the inconsistency rate of 0.06, less than 0.10 was obtained. Therefore, the compatibility of this decision making matrix is also acceptable.
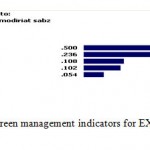 |
Figure 2: Prioritization of Green Management Indicators for EXPERT CHOICE Software Click here to View Figure |
The Relative Importance of Indicators Compared to Green Management for Energy
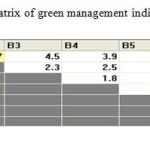 |
Table 4: Paired Comparison Matrix of Green Management Indicators for Energy Click here to View table |
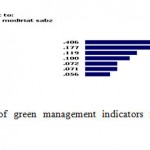 |
Figure 3: Prioritization of Green Management Indicators for Energy using EXPERT CHOICE Software Click here to View Figure |
According to the paired comparison matrix of indicators in Table 4 and Figure 3, compared to green management for energy, the optimal use of energy with relative weight of 0.406 and observing patterns of consumption with relative weight of 0.177 were placed in first and second priority, respectively and the inconsistency rate of 0.06, less than 0.10 was obtained. Therefore, the compatibility of this decision making matrix is also acceptable.
The Relative Importance of Indicators Compared to Green Management for Waste Control and Disposal
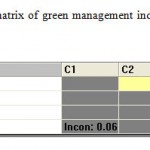 |
Table 5: Paired Comparison Matrix of Green Management Indicators for Waste Control and Disposal Click here to View table |
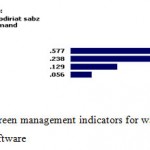 |
Figure 4: Prioritization of Green Management Indicators for Waste Control and Disposal using EXPERT CHOICE Software Click here to View Figure |
According to the paired comparison matrix of indicators in Table 5 and Figure 4, compared to green management for waste control and disposal, waste separation with relative weight of 0.577 and government involvement in environmental issues with relative weight of 0.238 were placed in first and second priority, respectively and the inconsistency rate of 0.06, less than 0.10 was obtained. Therefore, the compatibility of the decision making matrix is also acceptable. In this study, according to the results of the software, final weight and prioritization of all green management indicators is as Figure 5. Overall inconsistency rate is 0.06, that the compatibility of final results is also acceptable. Table 6 represents the paired comparisons of criteria and indicators of green management prioritization in Erfan hospitals in general.
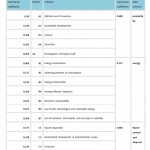 |
Table 6: Paired Comparisons of Criteria and Indicators of Green Energy and Waste Management Prioritization in Erfan Hospital. Click here to View table |
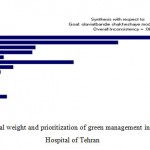 |
Figure 5: The Final Weight and Prioritization of Green Management Indicators in Erfan Hospital of Tehran Click here to View Figure |
Discussion
According to the results obtained from the software, the final weight and prioritization of all green management indicators was obtained as follows: Indicators of optimal use of resources, sustainable development and energy conservation were placed in first, second and third priority in the terms of factors affecting green management in Efran hospital of Tehran, respectively. The total inconsistency rate is 0.06, and the compatibility of final results is also acceptable. It should be noted that no study has been done to prioritize green energy and waste management indicators in Iran and consequently, health centers and this study is the first one related to this topic and since all effective indicators have been applied based on experts’ and specialists’ opinions, therefore, this study can be generalized to other hospitals in Iran and even other institutions, including universities and other organizations can use the indicators of this study in their investigations depending on their performance. Although it is important to note that many indicators may be entered into or removed from studies according to the type of work that experts’ and specialists’ opinions have been considered in this study.
Acknowledgments
Thera are no acknowledgments.
- Moharamnezhad N , Azarkamand S , Check the status of Green Productivity Management in the NGOs (Case study of sky airlines company 2005) , Journal of Environmental Science and Technology , (2009) 11(2).
- Sadrizade F , Management evaluation indexes of energy Sector , Third National Conference of Iranian energy, (2001).
- Ministry of Health; instructions and guide the implementation of environmental green management for health and therapeutic centers, Tehran 2008.
- Hajizade M , Ghasemi A , The role of green management model in develop and sustainable production , First National Conference on the Sustainable Development of Agriculture and Healthy Environment 2012.
- Yari H , Shami R , Bigleri F , Asghari SH. The Establishment of the model (green hospital approach to accreditation) Ayatollah Mousavi Hospital, Zanjan, Iran. First National Conference on Management and new technologies in health science, health and the environment 2010.
- Erni Setyowati , Arnis Rochma Harani , Yasmina Nurul Falah ,Green Building Design Concepts of Healthcare Facilities on the Orthopedic Hospital in the Tropics , Procedia Social and Bihavioral Sciences (2013) 101; 189-199.
- Vandana R , Singh Verma D. Hospital Waste Management through Green Quality Function Deployment, International Journal of Engineering Trends and Technology (IJETT) - Volume4Issue5- May 2013
- Sahamir,S-R,& Zakaria, R.Green Assessment Criteria for Public Hospital Building Development in Malaysia, 4th International Conference on Sustainable Future for Human Security, SustaiN 2013, Procedia Environmental Sciences (2014) 20,106 – 115
- Kerstin Cuhls,”Delphi method”, Fraunhofer Institute for System and Innovation Research,Germany,2001.
- Saaty, T.L. The Analytical Hierachy Process:Planning Prirority Setting, Resourse Allocation, New York: McGraw-Hillbook Co. 1980.
- Nikmardan E , Presentation Software Expert Choice (Along with a summary of the contents AHP), SID Amir Kabir Publications Unit, 2007, Page 170.
- Asgharpour MJ , Multi-criteria decision , Tehran university Publications, Fourth Edition, Tehran, 2006 ; 276-283.


