Measurement of Odour Concentration from Livestock Farm
Lukman Ismail1 * , Zaini Sakawi2 and Mohamad Khalil Saipi1
1
School of Social,
Development and Environmental Studies,
Universiti Kebangsaan Malaysia,
43600 Bangi
Selangor
Malaysia
2
Earth Observation Centre,
Universiti Kebangsaan Malaysia,
43600 Bangi
Selangor
Malaysia
DOI: http://dx.doi.org/10.12944/CWE.9.2.06
Odourpollution originated from livestock farms is a form of harmful air pollution.Odour pollution causes health issues to the surrounding local communities. Yet, odour pollution issues have not been given deserving attention by the relevant authorities and the Malaysian public. To raise the awareness, this study highlights a case of odour pollution generated from cattle and buffalo farms in Bandar Baru Bangi, Selangor.Odour measurement was taken using an instrument called Concentration Meter Xp-369 Series III. Measurement was taken during various weather and times, usually on normal days and after rains. Observationswere conducted at different times inthe mornings, evenings and nights. Ten stations were selected as locations for measuring the odour concentration within two kilometres from the livestock farms. The results indicated that after rain odour concentration gave higher readings compared to those of normal days.This phenomenon was caused by the meteorological factors such as temperature, comparative humidity; and variation in wind speed and directions on normal days and after rains.Enhancement of livestock management is suggested for mitigating the odour pollution.
Copy the following to cite this article:
Ismail L, Sakawi Z, Saipi M. K. Measurement of Odour Concentration from Livestock Farm. Curr World Environ 2014;9 (2) DOI:http://dx.doi.org/10.12944/CWE.9.2.06
Copy the following to cite this URL:
Ismail L, Sakawi Z, Saipi M. K. Measurement of Odour Concentration from Livestock Farm. Curr World Environ 2014;9(2). Available from: http://www.cwejournal.org/?p=6355
Download article (pdf)
Citation Manager
Publish History
Select type of program for download
| Endnote EndNote format (Mac & Win) | |
| Reference Manager Ris format (Win only) | |
| Procite Ris format (Win only) | |
| Medlars Format | |
| RefWorks Format RefWorks format (Mac & Win) | |
| BibTex Format BibTex format (Mac & Win) |
Article Publishing History
| Received: | 2014-06-19 |
|---|---|
| Accepted: | 2014-07-10 |
Introduction
Significant increased in productivity of livestock sector have contributed significantly to Malaysian economy. The livestock sector has been gaining increased attention of entrepreneurs for profiting from livestock farming. Populationof livestocks in developing countries has increased at the rate of 3% for the past two decades; and expected to further increase until 2020.1 Nevertheless, an increase in livestock farming has given rise to odour pollution phenomenon.2 An environmental report in Western Australia indicated that one third of the complaints made by the public were related to odour pollution. Many of the complaints were on activities of production and animal processing.3
Proximity of residential areas and livestock farms influenced the effect of odour pollution on the comunity at large and sensitive receivers in particular.4 Development of residential areas and business complex near existing livestock farms contributed to odour problem. By the same token, livestock farms built near existing residential areas could continuosly expose the residence to the odour, eventuallycausing health issues. Common health issues due to odour pollution involve respiratory system and skin infections.5
Health issues most affected young children around the livestock farms due to their still developing antibody. The common health issues complained by the sensitive receivers were eyesores, nose and throat irritations, headaches and drowsiness.6 Many long established livestock farms were located further away from residential areas. Nevertheless, there were entrepreneurs who builtnew farms nearer to residential areas, thus posing problems to sensitive receivers. On the other hand, factors such as land scarcity, increasing land price and rapid development caused some residential locations to be built nearer to livestock farms, sewage plants and landfills.
According to,7 management of odour control in Malaysia is still at a developing stage. Nevertheless, some weaknesses in managing and controlling odour pollution have been highlighted quite often by the researchers and experts.Some of the weaknesses were poor complaint system, limited research, lack of measurement instruments, lack of specific standard and regulationsand poor enforcement. Currently, most studies on odour in Malaysia have been based on foreign standards8(Table 1).
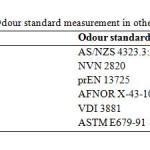 |
Table 1: Odour standard measurement in other country Click here to View table |
Materials and Methods
This study was conducted at a cattle and buffalo farms located in Bandar Baru Bangi, Selangor. The livestock farm is at N 020 56’465” dan longitude E 1010 47’103”. The farm began operation in 1958 as a family business. There were 300 heads of cattle and buffaloes on the farm. Rapid residential development has brought the residence nearer to the original farm area. The farm is now sorrounded by residential areas, shops and restaurants, motor workshops, train station and the UKM. Thus the farm is now located within the zone of sensitive receivers. The Odour Concetration Meter XP Series III instrument was used to measure odour concentration from the livestock farm. The measurement of odur concentration is in ou/m3. The instrument has the capacity to measure odour concentration from 0 to 2000 ou/m3. The standard used was an Australian standard: Assesment and Management of Odour from Stationary Sources in New South Wales. According to the standard,9 the level of concentration allowable is 10 ou/m3.
Ten stations were set up for sampling collection. The location of the stations was within 2 kilometres from the location of the livestock farms (Table 2). The samplings of odour concentration were collected on normal days and after rains. The measurements were taken three times ina day such as in the morning, evening and night. Meterological data such as temperature, comparative humidity and wind speed were also observed using the anemometer to detect their influence on odour concentration.
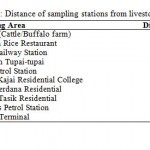 |
Table 2: Distance of sampling stations from livestock farm Click here to View table |
Results and Discussion
The results can be devided into three major components i.e. the average of odour concentration on normal days; concentration after rains and comperative concentration on normal days and after rains.
Odour Concentration on Normal Days
Figure 1 shows concentration of odour on normal days. The highest concentration was recorded at night at station 8 with 176.6 ou/m3. Followed with station 7 with 169.8 ou/m3. Boths stations were at residential areas namely Taman Bangi Perdana dan Taman Tasik located at the back of the livestock farms. These findings were similar to evidence by10that indicated high concentration of odour occured late evening and night due to more stable atmosphere and slower wind speed. The reading on odour concentration also showed a sequence of similar readings that was higher at nigt time, and lower by evening and morning at station 6 and so forth (Stations 1,2,5,6,8 dan 10). The lowest reading was recorded at station 9 with 9 ou/m3 in the morning. This reading was the one that did not exceed the standard set for normal days.
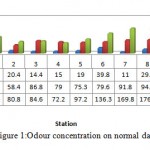 |
Figure 1: Odour concentration on normal days Click here to View Figure |
Odour Concentration After Rains
Figure 2 shows the odour concentration after rains. The highest reading recorded was in the morning at station 1 with 132.3 ou/m3. Based of previous study, concentration of odour is the highest nearest to the sources of the odour.11-14 Hence the concentration recorded at the staion was the highest compared to those of other stations.Seven other stations such as 3,4,5,6,7,8 and 10 also indicated sequence of uniform odour concentration. Concentration of odour at all of these stations was the highest in the evening, followed by morning and night. The night concentration recorded the lowest concentration reading of all.Lowest reading was recorded at station 7 at 1.0 ou/m3. While five other stations 5,6,8,9 and 10 recorded readings below the fixed standard. This phenomenon indicated that sensitive receivers did not experience odour night time during the period of the study. On the other hand, readings at other stations was the highest at station 1 which was a cattle farm (odour source).
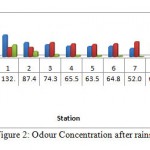 |
Figure 2: Odour Concentration after rains Click here to View Figure |
Comparison of Average Odour Concentration on Normal and after rain
The findings indicated that there were clear differences between odour concentration on different days and times of measurement.15-17 Comparison of average odour concentration during the two situations (Figure 3) indicated that concentration was highest in the evening (106.4 ou/m3), followed by night (48.3 ou/m3) and morning (21.8 ou/m3). While after rain, highest concentration was in the morning (78.8 ou/m3), followed by evening (73.6 ou/m3) and night (16.3 ou/m3). Furthermore, the analysis also indicated that odour concentration on different days and times exceeded the standardfixed by the DEC.9 According to this standard, concentration of odour allowable is at 10 ou/m3. However, as indicated by the analysis shown in the table, the average concentration for all three sessions of measurements on normal days and after rain recorded the concentration values that exceeded the standard limit.
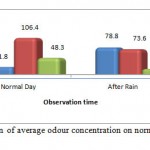 |
Figure 3: Comparison of average odour concentration on normal days and after rains Click here to View Figure |
Temperature Factor
The surrounding temperature is one of the meteorological components that can influence odour concentration. The results of multiple correlation analysis for temperature variables and odour concentration indicated high values of 0.634. This shows strong link between both variables with the value of correlation approaching 1 (maximum value for multiple correlation). Positive values indicated positve link between both variables (Fig 4). The relationship between variables also indicated significant link at 0.000. The lower value from the significant level wasfixed at 0.01.
Figure 4 shows the distribution of the concentration is lower at stations with low temperatures and vice versa. The distribution of odour concentration after rain was found to be concentrated at stations with low temperatures of around 25.0 °C to 27.5°C.This condition occured after rain, due to more stable temperature and the presence weaker wind movement.Indeed higher temperatures are capable to influence the increase of odour concentration. This phenomenon occurred for an increase in atmosphere temperature could influence the increase of concentration and odour intensity.18
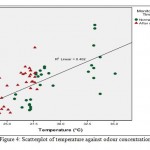 |
Figure 4: Scatterplot of temperature against odour concentration Click here to View Figure |
Wind Factor
Wind is an athmopheric factor that influence odour concentration. Based on Figure 5, odour concentration is found higher during strong wind. These findings are similar to17,19 who found that high wind speed could influence the spread of gas concentration and odour. Furthermore, the value of correlation analysis at 0.620 out of 1 indicated strong relation (positive) between wind speed variables and odour concentration. The results also indicated significant relationship between the two variables whereby significant values at 0.000 was much lower than the set sifgificance of 0.01.
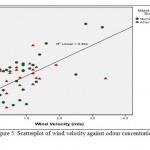 |
Figure 5: Scatterplot of wind velocity against odour concentration Click here to View Figure |
Relative Humidity Factor
Figure 6 shows the influence of humidity on odour distribution. Based on the correlation analysis, there was a regressive relatioship between humidity variables and observed odour concentration.Correlation values betwen the two variables was at -0.600. Negative values preceding the multiple values indicated the negative relationship between the two variables. Lower distribution of odour concentration was found to concentrate at the observation station that had higher relative humidity exceeding 70%.While, concentration exceeding 100 ou/m3 was recorded at areas with lower comparative humidity less than 50%.
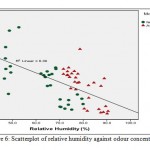 |
Figure 6: Scatterplot of relative humidity against odour concentration Click here to View Figure |
Distance Factor
Distance played significant role in influencing odour concentration observed. Generally higher odour concentration was recorded in the areas nearer to the sources of the odour such as livestock farms, sewage treatment plants and landfills.17,20-23 However correlation analysis for both variables indicated weak relationship at 0.078, from value 1 for multiple correlations. Significance values 0.554 exceeded the standard predetemided (0.01). However, based on Figure 7, the influence of distance in affecting the presence of odour is still relevant. The presence of odour is recorded higher at distance nearer to the odour sources within 1000 metres. Much less is recorded at distance exceeding 1000 metres.
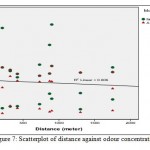 |
Figure 7: Scatterplot of distance against odour concentration Click here to View Figure |
Conclusion
Based on the findings, there were differences or variances of odour concentration on normal days and after rains. On normal days, the highest reading ofodour concentration was recorded at nighttime at 176.6 ou/m3. The maximum concentration recorded after rain was in the morningat 132.3 ou/m3. The average measurement of odour concentration of various stations and times was found to have exceeded the set Australian standard at 10 ou/m3.By implication, high odour concentration could adversely affect the physical and human environments if persistover long period.Furthermore, the influence of meteorological factors were also found significant in affecting odour concentration on normal days and after rains. The correlation analysis, indicated that temperature, comparative humidity and wind speed had strong links in influencing odour concentration from the livestock farms.Distance factor indicated weaker causal effect in influencing odour concentration at each observing station. However, odour concentration at the sources still recorded the highest reading in the morning after rains (132.3 ou/m3).
Acknowledgement
The researchers wish to gratefully acknowledgement financial support for this research by Institute of Climate Change, UniversitiKebangsaan Malaysia under grant code GGPM-2012-018 and DPP-2013-145.
References
- Delgado, C., M. Rosegrant, M. Steinfeld, S. Ehui & C. Curbois. (1999). Livestock to 2020: The next food revolution. Food, Agriculture & Environment Discussion.Paper 28. International Food Policy Research Institute, FAO and ILRI. 72.
- Casey, K.C., J.R. Bicudo, D.R. Schimidt, A. Singh, S.W. Gay, R.S. Gates, L.D. Jacobsen & S.J. Hoff. 2006. Air Quality and emission from livestock and poultry production/waste mangement systems, Pp. 1-40 in Animal Agriculture and the Environment: National Center for Manure and Animal Waste Management White Papers. J.M. Rice, D.F. Cadwell, F.J. Humenik, eds. 2006. St. Joseph, Michigan, ASABE.
- Department of Environmental Protection (DEP). 2002. Odour methodology guidelines. Perth, Western Australia: Department of Environmental Protection
- Lukman Ismail, Zaini Sakawi, Mohd Khalil Saipi, Sharifah Mastura Syed Abdullah,Othman Jaafar, Mastura Mahmud, Noor Khafazilah Abdullah& Mohd Rozaimi Ariffin. 2013a.Pencemaran Bau dari Ladang Ternakan: Persepsi Penerima Sensitif. Simposium Kebudayaan Indonesia-Malaysia XIII. 12-14 November 2013. Universiti Padjajaran, Indonesia.
- Page, T., Narjoux, P., Guy, C.& Fecil, F. 2008. Chemical Engineering Transactions: Odours & VOC impacts of three categories landfills. 15: 135-142
- Schiffman S.S. 1998. Livestock odors: Implications for human health and well-being. Journal of Animal Science.76 (5): 1343-1355.
- Lukman Ismail, Zaini Sakawi, Noor Khafazilah Abdullah, Sharifah Mastura S.A, Othman Jaafar. 2012.Pencemaran bau dari kepelbagaian sumber ladang ternakan haiwan: Isu, cabaran dan masa depan. International Conferrence of Social Science and Humanities.Bangi: UKM.
- Zhang, Q., Feddes, J., Edeogu, I., Nyachoti, M., House, J., Small, D., Liu, C, Mann, D. & Clark. G. 2002. Odour Production, Evaluation and Control.Canada: University Of Manitoba.
- Department of Environmental and Conservation (DEC). 2006. Technical Framework: Assesment and Management of Odour from Stationary Sources In NSW. Sydney: Department of Environmental And Conservation.
- McIntyre, M. E. & Norton, W.A. 2000.Potential voticity invertion on hemisphere.Journal of the Atmospheric Sciences 57(9): 1214-1235.
- Klein, R.O. 1999. Citizan perspective on sitting solid waste facilities. Maryland: Community and Environmental Defense Services.
- Zaini Sakawi, Sharifah Mastura S. A. & Othman Jaafar. 2011a. Sensitive receivers’ responses on odour annoyance of a neighbourhood open landfill site. Journal of Applied Sciences in Environmental Sanitation 6 (2): 191-199.
- Zaini Sakawi, SharifahMastura S.A., Othman Jaafar & Mastura Mahmud. 2011b. An analysis of odour concentration using odour concentration meter XP-329 at landfill vicinity. Research Journal of Applied Sciences 6 (5): 324-329.
- Zaini Sakawi, SharifahMastura S.A., Othman Jaafar&Mastura Mahmud. 2011c. Community perception of odor pollution from the landfill.Research Journal of Environmental and Earth Sciences 3 (2): 142-145.
- Lukman Ismail. 2012. Kajian konsentrasi gas dan bau dari operasi Refuse Derived Fuel. Latihan Ilmiah. Bangi: UKM.
- Lukman Ismail, Zaini Sakawi, Mohd Khalil Saipi, Mohd Rozaimi Ariffin & Noor Khafazilah Abdullah. 2013b. Pengukuran konsentrasi bau dari ladang ternakan lembu dan kerbau menggunakan alat OCM-XP-329. Seminar serantau Pengurusan Persekitaran di Alam Melayu. 6-7 Mei 2013. Hotel Pangeran, Pekanbaru, Riau, Indonesia
- Zaini Sakawi. 2012. Pengaruh pencemaran bau dari operasi tapak pelupusan berdasarkan pengukuran fizikal dan persepsi penerima sensitif. Tesis PhD. Bangi: UKM.
- Chen, Shui-Jen, Hsieh, L-Te, Hwang, Wen-Ing, Xu, H-C, dan Kao, J-H. 2003. Abatement of odor emissions from landfills using natural effective micriorganism enzyme (NEME). Aerosol and Air Quality Research 3 (1): 87-99.
- Laister, G. 2002. Prediction, Management and Control of Odour From Landfill Sites. Tesis Master. University of Natal.
- McGahan, E., Kolominskas, C., Bawden, K., Ormerod, R. 2002. Strategies to reduce odour emissions from meat chicken farms. Proc. 2002 Poultry Information Exchange, Gold Coast, 14-16 April 2002.
- Zaini Sakawi, Sharifah Mastura Syed Abdullah, Othman Jaafar, Mastura Mahmud, Lukman Ismail & Mohd. Rozaimi Ariffin. 2012a. Persepsi penerima sensitive ke atas pencemaran bau dari tapak pelupusan secara terbuka.E-Bangi: Journal of Social Sciences and Humanities 7 (1): 284-293.
- Zaini Sakawi, Lukman Ismail, Mohd Rozaimi Ariffin, Sharifah Mastura S.A., Othman Jaafar.2012b. Pencemaran bau di Malaysia. Isu dan cabaran pengurusan bau lestari. Prosiding Seminar Kebangsaan Libatsama Universiti dan Komuniti.22-23 November 2012, USM, Penang.


