Extent of Nitrate and Nitrite Pollution in Ground Water of Rural Areas of Lucknow, U.P, India
Anjali Verma1 , Amit Kumar Rawat1 and Nandkishor More1 *
1
Department of Environmental Science,
BBA (A Central) University,
Lucknow,
226025
U.P.
India
DOI: http://dx.doi.org/10.12944/CWE.9.1.17
Copy the following to cite this article:
Verma A, Rawat A. K, More N. Extent of Nitrate and Nitrite Pollution in Ground Water of Rural Areas of Lucknow, U.P, India. Curr World Environ 2014;9(1) DOI:http://dx.doi.org/10.12944/CWE.9.1.17
Copy the following to cite this URL:
Verma A, Rawat A. K, More N. Extent of Nitrate and Nitrite Pollution in Ground Water of Rural Areas of Lucknow, U.P, India. Curr World Environ 2014;9(1). Available from: http://www.cwejournal.org/?p=5533
Download article (pdf)
Citation Manager
Publish History
Select type of program for download
| Endnote EndNote format (Mac & Win) | |
| Reference Manager Ris format (Win only) | |
| Procite Ris format (Win only) | |
| Medlars Format | |
| RefWorks Format RefWorks format (Mac & Win) | |
| BibTex Format BibTex format (Mac & Win) |
Article Publishing History
| Received: | 2013-12-08 |
|---|---|
| Accepted: | 2014-01-17 |
Healthy soil, clean water and air are the soul of life. Soil, water and air are no longer clean and pure, today pose human health risks. Comprising over 70% of the Earth's surface water is undoubtedly the most precious natural resource that exists on our planet. It is essential for everything on our planet to grow and prosper. Water pollution remains one of the most visible and persistent signs of our impact on the natural world. Gomti river in Lucknow city in India, receives huge quantities of untreated waste, from industrial effluents to domestic discharge, the river becomes more of a flowing dumping yard for the 15 smaller and bigger towns in its catchment area which affects badly on human health. Although we as humans recognize this fact we disregard it by polluting our rivers, lakes, and oceans.The water pollutants include sewage, variety of both organic and inorganic pollutants including oils, greases, plastics plasticizers, metallic wastes, suspended solids, phenols, acids, greases, salts, dyes, cyanides, DDT and some heavy metals like Cu, Cr, Cd, Hg, Pb are also discharged from industries.1 The contamination of the environment with toxic metals has become a worldwide problem, affecting crop yields, soil biomass and fertility.2 In Lucknow Gomti river collects large amounts of human and industrial pollutants as it flows through the highly populous areas (18 million approx) of Uttar Pradesh. High pollution levels in the river have negative effects on the ecosystem of the Gomti threatening its aquatic life and also surronded areas of Lucknow. All industries of distillery, milk industry and vegetable oil, pouring effluent directly into Gomti and besides this domestic waste water are also discharge into the River Gomti. Drains are the main source of water pollution especially for rivers flowing within the city carry industrial effluent, domestic waste, sewage, and Medicinal waste results in pouring the water quality.3 The specific contaminants leading to pollution in water include a wide spectrum of chemicals, pathogens and physical or sensory changes such as elevated temperature and discoloration. While many of the chemicals and substances that are regulated may be naturally occurring (calcium, sodium, iron, manganese, etc.) the concentration is often the key in determining what is a natural component of water, and what is a contaminant. High concentrations of naturally occurring substances can have negative impacts on aquatic flora and fauna. Water pollution can cause by both organic and inorganic pollutants. Nitrate is an inorganic compound that can be a natural or manmade contaminant in drinking water Nitrite and Nitrate pollution is due is to excessive amount of nitrate in surface or ground water as a result of agricultural practices. Farmers and homeowners using nitrate bearing fertilizers often use a variety of pesticides and herbicides which may migrate to ground water supplies. Due to its high solubility in water, nitrate and nitrite are the most common contaminants in rural and suburban areas. Fertilizer use has led to greater contamination of surface and groundwater with nitrates essentially dissolved nitrogen fertilizer that has not been taken up by plants. Nitrate(NO3) is the main form in which nitrogen occurs in groundwater, although dissolved nitrogen may also be present as nitrite (NO2), ammonium (NH4), nitrous oxide (N2O) and organic nitrogen.4 Nitrate and Nitrite are the inorganic pollutants which degrades the water quality of drinking water. Higher concentration of metal in water and could be due to the industrial, agricultural or domestic runoff coming into the river.5 River water quality monitoring is necessary especially where the water serves as drinking water sources.6 Nitrate and Nitrite are the inorganic pollutants which degrades the water quality of drinking water. Although there are many sources of nitrogen (both natural and anthropogenic) that could potentially lead to the pollution of the groundwater with nitrates, the anthropogenic sources are really the ones that most often cause the amount of nitrate to rise to a dangerous level. Waste materials are one of the anthropogenic sources of nitrate contamination of groundwater. Water moving down through soil after rainfall or irrigation carries dissolved nitrate with it to ground water. In this way, nitrate enters the water supplies of many homeowners who use wells or springs. Many areas of the United States and other countries have reported significant contamination of groundwater from septic tanks. Ground water contamination is usually related to the density of septic systems.7 Nitrogen in organic form and ammonium can be converted by bacteria in aerobic conditions into nitrite and nitrate, a process termed 'nitrification'. Nitrate in anaerobic systems can be reduced by other strains of bacteria to nitrous oxide or nitrogen gas, by 'denitrification'. In aerobic water nitrogen occurs as nitrate or nitrite ions. Nitrate is stable over a considerable range of conditions and is very mobile in water. Ammonium and organic forms are unstable and are generally considered to be indicators of pollution. Drinking water high in nitrate is potentially harmful to human and animal health. Nitrate (NO3) is a naturally occurring form of nitrogen (N) which is very mobile in water.8 Nitrate pollution for groundwater supplies is directly related to the amount of fertilizers or other nitrogen inputs to the land, as well as the permeability of the soil. In China assessment of groundwater contamination happened by nitrates associated with wastewater irrigation.9 The United States Environmental Protection Agency is currently establishing National Primary Drinking Water Regulations for over 80 contaminants under the Safe Drinking Water Act and to reduce the contaminant concentrations of all drinking water to levels near those prescribed in the Maximum Contaminant Level Goals.10 Comprehensive assessment of Freshwater Water Resources and water availability in the world was done.11 Effect of nitrate on drinking water quality and its management.12,13 Northern China affected by Nitrate Pollution in Groundwater. Nitrate in drinking water can be effectively reduced in a number of ways. The best solution is to find an alternative water supply for drinking and cooking purposes. If other pollutants are not present, reverse osmosis systems, anion exchange units, and distillation can reduce nitrate and nitrite levels Objectives of the study were to determine the extent of nitrate and nitrite concentration in ground water of some areas of Lucknow. Four different stations of rural areas were selected namely Raibareily Road, Kanpur Road, Sultanpur Road and Hardoi Road.15 samples were collected namely from each station.
Sample Collection
The sampling of ground water was done from 4 different stations of rural areas of Lucknow. 15 samples from each station were taken. All the samples were taken from deep well hand pumps. Each sampling station covers nearly 16 Km area. Name of sites from different station are as follows:
Sampling Station (Raibareli Road)
1.Kudha, 2.Merai Khera, 3.Atrauli, 4.Kankaha Gaon, 6.Gadiyana, 7.Sikandarpur, 8.Katua Khera, 9.Kesari Khera, 10.Madhav Khera, 11.Harkansh Khera, 12.Pachauri, 13. Hualas Khera,14. Ranjeet Khera, 15. Kankaha Bazar, 16. Badan Kher.
Sampling Station (Kanpur Road )
1.Narayan Khera 2.Hindu Khera 3. Banthara Bazar 4.Kati Bagia 5. Piparsand 6. MunnaKhera 7.SaraiSahjadi 8. BalluKhera 9. Bauri Khera 10. Balhe Mau 11. Nidhaan Khera 12.Gauri 13. ShivPura 14. Shaikhpur 15. Bakhat Khera.
Sampling Station (Sultanpur Road)
l. Kasimpur Biruha 2.Gusaiganj 3.Pancham Purwa 4.Kasimpur 5. NawabAliPurwa 6.Amirpur 7.Begaria 8.Sengta 9.Kabirpur 10.Bikauli 11.Pahar Nagar 12.Malauli 13.Hardaspur 14.Salauli 15. Jahangirpur.
Sampling Station (Hardoi Road)
1.Suspan 2. Thari 3.Gahdon 4. Dilawar Nagar 5.Rahimabad 6. Jamoliya 7. Kiatholiya 18. Gopalpur9. Mundiyara 10. Mahima Khera 11. Badkhorwa 12.Kamaaluddin Nagar 13.Ater 14.Malihabad 15. Maal.
Materials and Methods
Samples were collected in precleaned bottles and labelled at the site. All samples were analysed for nitrate and nitrite concentrations within 24 hours of sampling to minimise the effect of storage by freezing and to obtain more reliable results. Presence of nitrate and nitrite are normally observed by yellow and pink colour intensity produced by Salicylic acid and NED –N-diamine dihydrochloride1Napthylethylene.14Rapid colorimetric determination of nitrate in plant tissues. Estimation of Nitrite content in soil and leaves.
(a) Reagents - For Nitrate 1. 5% Salicylic acid
Dissolve 5 gm of Salicylic acid in 100 ml of conc. H2SO4 or 1.25 gm of salicylic acid in 25 ml of conc. H2SO4. 2.
2 N NaOH Solution
Dissolve 40 gm of NaOH Pellets in 500 ml in distilled water.
(b) Preparation of Standard Curve for Nitrate
Solution
Dissolve 0.1 gm of KNO3 sail in 100 ml of distilled water.
Dilution of Stock Solution
| Stock Sol. (ml) | Dist. Water (ml) | Concentration | |
| 1. | 0.2 | 9.8 | 20 |
| 2. | 0.4 | 9.6 | 40 |
| 3. | 0.6 | 9.4 | 60 |
| 4. | 0.8 | 9.2 | 80 |
| 5. | 1.00 | 9.00 | 100 |
Procedure
Water sample 0.1 m, 0.4 ml Salicylic acid, 9.5 ml 2N NaOH Orange/Yellow colour intensity indicates the presence of nitrate in water sample. Ing noted at 410 nm by Cary Varian Bio-Spectrophotometer.
| Concentration (mg/l) | Absorbance(Optical Density) | |
| 1. | 20 | 0.0266 |
| 2. | 40 | 0.0456 |
| 3. | 60 | 0.0659 |
| 4. | 80 | 0.0829 |
| 5. | 100 | 0.1101 |
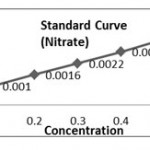 |
(a) Reagents – For Nitrite 0.01% NED- N-1-Napthylethylene diamine dihydrochloride 0.01 g in 100 ml of distilled water, 0.02 % sulphanilamide in N HCl. (b) Preparation of Standard Curve for Nitrite: Stock Solution- 0.00g of NANO2 in 100 ml distilled water Click here to View table |
(a) Reagents – For Nitrite
0.01% NED- N-1-Napthylethylene diamine dihydrochloride 0.01 g in 100 ml of distilled water, 0.02 % sulphanilamide in N HCl.
(b) Preparation of Standard Curve for Nitrite: Stock Solution
0.00g of NANO2 in 100 ml distilled water
Dilution of Stock Solution
| Stock Sol. (ml) | Dist. Water( ml) | Concentration | |
| 1. | 0.1 | 9.9 | 0.1 |
| 2. | 0.2 | 9.8 | 0.2 |
| 3. | 0.3 | 9.7 | 0.3 |
| 4. | 0.4 | 9.6 | 0.4 |
| 5. | 0.5 | 9.5 | 0.5 |
Procedure
Water sample 1 ml, 1 ml NED, 1 ml Sulphanilamide. Pink colour intensity indicates the presence of nitrite in water sample. Read it at 540 nm by Cary Varian Bio-Spectrophotometer.
| Concentration (mg/l) | Absorbance (Optical Density) | |
| 1. | 0.1 | 0.0010 |
| 2. | 0.2 | 0.0016 |
| 3. | 0.3 | 0.0022 |
| 4. | 0.4 | 0.0028 |
| 5. | 0.5 | 0.0035 |
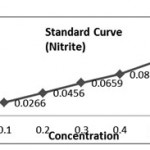 |
Click here to View figure |
Calculation of K- Factor (Nitrate)
K1 = 20/0.0266 =751.87, K2=40/0. 0456=877.19 , K3=60/0.0659= 910.47, K4= 80/0.0829= 965.01, K5= 100/ 0.1101= 908.26, (K. Aver = 4412.80/5 =882.56).
Calculation of K- Factor (Nitrite)
K1 = 0.1/00.0010 =100, K2=0.2/0.0016=125, K3=0.3/0.0022= 136.6, K4=0.4 /0.0028= 142.85, K5=0.5 / 0.0035= 142.85. (K. Avery = 647.06/5 =129.4).
Results and Discussion
Water contamination caused by the presence of excessive amounts of nitrates washed out from inorganic fertilizers.The presence in water of harmful or objectionable material in sufficient quantity to measurably degrade water quality. The largest anthropogenic sources are septic tanks, application of nitrogen-rich fertilizers and agricultural processes Common sources of nitrate include fertilizers and manure, animal feedlots, municipal wastewater and sludge, septic systems, and N-fixation from atmosphere by legumes, bacteria and lightning.
Raibareli Road ( Nitrate)
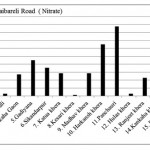 |
Raibareli Road ( Nitrate) Click here to View figure |
| 1. | Kudha | 10.712 | |||
| 2. | Merai Kuera | 7.592 | |||
| 3. | Atrauli | 1.456 | |||
| 4. | Kankaha Gaon | 13.52 | |||
| 5. | Gadiyana | 22.568 | |||
| 6. | Sikandarpur | 17.784 | |||
| 7. | Katua khera | 14.248 | |||
| 8. | Kesari khera | 0.624 | |||
| 9. | Madhav khera | 14.248 | |||
| 10. | Harkansh khera | 32.448 | |||
| 11. | Panchauri | 43.784 | |||
| 12. | Hulas khera | 1.352 | |||
| 13. | Ranjeet khera | 11.336 | |||
| 14. | Kankaha khera | 3.432 | |||
| 15. | Badan khera | 11.752 | |||
Kanpur Road (Nitrate)
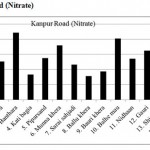 |
Kanpur Road (Nitrate) Click here to View figure |
| 1. | Narayan khera | 66.456 |
| 2. | Hindu khera | 126.568 |
| 3. | Banthara | 221.416 |
| 4. | Kati bagi | 83.616 |
| 5. | Piparsand | 138.112 |
| 6. | Munna khera | 179.504 |
| 7. | Sarai sahjadi | 115.96 |
| 8. | Ballu khera | 78.52 |
| 9. | Bauri khera | 93.392 |
| 10. | Balhe mau | 201.968 |
| 11. | Nidhaan | 135.824 |
| 12. | Gauri | 162.448 |
| 13. | Shiv pura | 110.968 |
| 14. | Shaikh pur | 136.968 |
| 15. | Bakhat khera | 100.152 |
Sultanpur Road ( Nitrate)
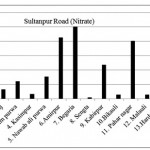 |
Sultanpur Road ( Nitrate) Click here to View figure |
| 1. | Kasimpur biruha | 12.896 |
| 2. | Gusaiganj | 33.488 |
| 3. | Pancham purwa | 61.152 |
| 4. | Kasimpur | 16.64 |
| 5. | Nawabali purwa | 76.856 |
| 6. | Amirpur | 212.68 |
| 7. | Begaria | 250.224 |
| 8. | Sengta | 4.888 |
| 9. | Kabirpur | 117.832 |
| 10. | Bikauli | 15.288 |
| 11. | Pahar nagar | 200.616 |
| 12. | Malauli | 15.08 |
| 13. | Hardaspur | 22.984 |
| 14. | Salauli | 47.32 |
| 15. | Jahangirpur | 18.512 |
Hardoi Road ( Nitrate)
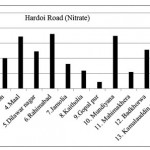 |
Hardoi Road ( Nitrate) Click here to View figure |
| 1. | Suspan | 89.752 |
| 2. | Thari | 126.464 |
| 3. | Gahdon | 100.568 |
| 4. | Maal | 171.808 |
| 5. | Dilwar nagar | 123.344 |
| 6. | Rahimabad | 180.128 |
| 7. | Jamolia | 82.056 |
| 8. | Kaitholia | 59.8 |
| 9. | Gopal pur | 22.36 |
| 10. | Mundiyana | 173.888 |
| 11. | Mahimakhera | 54.704 |
| 12. | Badkhorwa | 127.712 |
| 13. | Kamalauddin nagar | 96.616 |
| 14. | Ater | 48.984 |
| 15. | Malihabad | 196.872 |
Raibareli Road ( Nitrite)
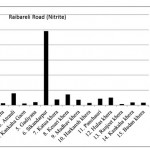 |
Raibareli Road ( Nitrite) Click here to View figure |
| 1. | Kudha | 0.0204 |
| 2. | Merai Kuera | 0.0137 |
| 3. | Atrauli | 0.0785 |
| 4. | Kankaha Gaon | 0.0121 |
| 5. | Gadiyana | 0.0198 |
| 6. | Sikandarpur | 0.492 |
| 7. | Katua khera | 0.039 |
| 8. | Kesari khera | 0.072 |
| 9. | Madhav khera | 0.0366 |
| 10. | Harkansh khera | 0.0159 |
| 11. | Panchauri | 0.0433 |
| 12. | Hulas khera | 0.0516 |
| 13. | Ranjeet khera | 0.0084 |
| 14. | Kankaha khera | 0.0182 |
| 15. | Badan khera | 0.0162 |
Kanpur Road (Nitrite)
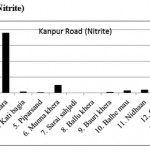 |
Kanpur Road (Nitrite) Click here to View figure |
| 1. | Narayan khera | 0.0412 |
| 2. | Hindu khera | 0.0244 |
| 3. | Banthara | 1.8998 |
| 4. | Kati bagia | 0.0384 |
| 5. | Piparsand | 0.0186 |
| 6. | Munna khera | 0.2583 |
| 7. | Sarai sahjadi | 0.0113 |
| 8. | Ballu khera | 0.0011 |
| 9. | Bauri khera | 0.0352 |
| 10. | Balhe mau | 0.0831 |
| 11. | Nidhaan | 0.0988 |
| 12. | Gauri | 0.0393 |
| 13. | Shiv pura | 0.2063 |
| 14. | Shaikh pur | 0.0089 |
| 15. | Bakhat khera | 0.1527 |
Sultanpur Road (Nitrite)
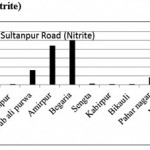 |
Sultanpur Road (Nitrite) Click here to View figure |
| 1. | Kasimpur biruha | 0.0029 |
| 2. | Gusaiganj | 0.0195 |
| 3. | Pancham purwa | 0.0027 |
| 4. | Kasimpur | 0.0037 |
| 5. | Nawabali purwa | 0.1639 |
| 6. | Amirpur | 0.4413 |
| 7. | Begaria | 0.502 |
| 8. | Sengta | 0.0093 |
| 9. | Kabirpur | 0.0037 |
| 10. | Bikauli | 0.0067 |
| 11. | Pahar nagar | 0.0803 |
| 12. | Malauli | 0.002 |
| 13. | Hardaspur | 0.003 |
| 14. | Salauli | 0.0038 |
| 15. | Jahangirpur | 0.0175 |
Hardoi Road (Nitrite)
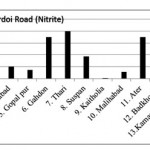 |
Hardoi Road (Nitrite) Click here to View figure |
| 1. | Maal | 0.0582 |
| 2. | Dilwar nagar | 0.0389 |
| 3. | Jamolia | 0.083 |
| 4. | Rahimabad | 0.0203 |
| 5. | Gopal pur | 0.0147 |
| 6. | Gahdon | 0.0697 |
| 7. | Thari | 0.0794 |
| 8. | Suspan | 0.0377 |
| 9. | Kaitholia | 0.0012 |
| 10. | Malihabad | 0.0114 |
| 11. | Ater | 0.0699 |
| 12. | Badkhorwa | 0.0258 |
| 13. | Kamaaludi nnagar | 0.0925 |
| 14. | Mundiyana | 0.0599 |
| 15. | Mahimakhera | 0.0738 |
The maximum level of Nitrate and Nitrite determined in ground water are found to be 250.224 mg/L (Begaria region) in Sultanpur road and 1.899 mg/L (Banthara region) in Kanpur road respectively. The enhanced levels of Nitrate and Nitrite may be due to excessive application of fertilizer, manures and irrigation.
Conclusion
The problems associated with water pollution have the capabilities to disrupt life on our planet to a great extent. No. of organizations including governmental and non-governmental are trying to combat water pollution thus acknowledging the fact that water pollution is, indeed a serious issue. But the government alone cannot solve the entire problem. It is ultimately up to us, to be informed, responsible and involved when it comes to the problems we face with our water. We must become familiar with our local water resources and learn about ways for disposing harmful household wastes so they do not end up in sewage treatment plants that cannot handle them or landfills not designed to receive hazardous materials. In our agricultural fields, we must determine whether additional nutrients are needed before fertilizers are applied, and look for alternatives where fertilizers might run off into surface waters. We have to preserve existing trees and plant new trees and shrubs to help prevent soil erosion and promote infiltration of water into the soil.As we head into the 21st century, awareness and education will most assuredly continue to be the two most important ways to prevent water pollution. If these measures are not taken and water pollution continues, life on earth will suffer severely. But the developed world must work with the developing world to ensure that new industrialized economies do not add to the world's environmental problems. Conservation strategies need to be become more widely accepted and priority need to give to restore quality and quantity of aquifers before it is too.
Acknowledgements
The authors acknowledge the Head, Department of Environmental Sciences, Babasaheb Bhimrao Ambedkar (A Central) University Lucknow-226025 for providing facilities to this work. Support to Ms Anjali Verma in the form of Ph.D. fellowship is gratefully acknowledged.
References
- Namdev D.K. and Singh K.A., Studies on Physical Chemical Properties of water in Yamuna River at Hamirpur (U.P) with special reference to occurrence of Lead, Int.J. Res. Tech, (7):215-216 (2012).
- Prasad M.N.V., Emerging phytotechnologies for remediation of heavy metal contaminated/ polluted soil and water Department of Plant Sciences, School of Life Sciences University of Hyderabad, Hyderabad 500046.A.P, India (2011).
- Srivastava S., Srivastava A., Negi M.P.S. and Tandon K., Evaluation of effect of drains on water quality of river Gomti in Lucknow city using multivariate statistical techniques, Inter . J. of Env .Scie, 2 (1) (2011).
- Singh B., Singh Y. and Sekhon G.S, Fertilizer-N use efficiency and nitrate pollution of groundwater in developing countries, Int. J.Env.Sci., 20 : (2):1.167-184 (1995).
- Gaur V. K., Gupta K.S, Pandey. D.S., Gopal K. and Mishra V., Distribution of heavy metals in sediments and water of river Gomti, Env. Mon and Ass, (102):419-433. DOI ;1007/ S 10661-005 -6395 -6 (2005).
- Ahmed M.K., Islam S., Rehman,S., Haque M.R. and Islam M.M., Heavy Metals in water, sediment and some fishes of Buriganga River, Bangladesh, Int. J. Env. Res., 4:(2) :321- 332 (2010).
- Almasri M.N., Nitrate contamination of groundwater: A conceptual management framework Water and Environmental Studies Institute, An-Najah National University, Nablus, Palestine, Environmental Impact Assessment Review,(27): 220–242 (2007).
- Morris B.L., Lawrence A.R., Chilton P.J., Adams B., Calow R. and Klinck B.A., Groundwater and its susceptibility to degradation : A global assessment of the problems and options for management. United Nations Environment Programme, Nairobi, Kenya, Early Warning and Assessment Report Series, RS, 03-3 (2003).
- TangJ. C., ChenS., ShindoY., SakuraW., ZhangY. and Shen., Research Article Assessment of groundwater contamination by nitrates associated with wastewater irrigation: A case study in Shijiazhuang region, China Hydrological Processes Special Issue: Water Crises and Hydrology in North China .18 (12): 2303–2312 (2004).
- Vogt C., Cotruvo J., D'ltri P.M. and Wolfson L, Drinking Water Standards: Their Derivation and meaning in of. eds., Rural Groundwater Contamination (1996).
- Shiklomanov I.A., Comprehensive Assessment of the Freshwater Resources of the World: Assessment of Water Resources and Water Availability in the World. Stockholm,Sweden: World Meteorological Organization and Stockholm Environment Institute (1997).
- Ibrahim A. Cisse. and Mao X., Nitrate Health Effect in Drinking Water and Management Quality, Department of Environmental Sciences and Engineering, China University of Geosciences, 430074, Wuhan ,P.R.China, Enviro. Rese. J., 2 (6) : 311-316 (2008).
- Zhang W.L., Tian Z.X., Zhang N. and Li Li.Q., “Nitrate Pollution of Groundwater in Northern China.” Agriculture, Ecosystems and Environment, (59): 223-31(1996).
- Cataldo D. A., Maroon M. and Schrader L.E., Rapid colorimetric determination of nitrate in plant tissues by nitration of salicylic acid, Commun. Soil Science and Plant Analysis, 6(1): 71-80 (1975).
- Stevens D.L. and Oaks A., The influence of nitrate in the induction of nitrate reductase in the maize roots, Canadian J Bot, (51):1255-1258 (1973).


