Study the Carbon Emission around the Globe with Special Reference to India
Ashwin Modi1 * and Mr. Nimesh2
DOI: http://dx.doi.org/10.12944/CWE.8.3.12
India was the third largest CO2 emitter in the world in 2009, following China and the United States and slightly ahead of Russia. This is due to increased coal consumption, which represented 67% of the emissions increase from 1990 to 2009. This paper represent the carbon emission in the globe and to know the carbon emission produce by the different country specific as developed and developing economy and study the contribution of the India in the carbon emission in the globe also check out the growth of the carbon emission in India.
Copy the following to cite this article:
Modi A, Bhojak N. P. Study the Carbon Emission around the Globe with Special Reference to India. Curr World Environ 2013;8(3) DOI:http://dx.doi.org/10.12944/CWE.8.3.12
Copy the following to cite this URL:
Modi A, Bhojak N. P. Study the Carbon Emission around the Globe with Special Reference to India. Curr World Environ 2013;8(3). Available from: http://www.cwejournal.org/?p=5256
Download article (pdf)
Citation Manager
Publish History
Select type of program for download
| Endnote EndNote format (Mac & Win) | |
| Reference Manager Ris format (Win only) | |
| Procite Ris format (Win only) | |
| Medlars Format | |
| RefWorks Format RefWorks format (Mac & Win) | |
| BibTex Format BibTex format (Mac & Win) |
Article Publishing History
| Received: | 2013-11-16 |
|---|---|
| Accepted: | 2013-11-30 |
Global warming is the increase in the usual temperature of Earth's atmosphere and oceans since the late 19th century. Since the early 20th century, Earth's mean surface temperature has increased by about 0.8 °C (1.4 °F), with about two-thirds of the increase occurring since 1980. Warming of the climate structure is unambiguous, and scientists are certain that it is primarily caused by increasing concentrations of greenhouse gases produced by human activities such as the burning of fossil fuels and deforestation. The amount of CO2 produced when a fuel is burned is a function of the carbon content of the fuel. The heat content or quantity of energy created when a fuel is burned is a function of primarily the carbon (C) and hydrogen (H) content of the fuel. Heat is produced when C and H combine with oxygen (O) during burning. Because natural gas is mainly methane, or CH4, it has relatively high energy content relative to other fuels, and thus a relatively low CO2 to energy content. Water and different elements such as sulfur and non-combustible elements in some fuels reduce their heating values and increase their CO2 to heat contents. Different fuels emit different amounts of carbon dioxide in relation to the energy they produce. To measure up to emissions across fuels you must compare the amount of CO2 emitted per unit of energy output or heat content.
Literature Review
Kala Seetharam Sridhar [2007] This Study has initiated how urban areas can become growth centers for an economy. Following this, the relationship between urbanization and climate change has also been discussed here. In this, first highlighted how cities contribute to climate change and provided a description of the carbon footprint of Indian cities. It represents issues such as the reverse impact of climate change on the ecology and the economy of a city. Based on the above, Study also make a case for developing urban infrastructure to enable low carbon urban growth and summarize some of the mitigating strategies cities in India have been adopting to adapt to climate change.
Raphael Calel [July 2011] This paper looks at the history of climate science, at how the economics of emissions trading developed, and at the development of international institutions to address climate change. From this historical outlook it appears that climate change was a problem in need of a solution, and that emissions’ trading was a result in search of bigger and bigger problems to solve. The political pressure to reach an international climate agreement was building rapidly in the 1990s, and the resulting marriage of climate change and carbon markets occurred before the quality of the match could be adequately assessed.
Axel Michaelowa [July2012] The development of scenarios for supply and demand on international carbon markets shows that there is a strong tendency towards a supply overhang in the period 2013-2020. It can easily reach several billion credits if new market mechanisms are introduced without a concurrent raise of demand through stricter emission commitments for industrialized countries or the shift of advanced developing countries from being a seller to becoming a buyer of credits. The CDM can easily be smashed by a long-term price slump due to a constant supply overhang.
Background of the Study
There is importance of energy both in the development of the Indian economy and in India’s growing emissions of carbon dioxide. Although carbon emissions in India remain low in per capita terms, total emissions are growing and will continue to grow with industrialization. The purpose and goal of this proposal is to Study the carbon emission around the globe with special reference to India. To fulfill the above purpose we also focus on the other concept like Green House Gas Emissions by Gas, Carbon Emission based on Developed and Developing countries, and carbon emission different country wise with specific focus on India as developing country.
Global Carbon Emissions
At the global scale, the key greenhouse gases emitted by human activities are:
- Carbon dioxide (CO2) - Fossil fuel use is the primary source of CO2. The way in which people use land is also an important source of CO2, especially when it involves deforestation. Land can also remove CO2 from the atmosphere through reforestation, improvement of soils, and other activities.
- Methane(CH4) - Agricultural activities, waste management, and energy use all contribute to CH4 emissions.
- Nitrous oxide(N2O) - Agricultural activities, such as fertilizer use, are the primary source of N2O emissions.
- Fluorinated gases (F-gases) - Industrial processes, refrigeration, and the use of a variety of consumer products contribute to emissions of F-gases, which include hydro fluorocarbons (HFCs), per fluorocarbons (PFCs), and sulfur hexafluoride (SF6).
- Black carbon (BC) is a solid particle or aerosol, not a gas, but it also contributes to warming of the atmosphere.
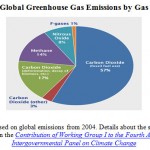 |
Figure 1 Click here to View figure |
Its carbon emissions of 593 million tones carbon dioxide (MtCO2) or 2.8% of global emission in 1990 almost tripled to 1 548 MtCO2 or 5.4% in 2009. This growth rate is much higher than the world’s average; India’s emissions between 1990 and 2009 grew by a CAGR of 5.2% vis-à-vis 1.7% for the world.
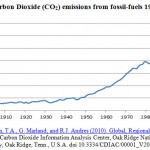 |
Figure 2 Click here to View figure |
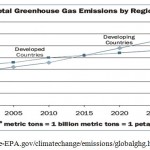 |
Figure 3 Click here to View figure |
In 2008, the top carbon dioxide (CO2) emitters were China, the United States, the European Union, India, the Russian Federation, Japan, and Canada. These data include CO2 emissions from fossil fuel combustion, as well as cement manufacturing and gas flaring. Together, these sources represent a large proportion of total global CO2 emissions. Emissions and sinks related to changes in land use are not included in these estimates. However, changes in land use can be important - global estimates indicate that deforestation can account for 5 billion metric tons of CO2 emissions, or about 16% of emissions from fossil fuel sources. Tropical deforestation in Africa, Asia, and South America are thought to be the largest contributors to emissions from land-use change globally.In areas such as the United States and Europe, changes in land use associated with human activities have the net effect of absorbing CO2, partially offsetting the emissions from deforestation in other regions.
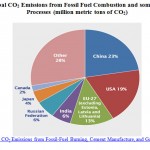 |
Figure 4 Click here to View figure |
India’s per-capita carbon emissions could reach 2.34 (tCO2/capita), which is higher than at present but still substantially lower than the world average of 4.25, with China’s per-capita CO2 emissions at 7.39 and the United States’ at 12.03 in 2035. The 450 Scenario projects that they would be 1.43 (tCO2/capita) for India, 3.59 for China, 5.98 for the United States and 2.52 globally.
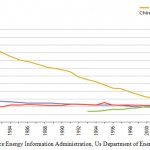 |
Figure 5 Click here to View figure |
It is important to mention that India’s per-capita carbon emissions of 1.37 tonnes carbon dioxide (tCO2/capita) were much lower than those of other countries in 2009. The world average was 4.29 (tCO2/capita), compared to China at 5.14 and the United States at 16.90. The WEO 2011 NPS assumes that in 2035, when India is projected to be the world’s most populous nation with 1.511 billion people
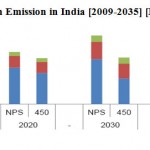 |
Figure 6 Click here to View figure |
Under the NPS, India’s carbon emissions increase to 3 535 MtCO2 in 2035 at a CAGR of 3.2%, responsible for 8% of global emission of 43 320 MtCO2. Emissions from coal combustion would be 2 227 MtCO2 or 63% of India’s total emissions. Under the 450 Scenario, India’s emissions growth would slow to a CAGR of 1.3%, reaching 2 159 MtCO2 in 2035. The share of coal-based emissions would decrease to 51%, decreasing dramatically to 1 093 MtCO2, which is near to the same level as in 2009. Such projections of a massive increase of carbon emissions in India raise concerns about their impact on global climate change.
Conclusion
The Globe has increase the carbon emission day to day for the sustainable development. All developed and developing country has done immense growth of carbon for the fulfillment of the need of the population. India has substantially low per-capita energy consumption and per-capita carbon emissions in comparison with other countries. India must expand its energy supply to provide universal access to modern energy and maintain economic growth with reducing the carbon emission. India’s growing dependence on foreign energy sources has serious policy implications for its energy security; and its coal-centered energy mix and rising carbon emissions will create serious challenges for India’s sustainable development.
References
- UNEP, UN-Habitat, World Bank, 2010. Draft International Standard for Determining Greenhouse Gas Emissions for Cities, Rio de Janeiro, Brazil.
- Chakravarty Shoibal, Ananth Chikkatur, Heleen de Coninck et al (2009). Sharing global CO2 emission reductions among one billion high emitters. PNAS Early Edition.
- International Energy Agency (2008). World Energy Outlook.
- Forum of Indian Regulators (2008). “Policies on Renewables”. November 2008
- UNFCCC, 2011. Report of the Conference of the Parties serving as the meeting of the Parties to the Kyoto Protocol on its sixth session, held in Cancun from 29 November to 10 December 2010. Conference of the Parties serving as the meeting of the Parties to the Kyoto Protocol. Decision 3/CMP.6: Further guidance relating to the clean development mechanism, FCCC/KP/CMP/2010/12/Add.2, March 2011
- Energy Information Administration, US Department of Energy (www.eia.doe.gov)
- World Bank, India. (http://go.worldbank.org/C6H9E76S60)
- Ministry of New and Renewable Energy, Govt. of India (mnes.nic.in)
- UNFCCC, 2005. Report of the Conference of the Parties serving as the meeting of the Parties to the Kyoto Protocol on its first session, held at Montreal from 28 November to 10 December 2005. Addendum.UNFCCC/KPCMP/2005/8/Ad1, http://unfccc.int/resource/docs/2005/cmp1/eng/08a01.pdf
- ETAP (2007). The Carbon Trust Helps UK BusinessesReduce their Environmental Impact, Press Release, http://ec.europa.eu/environment/etap/pdfs/jan07_carbon_trust_initiative.pdf


