The Seasonal Variation in Ionic Composition of Pond Water of Lumding, Assam, India
Tapashi Gupta1 * and Mrinal Paul2
1
Department of Zoology,
Lumding College,
Lumding,
Assam,
782 447
India
2
Department of Chemistry,
Lumding College,
Lumding,
Assam,
782 447
India
DOI: http://dx.doi.org/10.12944/CWE.8.1.12
Copy the following to cite this article:
Gupta T, Paul M. The Seasonal Variation in Ionic Composition of Pond Water of Lumding, Assam, India. Curr World Environ 2013;8(1) DOI:http://dx.doi.org/10.12944/CWE.8.1.12
Copy the following to cite this URL:
Gupta T, Paul M. The Seasonal Variation in Ionic Composition of Pond Water of Lumding, Assam, India. Curr World Environ 2013;8(1). Available from: http://www.cwejournal.org/?p=3098
Download article (pdf)
Citation Manager
Publish History
Select type of program for download
| Endnote EndNote format (Mac & Win) | |
| Reference Manager Ris format (Win only) | |
| Procite Ris format (Win only) | |
| Medlars Format | |
| RefWorks Format RefWorks format (Mac & Win) | |
| BibTex Format BibTex format (Mac & Win) |
Article Publishing History
| Received: | 2012-12-08 |
|---|---|
| Accepted: | 2012-12-26 |
The term ionic composition means conductivity of water. Conductivity is a measure of the ability of water to pass an electrical current. Conductivity in water is affected by the presence of inorganic dissolved solids such as chloride, nitrate, sulfate, and phosphate anions (ions that carry a negative charge) or sodium, magnesium, calcium, iron, and aluminum cations (ions that carry a positive charge). Organic compounds like oil, phenol, alcohol, and sugar do not conduct electrical current very well and therefore have a low conductivity when in water. Conductivity is also affected by temperature: the warmer the water, the higher the conductivity. For this reason, conductivity is reported as conductivity at 25 degrees Celsius (25 C).
Conductivity measurement is useful in estimation of the inorganic constituents in water. Dutta et al.(1988)have viewed that the levels of specific conductance depends on the inputs of large amount sa;lts and salts carried by cannals from the adjacent agricultural sites. It indicates the presence of dissolved nutrients in water. Electrical conductivity can be used as an index of TDS (Sreenivasan, 1964). After the removal of suspended solids, the material left in water is considered to be dissolved solid, which is in the formof solid residue after evaporation of water. TDS may consists of different kinds of nutrients and minerals. The present study deals with the study of seasonal variations in the conductivityand TDS of freshwater pond at Lumding.
Conductivity measures the capacity of a substance or solution to conduct electrical current. The electrical conductivity was found to fluctuate between108.00 µS/cm (November, 2011) and 246.30 µS/cm (May, 2011) in this pond and that falls within the range observed for Indian waters. Olsen (1950) classified the name for water bodies having conductivity values greater than 500.00 µS/cm as eutrophic.
Material and Methods
The study was conducted during May 2011to November 2011.
Water samples were collected from five locations randomly. The conductivity was measured by using standard conductometer and TDS was determined by procedure given by APHA, (1995) and Trivedy & Goel(1984).
Resuls and Discussion
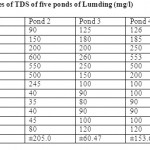
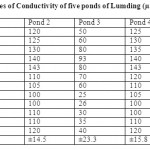
The monthly values of conductivity and TDS are given in table1 Specific Conductance is a measure of how well water can pass an electrical current. It is an indirect measure of the presence of inorganic dissolved solids, such as chloride, nitrate, sulfate, phosphate, sodium, magnesium, calcium, and iron. These substances conduct electricity because they are negatively or positively charged when dissolved in water. The concentration of dissolved solids, or the conductivity, is affected by the bedrock and soil in the watershed. It is also affected by human influences. For example, agricultural runoff can raise conductivity because of the presence of phosphate and nitrate.
 |
Table 1: Monthly values of TDS of five ponds of Lumding (mg/l) Click here to View table |
 |
Table 2: Monthly values of Conductivity of five ponds of Lumding (µmhos/cm) Click here to View table |
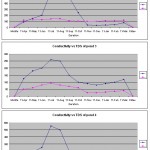
[caption id="attachment_3105" align="aligncenter" width="150"] Conductivity of five ponds[/caption] Conductivity of five ponds[/caption] |
Conductivity of five ponds Click here to View figure |
Conductivity in streams and rivers is affected primarily by the geology of the area through which the water flows. Streams that run through areas with granite bedrock tend to have lower conductivity because granite is composed of more inert materials that do not ionize (dissolve into ionic components) when washed into the water. On the other hand, streams that run through areas with clay soils tend to have higher conductivity because of the presence of materials that ionize when washed into the water. Ground water inflows can have the same effects depending on the bedrock they flow through.
Indirect effects of excess dissolved solids are primarily the elimination of desirable food plants and habitat-forming plant species. Agricultural uses of water for livestock watering are limited by excessive dissolved solids and high dissolved solids can be a problem in water used for irrigation.
The monthly values of conductivity and TDS are given in table 1. The conductivity were found to be in the range between 100-123µmhos/cm at pond 1, 100-143µmhos/cm at pond 2, 21-93 µmhos/cm at pond 3, 100-247 µmhos/cm at pond 4 and 100-143 µmhos/cm at pond 5. The maximum conductivity was recorded during the summer season while minimum during winter season. Bhatt et al., (1999) observed the highest conductivity values in the month of May and lowest in the month of December from Taudaha lake. The increase in the value of conductivity during summer may be due to low water level input of large amount of salts from the adjacent agricultural fields ( Sharma and Rathore, 2000).
The TDS Values were ranged between 35 to 195mg/l at pond 1, 40 to 245 mg/l at pond 2, 90 to 260mg/l at pond 3, 90 to 553mg/l at pond 4 and 100 to 466mg/l at pond 5. The maximum values of TDS occurred during summer and monsoon months while minimum during winter months. Qumerunsisa(1985) found the maximum TDSduring summer season and minimum during monsoon months. Sakhare and Joshi (2003) also found the higher value of TDS during summer months.
During study a positive correlation was observed between TDS and conductivity. TDS showed a positive alliance with electrical conductivity (Wiiliams, 1966; Khan and Khan, 1985 and Kumar & Paul, 1990).
References
- APHA, 1989. Standard Methods for Analysis of Water and Wastewater. American Public Health Association, Washington D.C., pp.2-1193.
- Bhatt, I.R., Lacoul, P., Lekhale, H.D. and Jha, P.K., 1999: Physico-chemical characteristics and Phytoplanktons of Taudaha lake, Kathmande. Poll. Res. 18(4): 353-358.
- Khan, I.A. and Khan, A.A. 1985: Physicochemical conditions in Seikha Jheelat Aligarh, Environment and Ecology.3(2): 269-274.
- Qumerunnisa, 1985: Ecology of freshwater ciliates. Ph.D. thesis, Marathwada University, Aurangabad.
- Sakhare, V.B. and Joshi, P.K., 2003: Physico-chemical limnology of Panas: A minor wetland in Tuljapur Town, Maharashtra, J. Aqua. Biol. 18(2): 93-95.
- Sharma, R.K. and Rathore, Vinita, 2000: Pollution ecology with reference to commercially important fisheries prospect in rural based water body: The lake Sarsal Nawar, Etawah in U.P.(India). Poll. Res. 19(4): 641-644.
- Sreenivasan,A., 1964: Hyderobiological studies of a tropical impoundment, Phavanisagar Reservoir, Madras State, India, year 1956-61. Hydrobiologia.24(4):514-539, http://dx.doi.org/10.1007/BF00142000
- Trivedy, R.K. and Goel, P.K.1984: Chemical and Biological methods for water pollution studies, environmental publications, Karad (India) 248pp.
- Williams,W.D.,1966: Conductivity and the concentration of total dissolved solids in Australian lakes. Aust. J. Mar. Freshwater Res. 17: 169-176, http://dx.doi.org/10.1071/MF9660169


