Status of Air Pollutants after Implementation of CNG in Delhi
Pallavi Saxena1 * , Richa Bhardwaj2 and Chirashree Ghosh2
1
Department of Environmental Biology,
University of Delhi,
Delhi,
110007
India
2
Environmental Pollution Laboratory,
Department of Environmental Biology,
University of Delhi,
Delhi,
110007
India
DOI: http://dx.doi.org/10.12944/CWE.7.1.17
Air pollution kills more than 5.9 million people annually, with more than 90 per cent of these deaths in capital city of India, Delhi. For improving the status of air pollution in Delhi, various policies and laws have been implemented. But even after the implementation of CNG, there was no significant change of pollutants (NOx, O3 , SPM, RSPM & CO) except SO2. The objective of our study is whether CNG conversion has impinged on the primary pollutant and tropospheric ozone pollution profile and for the improvement in the quality of air in post CNG period. To carry out the analysis, daily ambient air quality secondary data (Jan 2002-Dec 2009; Source-CPCB) of all the above discussed pollutants were used. For generating own data, NOX and O3 monitoring were carried out at four different sites viz. Site I (Yamuna Biodiversity Park, away from traffic intersection), Site II (Traffic intersection at outside YBP, outer ring road, Gandhi vihar), Site III (Aravalli Biodiversity Park, away from traffic intersection) and Site IV (traffic intersection at outside ABP, ring road, Vasant vihar) during monsoon season (Aug-Sept, 2009). The concentration of ozone was higher at sites which are at traffic intersection (Site II & IV) than those which are away from traffic intersection (Site I & III). The results however, do not indicate an all round improvement in ambient air quality of Delhi. Hence, our short term study suggests that after the implementation of CNG in Delhi there is no remarkable improvement in the status of the pollutants and moreover, the sites which are near to traffic intersection possess high concentration of pollutants than the sites which are away from traffic intersection.
Copy the following to cite this article:
Saxena P, Bharadwaj R, Ghosh C. Status of Air Pollutants after Implementation of CNG in Delhi . Curr World Environ 2012;7(1):109-115 DOI:http://dx.doi.org/10.12944/CWE.7.1.17
Copy the following to cite this URL:
Saxena P, Bharadwaj R, Ghosh C. Status of Air Pollutants after Implementation of CNG in Delhi . Curr World Environ 2012;7(1):109-115. Available from: http://www.cwejournal.org/?p=1953
Download article (pdf)
Citation Manager
Publish History
Select type of program for download
| Endnote EndNote format (Mac & Win) | |
| Reference Manager Ris format (Win only) | |
| Procite Ris format (Win only) | |
| Medlars Format | |
| RefWorks Format RefWorks format (Mac & Win) | |
| BibTex Format BibTex format (Mac & Win) |
Article Publishing History
| Received: | 2012-03-03 |
|---|---|
| Accepted: | 2012-04-09 |
Introduction
Clean air is considered to be a basic requirement of human health and for the well-being. However, air pollution continues to pose a significant threat to health worldwide (WHO 2005). The state of air pollution is often expressed as Air Quality (AQ). Air pollution has implications in a number of contemporary issues including: human health, (e.g. respiratory, cancer, allergies.), ecosystems (e.g. crop yields, loss of biodiversity), national heritage (e.g. buildings), and regional climate (aerosol and smog formation) (Monks et al, 2009).
The World Health Organization estimated that 2.4 million people die each year from causes directly attributable to air pollution with 1.5 million of these deaths are only due to indoor air pollution (WHO 2002). In Eastern Canada vehicular emission are the major contributor to Canada’s air where NOx emissions contributes to 8% and 5% contributes to total PM and SOx emissions specially during bad smog days (Environment Canada’s Performance Report 2003). Biomass burning constitutes an important anthropogenic NOx source in the tropics and subtropics of America, Africa and in South Asia. Due to high population density and higher economical growth rates, emission of these gases are increasing in Asia and more so in central and South Asia (Lelieveld and Crutzen 1994). China is the largest contributor of pollutant among Asian countries where increase in NOxgrowth rate is found to be about 7% per year (1990 to 1994) (WMO 1998). In India, most of the cities are experiencing rapid urbanization and the majority of the country’s population is expected to be living in cities within a span of next two decades (CPCB 2010). Under National Air Quality Monitoring Programme (NAMP) 2008, annual average for SO2 has not been exceeded in both the industrial (80%) & residential areas (93%) which is less than 20 ìg/ m3. Decreasing trend of SO2 may be due to various interventions that have taken place in recent years such as reduction of sulphur in diesel, use of cleaner fuel such as CNG in Delhi etc. Also there has been a change in domestic fuel used from coal to LPG which may have contributed to reduction in ambient levels of SO2. The total emission of NOx in India is in the range of 3.4 to 4.6 Tg/year. The average annual concentration of NO2 is reported to be 71µg/m3 in residential areas whereas 91µg/m3 in industrial areas during 2008. Various interventions have been taken place to mitigate ambient NO2 levels but at the same time number of vehicles has been increased exponentially which is one of the major sources of NO2 emission. During the same year i.e. 2008, the annual average concentration of RSPM is reported to be more in industrial areas (351 µg/ m3) as compared to residential areas (278 µg/m3). The reason for high particulate matter levels may be vehicles, gensets, small scale industries, biomass incineration, re-suspension of traffic dust, commercial and domestic use of fuels, etc. (CPCB 2008-09). In Delhi, the contribution of vehicular pollution has increased only in past 2-3 decades, earlier it was partly 23% in 1971 rose to 43% in 1981 and became 63% in 1991 (WWF 1995). There were 2.5 million vehicles registered in Delhi during 1996, while this number has reached 4.17 million in 2004 (MORTH 2004). Vehicular pollution accounts significantly to the total pollution generated in Delhi (Gurjar et al, 2004). After the implementation of CNG, only SO2 concentrations develop a decreasing trend, whereas the NOx concentration seems to be increasing. The explanation for increasing NOx concentration seems to be related with the significant increase in total number of vehicles each year in Delhi and with the higher flash-point of CNG (540 °C) compared to that of diesel (232–282 °C). At such a high temperature, more nitrogen from the air compresses and reacts with oxygen in the combustion chamber of CNG driven vehicles and thus produces more NOX. A study conducted by CPCB (2009) shows that 97% of hydrocarbon (HC), 76% of CO and 50% of NOx emission comes in air from vehicular activity and hence a fall/increase in the levels of these pollutants can be related to the CNG implementation. As per the studies done by various agencies, it has been observed that even after the implementation of CNG there is no improvement in the status of the pollutants except SO2. Therefore, the objective of our present study is based on whether CNG conversion has impinged on the primary pollutant and tropospheric ozone pollution profile and for the improvement in the quality of air in post CNG period (2002-2009) at secondary data collection site (ITO-X) and generated data collection sites i.e. Site I (Yamuna Biodiversity Park, away from traffic intersection), Site II (Traffic intersection at outside YBP, outer ring road, Gandhi vihar), Site III (Aravalli Biodiversity Park, away from traffic intersection) and Site IV (traffic intersection at outside ABP, ring road, Vasant vihar). The data collected on generated sites was only performed in monsoon season (Aug-Sept, 2009).
Methodology
The secondary data of the air pollutants (NO2, SO2, SPM, RSPM, CO & O3) were collected from ITO-X site in the last 7 years (2002-2009) from CPCB website (www.cpcb.nic.in). For generated data, four sites were selected which are distinct on the basis of two zones: Riverine zone [Site I - Yamuna Biodiversity Park (YBP), near Gandhi vihar, Delhi and Site II - Traffic intersection outside YBP, near Gandhi vihar, outer ring road, Delhi] and Hilly zone [Site III - Aravalli Biodiversity Park (ABP), inside Vasant Vihar, Delhi and Site IV – Traffic Intersection outside ABP Vasant Vihar, Ring Road, Delhi]. The sampling was done during monsoon season (Aug-Sept, 2009) for regularly 7 days with time interval of 8 hrs of both the pollutants one primary (NO2) and secondary (O3). High Volume Sampler (Model No: ENVIRO APM 430), was used to measure NO2 at Site I & III. The instrument has been kept at the height 10 m above the ground. Simultaneously the hourly metrological data were also recorded at these sites at all the four selected sites with the help of pocket weather monitor (Kestrel, K3000-342127,USA). For the measurement of ground level ozone (O3), ozone sensor (Model No: Aeroqual,Series 500), was used for regularly 7 days for 8 hrs at all the sites (Site I – IV).
Results and Discussion
For secondary data collection, primary pollutants which CPCB has been taken into account are NO2 ,SO2 ,SPM ,RSPM & CO and one of the secondary pollutants viz.O3. The trend of fluctuation of primary and secondary pollutants in last 7 years (2002-2009) at ITO-X site has been compiled and taken in Fig.1(a-f). The highest concentration of NO2 (126.66µg/m3) was reported in the year 2008 and in other reported years, either it crosses permissible limit (80µg/m3) or hovered around it (taken in Fig. 1a). So, it is quite interesting to note that even after the implementation of CNG programme in Delhi, NOx level is still showing increasing trend. It may be due to diesel vehicles whose sale in Delhi has registered an increase of 106% since 1999. These vehicles emits 3 times more NOx than petrol vehicles. Surprisingly, emission from a poorly maintained CNG fleet can also increase NOx because advanced testing facilities are not available for accurate NOx measurements (CSE 2004). Taken in Fig.1b), the concentration of ozone was highest (48.44µg/m3) in the year 2009. However, it did not cross the threshold level (80µg/ m3) for plant species as prescribed by NCLAN (National Crop Loss Area Network). Increase in ozone level may be due to the increase in precursor gases (NOx, CO, VOCs) (Leone and Seinfeld 1984). The profile of SO2 (Taken in Fig.1c) shows highest concentration (22.57 µg/m3) in the year 2007. Interestingly, SO2 is the only pollutant which shows significant decrease in the level after implementation of CNG programme. Here only, Government’s mitigation policy measures that appears to have had a positive impact on air quality. The reduction of sulphur dioxide in the ambient air is due to the lowering of suphur content of diesel and petrol which converts SO2 to sulphates ( a fine particle) (Narain and Krupnick 2007) . We can notice taken in Fig. 1d, the highest concentration of CO ( 3028.228µg/m3 ) which was observed in the year 2002 and in other years (2002- 2009) either it crosses or have approached the threshold value ( 2000µg/m3). Taken in Fig.8e highest concentration of SPM ( 597.34 µg/m3) was recorded in the year 2009 and also in case of RSPM highest concentration ( 301.87µg/m3 ) was also recorded in the year 2009 (Taken in Fig.8f). In other years their concentration crossed their respective permissible limits (200µg/m3) for SPM and (100µg/ m3) for RSPM. After the implementation of CNG programme, these pollutants are not showing decreasing trend, rather their concentration is increasing due to poor three-wheeler technology which includes poor quality of piston rings as well as the improper maintenance of air filters (Narain and Krupnick 2007).
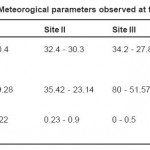 |
Table 1 : Meteorogical parameters observed at four Sites Click here to View table |
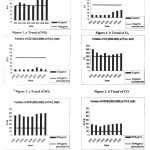 |
Figure 1 (a-f): Trend pf Primary Pollutants (NO2, SO2, SPM & SPM) Click here to View figure |
For generated data collection, as discussed in methodology section, four sites were taken into account. Yamuna Biodiversity Park (YBP) is designated as ‘away from traffic intersection’ (Site I) with dense vegetation monitoring site. The nitrogen dioxide (NO2) and ground level ozone (O3) monitoring was done during daytime (10:00a.m-6:00p.m) in monsoon month (20th -27th Aug’ 2009). Take in Fig.2, it is clearly depicted that the average concentration (for 7 days) of NO2was found to be 2.92 µg/m3 and for O3 was 23.25 µg/m3. The highest concentration of NO2 (4.16 mg/m3) was recorded on 23rd Aug’09 (4th day) and for O3 (27.1µg/m3) on 26th Aug (6th day). Moreover, from their diurnal profile, it has also been noticed that the high peaks of ozone were found at 12:00 hrs (26.87µg/m3) and at 14:00 hrs (30.98µg/m3). During the monsoon month, recorded concentrations of NO2 and O3 depicted that the peak levels were under the permissible limit for both the pollutants i.e. NO2 (80µg/m3) and O3 (80µg/m3). This observation can be supported in the earlier study at the same site (Saxena and Ghosh 2009) where they have already reported lower values of pollutant (ozone) during monsoon month as compared to summer and winter months. It is obviously due to the scavenging action of rain. Besides this, Table 1 also shows that recorded onsite meteorological data at Site I, where wind speed was little higher than other sites this can be a reason for the dispersion of pollutants which ultimately resulted in decrease in the concentration of NO2 & O3. At Site II (Traffic intersection outside YBP, Gandhi Vihar, outer ring road) has high density of vehicles (particularly heavy load trucks and buses) with less vegetation. During monsoon month, the ground level ozone (O3) was monitored during daytime (10:00a.m.-6:00p.m) (10th Aug -17th Aug’2009). Taken in Fig.3, it was clearly depicted that the average concentration (for 7 days) of O3 was 27.07 mg/m3. The highest concentration of O3 (31.26mg/m3) (6th day) and the lowest was 22.25 mg/m3. Moreover, from their diurnal profile, it has also been noticed that the high peaks were found at 13:00 pm (38.99mg/m3) and 15:00 hrs (41.75mg/m3). The recorded concentrations of O3 depicted that the peak levels were also crossing the permissible limit. This is due to the fact that as compared to Site I, Site II had shown comparatively higher concentrations of ozone due to high emission of precursor gases from the heavy traffic flow as this site is located near outer ring road and comprised of heavy vehicles like trucks and buses, which accelerates the photochemical reactions. In general, as per previous studies (Saxena and Ghosh 2010), there were high concentrations of ozone in summer as well as in winter months but this study analyzes the concentration of ozone in monsoon season, that’s why the reported values were generally less due to the scavenging action by rain (Chan and Kwok 2001). Moreover, in case of tropospheric ozone there is non-availability of sufficient solar radiation and the diurnal amplitude of ozone which is found to be very small during monsoon months (Lal et al, 2000; Saraf et al, 2003 and Jain et al, 2004). Recorded onsite meteorological data at Site II (Table 1), was also clearly reported that due to increase in the rate of wind speed there is dispersion of pollutants which ultimately resulted in decreasing in the concentration of O3 in monsoon period. Aravalli Biodiversity Park (ABP) is designated as ‘away from traffic intersection’ (Site III) with dense vegetation monitoring site. This site is closest to residential area of Vasant Vihar. The nitrogen dioxide (NO2) and ground level ozone (O3) monitoring was done during daytime (10:00a.m-6:00p.m) in monsoon month (22nd -28th Sept’ 2009). Take in Fig.4, it was clearly depicted that the average concentration (for 7 days) of NO2 was found to be 5.72 mg/m3 and for O3 was 19.70 mg/m3. The highest concentration of NO2 (9.54 mg/m3) was recorded on 25th Sept’09 (4th day) and for O3 (24.47 µg/m3) on 28th Sept (7th day). Moreover, from their diurnal profile, it has also been noticed that the high peaks of ozone were found at 14:00 hrs (21.54µg/m3) and 16:00 hrs (22.98µg/ m3). The recorded concentrations of NO2 and O3 depicted that the peak levels were under the permissible limit of both NO2 (80µg/m3) and O3 (80µg/m3) during the monsoon month. The values of O3 are generally higher in summer and winter months at this site (Saxena et al, 2009) as per previous studies but our present study was conducted during monsoon month that’s why it has somewhat lower values of ozone due to the scavenging action of rain, besides this site was also away from traffic intersection area, therefore on site emission was less which ultimately gave rise to low concentration of pollutants (Lal et al, 2000). At Site IV (Traffic intersection outside ABP, Vasant Vihar, ring road) is a densely vegetative area about 3 km away from Site III (ABP) located near Vasant vihar at ring road with heavy traffic flow (particularly two- wheelers and buses). The ground level ozone (O3) was monitored during daytime (10:00a.m.-6:00p.m) in monsoon month (15th Sept – 21st Sept’2009). Taken in Fig.5, it was clearly depicted that the average concentration (for 7 days) of O3 was 21.74 µg/m3. The concentration of O3 range from 24.55µg/m3- 19.54 µg/m3 (on 5th and 3rd day). Moreover, from their diurnal profile, it has also been noticed that the high peaks of ozone were found at 13:00 hrs (28.99µg/m3) and 15:00 hrs (35.15µg/ m3). The recorded concentrations of O3 depicted that the peak levels were at below the threshold or permissible limit. Thus, the present study concludes that even after the implementation of CNG there is no remarkable progress in the variation of air pollutants except SO2 in the last 7 years (2002-2009). Our generated data also suggests that variation in ozone concentration was very site specific. Concentration of secondary pollutant ozone was higher at site II & IV which are kerbside area, facing heavy traffic flow in comparison to vegetative site (site I & III).
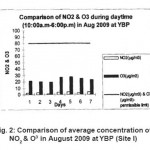 |
Figure 2: Comparison of average concentration of NO2 & O3 in August 2009 at YBP (Site I) Click here to View figure |
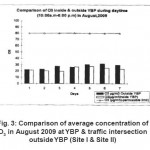 |
Figure 3: Comparison of average concentration of O3 in August 2009 at YBP & traffic intersection outside YBP (Site I & Site II) Click here to View figure |
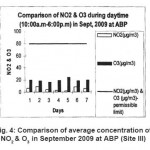 |
Figure 4: Comparison of average concentration of NO2 & O3 in September 2009 at ABP (Site III) Click here to View figure |
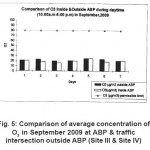 |
Figure 5: Comparison of average concentration of O3 in September 2009 at ABP & traffic intersection outside ABP (Site III & Site IV) Click here to View figure |
References
- WHO Air Quality Guidelines for Particulate Matter, Ozone, Nitrogen dioxide and Sulfur Dioxide. World Health Organization,Geneva, Switzerland 2: 1-212 (2005).
- Monks PS, Granier C, Fuzzi S, Stohl A, Williams ML, Akimoto H, Amanni M, Baklanov A, Baltensperger U, Bey I, Blake N, Blake RS, Carslaw K, Cooper OR, Dentener F, Fowler D, Fragkou E, Frost GJ, Generoso S, GinouxP, Grewe V, Guenther V, Hansson HC, Henne S, Hjorth J, Hofzumahaus A, Huntrieser H, Isaksen ISA, Jenkin ME, Kaiser J, Kanakidou M, Klimont Z, Kulmala M, Laj P, Lawrence MG, Lee JD, Liousse C, Maione M, McFiggans G, Metzger A, Mieville A, Moussiopoulos N, Orlando JJ, O’Dowd CD, Palmer PI, Parrish DD, Petzold A, Platt U, Po¨ schl . Pre´voˆt ASH, Reeves CE, Reimann S, Rudich Y, Sellegri K, Steinbrecher R, Simpson D, Brink H, Theloke J, Van der Werf GR, Vautard R, Vestreng,V, Vlachokostas Ch, Glasow R Atmospheric Composition Change Global and Regional Air Quality. Atmos Environ .43: 5268–5350 (2009) .
- WHO World Health Report: Reducing Risks, Promoting Healthy Life. World Health Organization,Geneva, Switzerland l.1: 191(2002).
- Environment Canada’s Performance Report Ground Level Ozone: Occurrence and Transport in Eastern North America. US-Canada Air Committee 2: 1-50 (2003).
- Lelieveld J, Crutzen PJ Role of Deep Cloud Convection in the Ozone Budget of the Troposphere. Science 264: 1759-1761 (1994).
- WMO Scientific Assessment of Ozone Depletion. Meteorological Organization, Global Ozone Research and Monitoring Project- WMO, Geneva, Switzerland 2: 1-45 (1998).
- Central Pollution Control Board (CPCB) India Status of the Vehicular Pollution Control Programme in India. 1: 1-65 (2010).
- Central Pollution Control Board (CPCB) India National Ambient Air Quality Status.1: 1-85 (2008-2009).
- WWF Delhi Environmental Status Report, An Information Handbook for Citizen Action. World Wide Life Fund for Nature, India l.1: 1-100 (1995).
- Ministry of Road Transport and Highways, Motor transport statistics, MORTH. Government of India, New Delhi, Retrieved on 26th March 2006 from http: morth. nic.in/ mts.htm (2004).
- Gurjar BR, Van Aardenne JA, Lelieveld J, Mohan M Emission Estimates and Trends (1990–2000) for Megacity Delhi and Implications. Atmos Environ 4: 5663 5681 (2004).
- CSE Report Right to Clean Air Campaign: Advocating Ways to Reduce Air Pollution. 2: 1-219 (2004).
- Leone JA, Seinfeld, JH Analysis of the Characteristics of Complex Chemical Reaction Mechanisms: Application to Photochemical Smog Chemistry. Environ. Sci. Technol 184: 280-287(1984) .
- Narain U, Krupnick A The Impact of Delhi’s CNG Program on Air Quality Resources of the Future, DP 07-06 (2007) .
- Saxena P, Ghosh C Comparative Variation of Tropospheric Ozone and its Precursor Gases at Traffic Intersection sites in Delhi. Evn Poll Cont J 12(6): 73-76 (2009).
- Saxena P, Ghosh C Comparative Variation of Ground level Ozone Pollution before and after the Implementation of CNG in Delhi. As J Chem 10: 7498-7506 (2009).
- Chan LY, Kwok WS Roadside Suspended Particulates at Heavily Trafficked Urban Sites of Hong Kong- Seasonal Variation and Dependence on Meteorological Conditions. Atmos Environ 35: 3177-3182(2001).
- Lal S., Naja M, Subbaraya BH Seasonal Variations in Surface Ozone and its Precursor Over an Urban Site in India. Atmos Environ 34: 2713-2724 (2000).
- Saraf N, Beig G, Schultz M Tropospheric Distribution of Ozone and its Precursor Over the Tropical Indian Ocean. J Geo Phy Res 108: 4-9.
- Jain SL, Arya BC, Kumar A, Ghude SD, Kulkarni PS Observational Study of Surface Ozone at New Delhi, India. Int. J. Rem. Sens. 24: 25-33 (2004).
- Saxena P, Kumar S, Ghosh C Pattern Change in the Concentration of Greenhouse Gas, Tropospheric Ozone at two Distinct Sites in Delhi during Post CNG Era. In Proceedings of CETAS International Conference on Changing Environmental Trends and Sustainable Development, Guru Jambheshwar University, Hisar, India. 67-71 (2009).


