Assessment of Sediment Contamination by Heavy Metals in River Orogodo (Agbor, Delta State, Nigeria)
B. R. Issa1 , F. O. Arimoro2 , M. Ibrahim3 , G. J. Birma1 and E. A. Fadairo1
1
Petroleum Training Institute,
Effurun,
Delta State,
Nigeria
2
Delta State University,
Abraka,
Delta State,
Nigeria
3
Niger State Ministry of Education,
Minna,
Nigeria
DOI: http://dx.doi.org/10.12944/CWE.6.1.03
Sediment samples from the coast of River Orogodo in Agbor, Delta State, Nigeria were sampled over four months (May to August) and analysed for heavy metals ( Cd, Mn, Fe, Cu, Ni, Pb, Zn, Cr) using Atomic absorption spectroscopic method. Some specific physico-chemical characteristics, such as organic matter, pH and conductivity which are known to influence the interactions and dynamics of metals within the sediment matrix were also determined. The result of the analysis indicates significant difference (p Mn (4.02 -0.50) > Zn (1.91 -1.11) > Cu (1.04-0.10) > Pb (0.96-0.30) > Ni (0.75-0.57) >Cd (0.43-0.09) > Cr(0.30-0.10). The significant correlation (p<0.05) however exists between some of the metals and some also show high correlations at p<0.01.The concentrations of most heavy metals are low, but iron content is higher than the background value and DPR standard for soil/sediment which indicates significant contamination by iron in the water body.
Copy the following to cite this article:
Issa B.R, Arimoro F.O, Ibrahim M, Birma G.H, Fadairo E.A. Assessment of Sediment Contamination by Heavy Metals in River Orogodo (Agbor, Delta State , Nigeria ). Curr World Environ 2011:6(1);29-38 DOI:http://dx.doi.org/10.12944/CWE.6.1.03
Copy the following to cite this URL:
Issa B.R, Arimoro F.O, Ibrahim M, Birma G.H, Fadairo E.A. Assessment of Sediment Contamination by Heavy Metals in River Orogodo (Agbor, Delta State , Nigeria ). Curr World Environ 2011:6(1);29-38. Available from: http://www.cwejournal.org/?p=1240
Download article (pdf)
Citation Manager
Publish History
Select type of program for download
| Endnote EndNote format (Mac & Win) | |
| Reference Manager Ris format (Win only) | |
| Procite Ris format (Win only) | |
| Medlars Format | |
| RefWorks Format RefWorks format (Mac & Win) | |
| BibTex Format BibTex format (Mac & Win) |
Article Publishing History
| Received: | 2010-09-03 |
|---|---|
| Accepted: | 2010-10-12 |
Introduction
The most often polluted phases of the environmental are the aquatic system, especially the surface water. This is because contaminants in air, soil or on land ultimately end up in the aquatic systems via local precipitation, water surface run-off and leaching of rocks and solid wastes (Forstner and Wiltman, 1983). Sewage, industrial wastes and agricultural chemicals such as fertilizers and pesticides, mineral and petroleum exploration and exploitation are however, the main causes of surface water pollution (Yong, 1999).
The activity of trace metals in aquatic systems and their impact on life vary depending upon the metal species. Of major importance in this regard is the ability of metals to associate with other dissolved and suspended components. Most significant among these associations is the interaction between metals and organic compounds in water and sediment. These organic species, which may originate naturally from process such as vegetative decay or result from pollution through organic discharge from municipal and industrial sources, have a remarkable affinity and capacity to bind metals (Signer, 1974).
It is widely recognized that marine ecosystems can become contaminated by trace of metals from numerous and diverse sources. However, anthropogenic activities, such as mining and industrial processing of ores and metals, still remain the principal cause of the increase amount of heavy metals which have been dumped in to the oceans (DeGregori et al.,1996).
According to Mateu et al (1996), trace metal levels can be indicators of concentration of other pollutants to which they are potentially related.
There is now considerable evidence in the scientific literature that contaminants such as trace metals, phosphorous, pesticides, PCBs and polycyclic aromatic hydrocarbons, can be taken up and concentrated by sediments and suspended matter in aquatic systems. Transportation of these contaminants associated with particulate matter represents a major pathway in the biogeochemical cycling of trace contaminants (Allen, 1982).
Heavy metals belong to the group of elements whose hydro-geochemistry cycles have been greatly accelerated by man. Anthropogenic metals emission into the atmosphere such as Pb, Hg, Zn, Cd and Cu are 1:3 orders of magnitude higher than natural fluxes. As a consequence these elements are expected to become increasingly accumulated in natural reservoirs.
Protecting sediment quality is an important part of restoring and monitoring the biological integrity of our Nation’s water as well as protecting aquatic life, wild life and human health. Sediment is an integral component of aquatic ecosystem providing habitat, feeding, spawning and rearing areas for many aquatic organisms.
Sediment also serves as reservoir for pollutants and therefore a potential source of pollutants to the water column, organisms, and ultimately human consumers of those organisms.
Contaminated sediment can cause lethal and sub-lethal effect in benthic and other sediment associated organisms (US EPA 2001). Also natural and human disturbances can release pollutants to the overlying water, where pelagic (water column) organisms can be exposed. Sediment pollutants can reduce or eliminate species of recreational, commercial or ecological importance, either through direct effects or by affecting the food supply which the sustainable population requires. The extent and severity of sediment contamination in U.S has been documented in the National Sediment Inventory (NSI). The evaluation of sediment contamination data indicates that thousands of locations have been affected through out the country (US EPA2001).
Orogodo River is one of the numerous freshwater bodies that abound in the Niger Delta area of southern Nigeria. It is a typical municipal stream flowing through Agbor town with a pollution of over 100,000 people (Arimoro et al, 2008). The river is subjected to organic pollution load arising from the effluent discharge from the abattoirs stations along the river bank, which comprises of stomach and intestinal contents of slaughtered animals, ashes of burnt animals materials that are slaughtered daily that makes up an enormous volume of waste discharge regularly into the stream without treatment. Furthermore, the river is influenced by frequent disturbance from human and animal activities which if not properly managed can pose severe health risk to the populace. There is need to assess the level of heavy metal contamination in Nigeria water sediments and also see the effect of these contamination to the aquatic life and ecosystem in general.
This work covers sampling of whole sediment and analysis to ascertain the level of contamination of heavy metals in River Orogodo.
The consistent sediment collection, holding time consideration, sediment manipulation and storage methods were used to help provide high quality samples with which accurate data can be obtained for the national inventory and for other programs to prevent, remediate, and manage contaminated sediment and this work would also attempt to make some recommendations.
Material and Methods
Description of the Study Area
River Orogodo lies between latitude 5°.10’-6°.20’ N and longitude 6°.10’—6°.21’E (fig. 1) The River is fed principally by ground seepage from an aquifer in the thick rainforest of Mbiri and secondarily by precipitation, municipal effluence and surface run off from the riparian communities. The River flows through the major town of Agbor in Southern-Nigeria. The river substratum consists mainly of fine sand mixed with mud and occasionally with coarse sand and pebbles. Decaying macrophytes and debris also form part of the substratum. The climate of Agbor town and its environs, although comparatively stable, is not uniform. A rhythm of rainfall occurs in conjunction with movements of the southwest Monsoon winds across the Atlantic Ocean and the timing of these movements varies from year to year.
Site I
The station is located at the point of discharge of effluents from the Agbor Abattoir. The abattoir effluent is mainly organic, made up of faeces, blood and ashes produced during the slaughter, roasting and burning of animals (donkeys and cows). This station is exposed to direct heat of the sun and has heavy algal growth in some areas but, with very few macrophyes (Nymphae lotus, Azolla spp, utricularia sp and Salvinia sp.) and duckweeds (Lemna) closed to the banks. The steambed is covered by coarse sand. The current velocity is relatively fast (mean value = 0.58 ms-1). Average depth is about 0.5 m and width 5.8 m/ Rubbish and domestic waste from the town are emptied into the river few kilometers from this station during heavy down pour (Arimoro et al, 2008).
Station II
The sampling station is located within the main town at Agbor, about 500m from site I and has a depth range of 0.38 m – 0.50 m. The current velocity ranges from 0.58 – 0.68 ms-1. This site is heavily perturbed by various human activities including laundering, car washing, dumping of refuse and defecation by both humans and livestock. During the early hours of the day, nomadic cattle herders take their animals to this site to drink and feed on grasses by the side of the river, coincidentally voiding their excreta into the water. The sparse vegetation in this site consists mainly of commelina, Nymphaea sp., Pancium repens, Pistia stratiotes and Vossia Cuspidata.
|
|
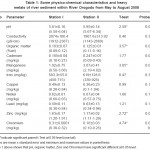
Table 1: Some physico-chemical characteristics and heavy metals of river sediment within River Orogodo from May to August 2008 Click here to View table |
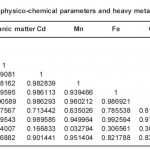 |
Table 2(a): Correlation matrix between some physico-chemical parameters and heavy metals in Station I of River orogodo study area Click here to View table |
Sample Collection
High density polyethylene container was chosen because its relatively inert nature and generally unbreakable. All the sample containers were soaked for seven days in hydrochloric acid (HCl), followed by seven days in nitric acid (HNO3) and finally Seven days in deionized water. The cleaned containers were labeled, (US EPA, 2001).
The bed sediments were collected in each station using 20cm Birge-Eckman grab sampler and transferred into the cleaned containers.
Sample transport and storage
The transport and storage method was designed to maintain structural and chemical quality of the sediment. The sediment collected was transferred from the sampler to the sample container where it was temporarily stored and transported immediately to the laboratory for the next stage.
Sample preparation
In the laboratory, samples were air dried for two weeks before grounded into fine particles using pistil and mortar and sieved through a 2mm sieve.
About 200g of the sieved samples were sub sampled by quartering for analysis. Extraction of metals from sediment, using mixed acid digestion method was done. 20ml of a mixture of concentrated HClO4 and HNO3 at a 2:1 ratio (v/v) on a hot plate and the mixture was heated to almost dryness. 20ml of HNO3 was added to the solution and filtered in to 50ml volumetric flask through whatman 42 filter paper. The filtrate obtained was made-up to 50ml mark with distilled water.
Laboratory Analysis
The pH of sediment samples were determined using Jenway pH meter (model 3520) following the procedure described by Hender short et al (1993). Total organic matter and conductivity were analysed following the procedure described by Radojavic and Bashkin, (1999). The total concentration of heavy metals was determined using Atomic Absorption Spectrophotometer (Unicam, model 969). All acid used were analytical grade and Quality Control was assured by the use of procedural blank.
Discussion
The mean of four (4) month variation results of specific physicochemical characteristics and some heavy metals analysed in River Orogodo sediments within the study area are presented in table two.1 The pH was slightly acidic in a range 5.58- 6.34, which is peculiar to Nigerian soil/ sediment ( Odu, 1996). The low pH condition affects metal speciation and may enhance metals’ solubility and possible leaching into the water column.
High acidity of sediment has been attributed to a combination of possible oxidation of pyrity (FeS2) in the sediment to produce sulfuric acid, depleted calcium level or increased aluminum concentration in sediment (Odu, 1996).
The result of the total organic matter lies in the range of 0.09- 0.19 (%wt). Total organic matter influenced the other physical and chemical sediment characteristics including reserve of exchanged bases and interaction and dynamics of trace metal, hence maximum soil/sediment capacity for heavy metals are adjusted according to these macro-nutrients DPR (2002). Organically bound metals may dissociate as free ions and participate in cation exchange reactions with various minerals and leaving organisms, depending on ambient pH, ionic strength and temperature. Hence the organic matter of sediments is known to play a major role in determining the bioavailability of heavy metals (Adams et al, 2002).
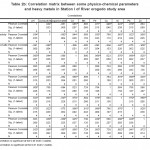 |
Table 2(b): Correlation matrix between some physico-chemical parameters and heavy metals in Station I of River orogodo study area Click here to View table |
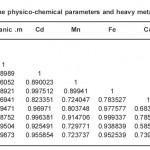 |
Table 3(a): Correlation matrix between some physico-chemical parameters and heavy metals in Station II of River orogodo study area Click here to View table |
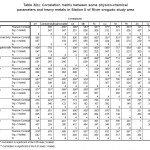 |
Table 3(b): Correlation matrix between some physico-chemical parameters and heavy metals in Station II of River orogodo study area Click here to View table |
It is observed from table 2 that the concentration of each metal in the sediments increases from station I to II. The colour of the sediment which varies from brown to reddish brown could have been impacted by the presence of high iron content in the sediment.
It is difficult to make an overall assessment of the degree of the contamination of sediments by heavy metals because of the variations in the concentration of heavy metals within locations.
As can be seen from table (2) above, metal levels in the two stations exist in the order Fe >Mn >Zn >Cu >Pb > Ni >Cd > Cr, most of which were generally lower than those reported for Lagos lagoon (Okoye, 1991) and Niger Delta coastal waters (Kakulu et al, 1988). However, similar trend in some heavy metals distribution was obtained in other similar studies. The high concentrations of Fe in the sediment have no identifiable point source discharge rather than lithological or crustal origin (Asaolu, 1998). There is no doubt that wastes generated due to human activities are discharged on land or stream in and around the study area were transported by surface run-off to the water body by rain. Thus, contribution from run-off in this regard may be significant as evident in the concentration distribution of these metals in river Orogodo sediment (Table1). On the other hand, the relatively low metal level recorded in the study which is also exposed to municipal run-off may be attributed to the resent dragging of the river.
Matrices of correlation coefficient between the metal levels in the sediment for the four (4) month variation (Table 3a and 3b respectively) show high significant (p<0.05) which is the direct correlation between some of the metals. The high correlation between metals indicates common lithological or crustal sources for the metals rather than the anthropogenic sources (Turekian, 1977).
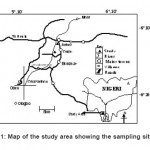 |
Figure 1: Map of the study area showing the sampling sites Click here to View figure |
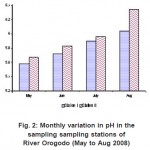 |
Figure 2: Monthly variation in pH in the sampling sampling stations of River Orogodo (May to Aug 2008) Click here to View figure |
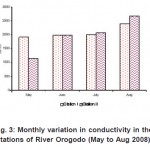 |
Figure 3: Monthly variation in conductivity in the stations of River Orogodo (May to Aug 2008) Click here to View figure |
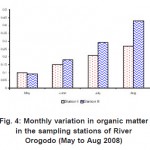 |
Figure 4: Monthly variation in organic matter in the sampling stations of River Orogodo (May to Aug 2008) Click here to View figure |
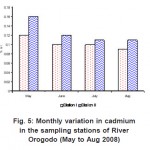 |
Figure 5: Monthly variation in cadmium in the sampling stations of River Orogodo (May to Aug 2008) Click here to View figure |
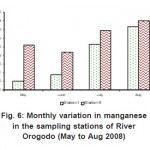 |
Figure 6: Monthly variation in manganese in the sampling stations of River Orogodo (May to Aug 2008) Click here to View figure |
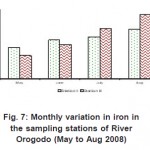 |
Figure 7: Monthly variation in iron in the sampling stations of River Orogodo (May to Aug 2008) Click here to View figure |
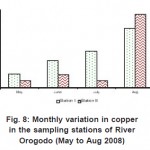 |
Figure 8: Monthly variation in copper in the sampling stations of River Orogodo (May to Aug 2008) Click here to View table |
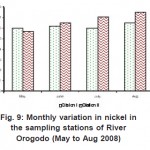 |
Figure 9: Monthly variation in nickel in the sampling stations of River Orogodo (May to Aug 2008) Click here to View figure |
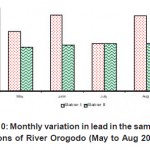 |
Figure 10: Monthly variation in lead in the sampling stations of River Orogodo (May to Aug 2008) Click here to View figure |
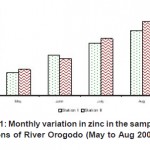 |
Figure 11: Monthly variation in zinc in the sampling stations of River Orogodo (May to Aug 2008) Click here to View figure |
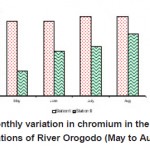 |
Figure 12: Monthly variation in chromium in the sampling stations of River Orogodo (May to Aug 2008) Click here to View figure |
Conclusion
This study presented data on the baseline pollution of bottom sediment of River Orogodo by heavy metals. It is shown that the concentrations of heavy metals like Zn, Pb Cr, Mn, Ni, C u, and Cd in the sediment are low, but require monitoring to prevent an increase. The concentration of Fe is higher when compared with the background value and target/ intervention values for micropollutant of a standard soil which may constitute risk to the environment. The concentration of heavy metals in the sediment increased from station I to station II.
References
- Arimoro, F. O. and Ikomi, R. B., Response of Macroinverted rate communities to abattoir wastes and other anthropogenic activities ina municipal stream in the Niger Delta, Nigeria Environmentalist 28: 85-98 (2008) .
- Asaolu, S.S, Chemical pollution studies of coastal waters of Ondo State 15-17 (1998).
- Barciela-Alonso, M.C, Tubio-Franco M. and Prege, R, Nickel and Cobalt determination in spectrometry and their distribution in the Rig of ferrol (NW). marine pollution Bulletin, 45: 1404-1515 (2003).
- DPR, Environmental Guidelines and standards for the Petroleum Industries in Nigeria (Revised edition), 280pp (2002).
- Degregori, I., Pinochet, H., Arancibia, M., Vida, A., Grain size effects on Trace metal’s distribution in sediment from two coastal Areas of chile . Bull. Environmental Contamination Toxicology.57: 163-170 (1996).
- Forstner, U. and Wiltman, G. T, metal pollution in aquatic environment. 2nd edu (Springer – Verlag, Berlin) 486pp (1983).
- Horsfall, M. J. and Spiff A., Distribution and partitioning of trace metals in sediments of the lower reaches of the new Calabar, River, Port-Harcourt, Nigeria Environmental; Monitoring and Assessment. 78: 309-326 (2002).
- Kakulu,S.E and Osibanjo, ‘’Trace heavy metal pollution status in sediment of the Niger Delta area” Nigeria J. Soc. Nig. 13: 9-15 (1988).
- Nabr, S. M., Okbah, M. A and kasera, S. M, Environmental Assessment of Aden port, Yemen. International Journal of Oceans and Oceanography 1(1): 99-109 (2006).
- Okoye, B.C.O., Heavy metals and organisms in the Lagoon, International Journal of environment studies, 37: 285-292 (1991).
- Odu, C.T.I. ‘’Pollution and Rehabilitation of wetland soils of Nigeria’’ Monograraph.(2). Soil Science Society of Nigeria 107-113 (1996).
- Pekey, H. D., Karakas, S. Ayberk, L. Tolun and Bakoglu, M, Ecological risk assessment using trace elements from surface sediments of Izmit Bay (Northerneastern marinara sea) Turkey Marine pollution Bulletin, 48: 946 -953 (2004).
- Philips D. A, Chemistry and Biochemistry of trace metal in biological systems. In effect of heavy metal pollution on plants, Vol.I (Ed) lepp, N. W Applied Science publishers London and New Jersey, 1-54 (1981).
- Turekian, K. K., “The fate of metals in Oceans”. Geochemical et Cosmochimica Acta, G. Britain, 41: 1139-1144 (1977).
- United State environmental protection Agency methods for collections, storage and manipulation of sediments for chemical and toxicological analysis. Technical manual (3-1) – (3-13), (4-1) (4-15) (2001).
- Singer, P. C., Trace metals and metal organic interactions in Natural waters. Ann Arbour Science, USA (1974).
- Schlinder, P. W., The regulation of heavy metal concentration in natural aquatic systems. In heavy metals in the environment I (Ed) Vernet, T. P Elsevier, Amsterdam, London, New York and toyko 95-124 (1991).
- Turekian, K. K., “The fate of metals in Oceans”. Geochemical et Cosmochimica (1977).
- Yong, T. C., “water pollution by ariculture, agro industry and mining in metalsia” Proceedings of the Regional workshop on water Quality management and control of water pollution in Asia and the pacific FAO water Reports 21: 133-138 (1999).


