Water quality assessment of Kalingarayan canal at Erode district, Tamilnadu (India)
A.R.K. Kulandaivel1 * , P.E. Kumar1 and P.N. Magudeswaran2
1
Research Department of Chemistry,
Erode Arts College (Autonomuous),
638 009
India
2
Department of Chemistry,
V.L.B. Janakiammal College of Engineering and Technology,
Coimbatore,
641 042
India
http://dx.doi.org/10.12944/CWE.4.1.34
Kalingarayan canal is one of the historically important irrigation water sources in Erode District. Recently the water in the channel being polluted by letting out untreated tannery and textile effluents. It has been decided, therefore, to carryout a study on the quality of water and its pollutional load. The quality of water is determined by examining physicochemical and biological characteristics. In order to present a simple and comprehensive Water Quality Index (WQI) that could be understood by non-technical experts and common man, the standard NSF method has been adopted. An alternative WQI omitting Temperature, BOD and phosphates has been evaluated and the correlation between NSF index and this new index has been good. The study revealed that the channel water is highly polluted and could be used for irrigation only.
Copy the following to cite this article:
Kulandaivel A.R.K, Kumar P.E, Magudeswaran P.N. Water quality assessment of Kalingarayan canal at Erode district, Tamilnadu (India). Curr World Environ 2009;4(1):199-202 DOI:http://dx.doi.org/10.12944/CWE.4.1.34
Copy the following to cite this URL:
Kulandaivel A.R.K, Kumar P.E, Magudeswaran P.N. Water quality assessment of Kalingarayan canal at Erode district, Tamilnadu (India). Curr World Environ 2009;4(1):199-202. Available from: http://www.cwejournal.org/?p=943
Download article (pdf)
Citation Manager
Publish History
Introduction
Kalingarayan canal of 750 years old travels a distance of about 90 kms from Kalingarayan anicut to Avudayaparai. It is 534 foot above sea level where it originates and its sea level is 412.40 foot where it merges with the Noyyal river. The channel traverses a serpentine route.
The survey of land showed that it irrigated an area of 15743 acres. It has been in practice to open its water gates for irrigation for a period of 320 days from June to April every year. Flow of water in the channel is controlled and regulated by the Public Works Department under the direction of Tamilnadu State Government.
In recent times, industrialization and urbanization of this region, especially in and around Erode, led to pollute water in channel. It has been necessitated to study the quality of water in the Kalingarayan Canal being used for irrigation and other purposes.
The Quality of surface water being evaluated employing widely used NSF index. It enables decision-makes non-technical personnel and the common people to understand the quality of water that they utilize and consume. A modification of NSF index method has been attempted to suit surface waters of western region of Tamilnadu.
Experimental
The sample were collected from 8 sampling stations (Table 1) at 9 a.m. everyday continuously for one month period. The sampling stations were selected at every 5 or 6 kms distance based on the pollutional load of canal water from its stating point to tail-end. About two liters of sample water found to be sufficient to carry out all the physical and chemical tests. For chemical, biological and microbiological examinations, different methods of collection and handling were adopted.
The water quality parameters were determined using standard methods (APHA 1998). Table-2 shows the parameter evaluated and method of determination
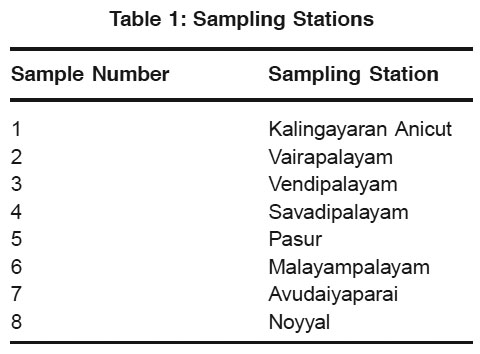 |
Table 1: Sampling Stations Click here to view table |
Results and Discussion
Water Quality Index Calculations
Water Quality Index (WQI) of surface water has been calculated taking into account nine water quality parameters such as pH, total solids etc. WQI is a unit less number of 100 point scale that provides a pointer to the quality of water source.
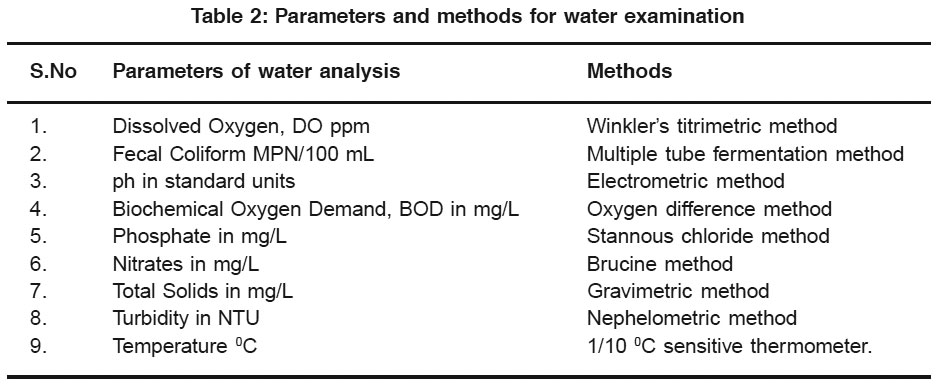 |
Table 2: Parameters and methods for water examination Click here to view table |
Each water quality parameter was measured and referred to the standard weighing curve chart available in the test and the corresponding water quality value was noted from the chart. Using the Q values and their respective weight factors the overall water quality index was calculated.
An alternative method of computing WQI which suits the prevailing conditions of Western districts of Tamilnadu was proposed by Magudeswaran. In this method, the weighting factor of temperature, biochemical oxygen demand (BOD) and total phosphates were distributed over other parameters. The new WQI has given weighting factors for various water quality parameters as follows:
WQI = 0.25 DO + 0.23 FC + 0.16 pH + 0.14 TN + 0.12 Tur + 0.1 TS.
The water samples have been subjected to standard methods of analyses and the results are presented in Table 3.
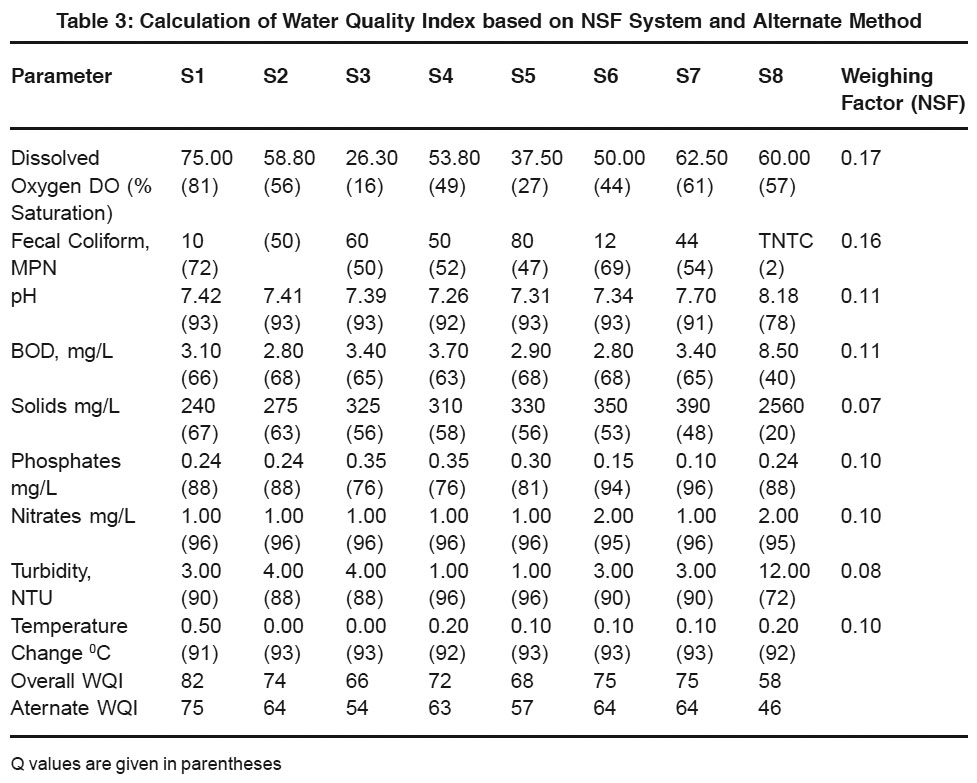 |
Table 3: Calculation of Water Quality Index based on NSF System and Alternate Method Click here to view table |
Dissolved Oxygen (DO) has greater significance to assess quality of water sources. It reflects the aquatic life sustaining ability and the pollution load of the sample. DO standard values fixed by many national and international organizations lies between 4 mg/L to 8 mg/L. The observed results indicate that in sampling stations (S3 Vendipalayam-2.1 mg/L), (S5 Pasur-3 mg/L) and (S6 Malayampalayam – 4 mg/L), DO vaues is below 4mg/L. Sampling station is 3 is nearly 25 kms away from the starting point. While it travels, on the banks of canal, textile and tannery untreated effluents are freely allowed to mix with the stream. And here colour of the sample is slightly turbid. It is proved beyond doubt that canal is a source for discharging untreated and partially treated industrial waste water.
Fecal Coliform count investigation throws light on the sanitary condition of the water. Its amount determine the suitability of water for drinking and other purposes. In a few sampling staions (S5 and S8), the MPN value is high and it is very high at the Noyyal river. It indicates clearly that untreated domestic waste water is let out into the canal water. The raw water could not be taken out for drinking purposes without proper disinfection. pH is a measure of hydrogen ion concentration in a solution. Its value should be in the range pH 6.5-8.0. The Table-3 shows that is exceeds pH=8 at Noyyal and pH 7.7 in the tial-end of the canal. Avudayarparai. As the pH lies within the permissible limit and has no direct hearing on its suitability for drinking purposes, it would affect the soil and crop production. Biochemical oxygen demand (BOD) is an indicator of microorganism present in the water source and shows its pollutional load. At all these sampling stations BOD values remains around 3 mg/L except at Noyyal, it is 8.50 mg/L indicating here water is highly polluted. During the course of its flow, the canal water carries much of its organic matter derived from domestic sewage and industrial effluents.
The total solids value is maximum at Noyyal (2560 mg/L) and maintains a slight variation at all other sampling points reflecting insoluble suspended particles in water. The agricultural run off and industrial effluents contribute towards the content of total nitrates and phosphates. The study pointed out to the fact that definitely the canal water has nitrates and phosphates that affect quality of water.
Turbidity measure suspended matter in a sample of water. Besides Noyyal which showed turbidity of 12 NTU, it has 4 NTU at Vairapalayam (sampling station 2). It is a well-known fact that dyeing units situated on the right bank of the canal freely allow their effluents into canal stream.
Temperature has not shown much variation in all these sampling stations. The overall water quality index (WQI) from Table 3 indicates a steep decline in the quality of canal water at Vendipalayam (S3) from its starting point S1 to S3, where it travels a distance of about 30 kms. It confirms that the canal water being polluted by all possible means and methods. A slight improvement in WQI at sampling stations might be attributed to seepage of water from agriculture land spread across on either side of the canal. This view has been supported by the fact that the total nitrates and phosphates values have been relatively higher at these two place. At Noyyal WQI is 58. The NSF legend describes the water quality as ‘medium’. At all other sampling stations too, the water could be rated as ‘medium’ except at Kalingarayan anaicut (WQI is 82) considered as ‘good’.
A comparison of water quality index calculated using NSF and alternate method are in good agreement. In both the system of evaluation, the difference between WQI indices of any two adjustant sampling stations are of the same magnitude. It is learnt that WQI indices differ in their numerical value but the qualitative aspect of the sample of water remains the same. Conclusively it could be established that either NSF or alternate method proposed by Maudeswaran could be used for evaluating surface water quality characteristics.
Conclusion
Kalingarayan canal water quality has undergone considerable changes through its course from 0 km to 90 kms. Surface water quality index calculated on the basis of NSF and alternate method agree well and shows that the canal water being polluted by many textile processing units and tanneries situated on the right bank of the canal. A recent report (The Hindu, 2008) has revealed that the canal water flow is obstructed due to growth of water plants. Consequently the tail-end farmers doe not get adequate supply of water for irrigation purpose. Near its tail-end at Avudayaparai, the size, velocity and quality of water are reduced to a larger extend. The present study adduces evidences to the farmers’ cause and concern of this region.
Acknowledgements
The authors would like to acknowledge the Management, Principal and Department colleagues for having provided necessary facilities and rendered cooperation to carry out this work.
References
- APHA, Standard Methods for the Examination of Water and Waste Water, 20th ed. American Public Health Association, Washington, DC (1998).
- Brown R.M., Mc. Clelland, Deininger R.A. and Togen R.G., A Water quality index-DO we dare? Water sewage works, (1970) 11: 339-343.
- Horton R.M., An Index number system for rating water quality, J. Water Poll. Control Fed. (1965) 37: 300-305.
- Magudeswaran, P.N. and Ramachandran T., Water Quality Index of River Noyyal at Trippur, Tamilnadu, India, Nature, Environment and Pollution Technology, (2007) 6(1): 51-54.
- Magudeswaran, P.N. and Ramachandran T., Water Quality of Rivers Siruvani, Bhavani and Noyyal using Alternate Water Quality Index, Poll. Res. (2006) 25(3): 519-523.
- Raju, S. Kalingarayan Canal, Kongu Research Centre, Erode, Tmilnadu (2007).
- The Hindu, 2008, 25th September Tamilnadu Edition. http://www.water-research.net/ watrqualindex/index.html


