The water quality assessment at historical places, Ellora caves and Khultabad area of Aurangabad region
Haridas B. Nagre1 and Z.M. Zine2
1
Department of Chemistry,
Vivekanand College,
Aurangabad,
431 001
India
2
Department of Chemistry,
Vinayakrao Patil College,
Aurangabad,
431 005
India
http://dx.doi.org/10.12944/CWE.4.1.35
Assessment of drinking water quality which involves physicochemical parameters revealed that the sample characteristics are varied considerably. In all, nine water samples were selected, out of which four samples were from Ellora caves and five from Khultabad. The water samples were assessed for parameters such as Temperature, pH, BOD, COD, Hardness, SO42-, Nitrate and Fluoride. The period of assessment was from September to December 2008.
Copy the following to cite this article:
Nagre H.B, Zine Z.M. The water quality assessment at historical places, Ellora caves and Khultabad area of Aurangabad region. Curr World Environ 2009;4(1):203-206 DOI:http://dx.doi.org/10.12944/CWE.4.1.35
Copy the following to cite this URL:
Nagre H.B, Zine Z.M. The water quality assessment at historical places, Ellora caves and Khultabad area of Aurangabad region. Curr World Environ 2009;4(1):203-206. Available from: http://www.cwejournal.org/?p=945
Download article (pdf)
Citation Manager
Publish History
Introduction
With its many fold shining aspects, Aurangabad is also world famous for its historical Ellora caves and Mughal emperor Aurangajeb’s Tomb at Khultabad. These places are 33 and 30 km. away respectively from Aurangabad. The ancient town Ellora is situated on the bank of river Yelganga which originates from nearby basaltic mountains of Deccan platue. The location oif Ellora is 20° 00’ N and 75° 10’ E. It is also famous for its pilgrim the Ghrishneshwar Temple, one of twelfth Jotirlinga of lord Shiva. The Vishwakarma Shivalaya Kund which is also called as Ahilyabai Holkar Tank and Janardhan Swami Matha are another specialties of Ellora. Thousands of people from every corner of world visit Ellora. Therefore it was proposed to assess the water quality of this area.
Four sampling sites are from Ellora as Shivalaya Kund, Ghrishneshwar Temple well, well from Janardhan Swami matha and bore well sample from Pawan Ganpati mandir area. Another sampling station selected was Khultabad, situated to south east of Ellora. The mughal emperor Aurangajeb’s Tomb and Bhadramaruti mandir are in Khultabad. The famous hill stations “Mhaismal” and “Shulibhanjan” are near by places. Five sampling sites were selected from Khultabad area, out of them “Dharam Talab” and “Pangra Talab” and parionka talab were tanks. One sample was from well at “Bhadramaruti Temple” and the other was from bore well situated at the centre of town.
Material and Methods
All samples were collected in 500 mL sterilized bottles for physicochemical analysis. AR grade chemicals were used for preparation of regents in double distilled glass water. Physical parameters like Temperature, pH were measured on the spot by using water analysis kit. Remaining parameters were determined by using standard procedures.1
Results and Discussion
The results on water quality from different sampling sites are given in Table 1 and 2 and are interpreted subsequently.
S1 = Tank (Ahilyabai Holkar Tank)
S2 = Dug Well (Ghrishneshwar Tample area)
S3 = Dug Well (Janardhan Swami Math area)
S4 = Bore Well (Pawan Ganesh Mandir area)
S5 = Tank (Dharam Talab)
S6 = Tank (Pangra Talab)
S7 = Dug Well (Bhadra Maruti Temple area)
S8 = Bore Well (Khultabad Town)
S9 = Tank (Parionka Talab)
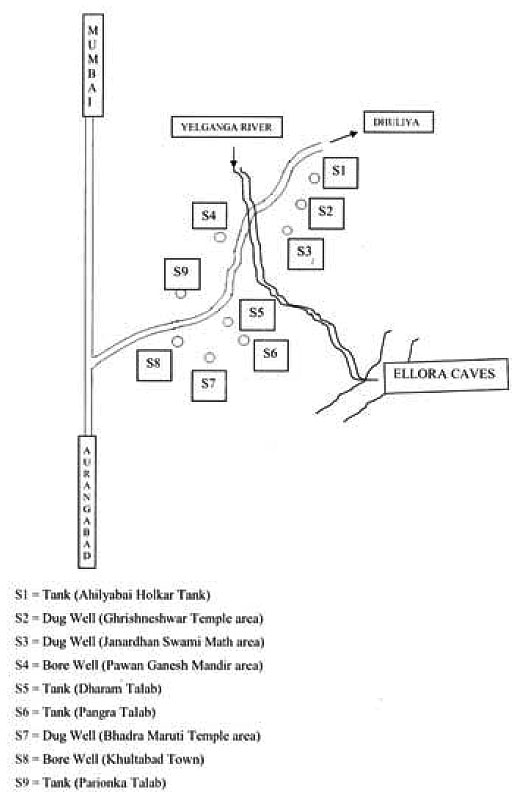 |
Image 1 Click here to view image |
Temperature
The various chemical and biological actions in water organisms depend upon temperature.2 The temperature of water depends on atmospheric conditions. The increase in temperature of water reduces solubility of gases, changes the taste and fastens the chemical reactions in water.3 The maximum temperature 26.2 °C was recorded at sit S9 and minimum 24.1 °C at sit S4.
pH
The pH is one of the most important parameters deciding the extent of water pollution.4 It affects directly the chemical and biological reactions in water.5 In present study the pH range noted was nearly neutral i.e. 6.90 to 7.25. The maximum pH value 7.40 was noted at site S5. The pH range given by the ISI standards6 for bathing and drinking water is in between 6.50 to 8.50.7 Hence it can be concluded that the pH range of these samples are within range.
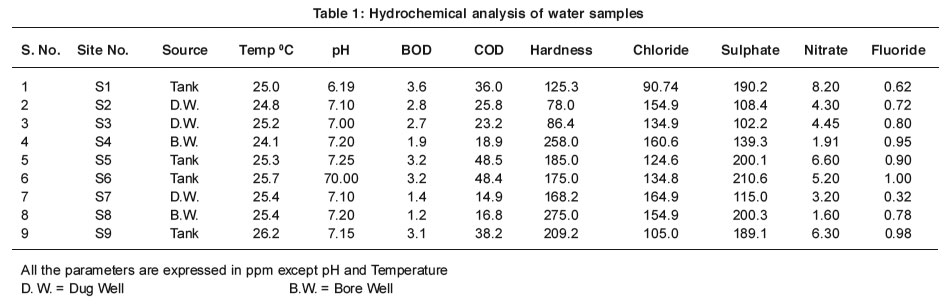 |
Table 1: Hydrochemical analysis of water samples Click here to view table |
BOD
The BOD is one of the most important parameters in water quality assessment.8 It reflects in physical, chemical and biological processes prevailing in water. Its maintenance is very important for survival of biological forms. The permissible limit of BOD is 8 ppm.9 In the present investigations the values of BOD are in desired limit.
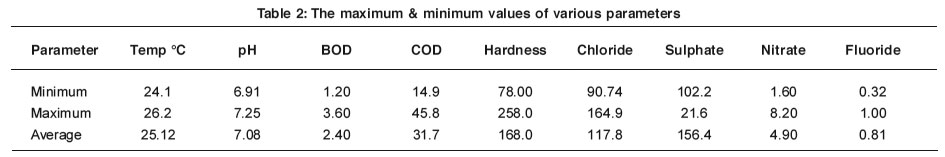 |
Table 2: The maximum & minimum values of various parameters Click here to view table |
COD:
The COD plays important role in deciding the extent of water pollution. The permissible limit of COD is 100-150 ppm. High COD values have detrimental effects on aquatic life. In the present investigations the values of COD are in acceptable limit.
Hardness
The total hardness is an important parameter of water quality assessment. The hardness of water is due to salts of calcium, magnesium with carbonates, bicarbonates and sulphates10. The degree of hardness can be classified11 as:
|
ppm |
water quality |
|
<50 |
soft |
|
50-150 |
moderately hard |
|
150-300 |
hard |
|
>300 |
very hard |
The total hardness of water samples under investigation ranges from 78 to 275 ppm.
Chlorides
The chloride is the best indicator of water pollution.12 The chloride concentration in water is affected by evaporation and precipitation.13, 14 The permissible limit of chloride concentration is 250 ppm. The amount of chloride in all water samples ranges from 90.0 ppm to 164.9 ppm and do not crosses the suggested limits.
Sulphates
Sulphates generally have less effect on taste than chlorides and carbonates. The recommended upper limit of sulphates ions for human consumption is 250 ppm.15 The highest concentration of sulphates is found to be 210 ppm at site S6. The concentration of sulphates ranges from 102.2 to 210 ppm. The values are in accordance with ISI limits.
Nitrates
The most important source of nitrate is biological oxidation of organic nitrogenous substances. The agricultural run off is also a source of nitrate. In present investigations the high values of nitrates 8.2 ppm are recorded at site S1 and minimum values 1.60 ppm were at site S8, which are within range.
Fluoride
Fluoride is beneficial up to certain extent, when present in concentration range of 0.8 – 1.0 ppm for calcification of dental enamel specifically for children below eight years16. High levels of fluoride can cause dental fluorosis (Fluoride > 1.5 ppm) and skeletal fluorosis (Fluoride > 3.0 ppm). In present investigation the fluoride concentration is found to be in desired limit.
References
- APHA/AWWA/WPCF, Standard methods for examination of water and waste water, 19th Edn. American Public Health Association, Washington DC, USA (1995).
- R. N. Trivedi and S. Kumar Singh, “Water Resources and Quality Management”, Common Wealth Publication, Delhi (India), 75-75.
- D. Kelvin, “River Pollution, Chemical Analysis”, Butterworths Sci. Pub. London UK (1959).
- U. N. Mahida, “Water Pollution and Disposal of Waste Water”, Tata McGraw Pub. Co. Ltd. India (1981).
- A. Shreenivasan, F.A.O. Fish. Rep., (1967) 44(3): 101.
- ISI Tolerance limit for Inland Surface Water Subject to Pollution, IS 2296, New Delhi (1974).
- L. S. Elango, Ramchandra and Y.S. R. Chawdary, “Ground Water Quality in Coastal Regions of South Madras”, Indian J.Environ. Hlth., (1992) 34, 318.
- S.R. Mishra and D.N. Saksena, Poll. Res. (1990) 8(2): 77.
- D.M. Martin, “Marine Chemistry”, Vol. 1, Marcel Dekker Inc., New York.
- V.S. Lomte and M.B. Deshmukh, Dr. Babasahed Ambedkar Marathwada University, J. Sci. XXVIII: (1998) 43.
- Vijendra Singh and C.P. Singh Chandel, “Assessing the Quality of Waste Water and for Farming Purpose in and around Various Industrial Areas of Jaipur City, Rajsthan”, Asian Journal of Chemistry, 2006 18 (4).
- K. Vijayaram, S.R. Vyasungi,Chitra and U. Asha, Poll. Res. (1990) 9: 133.
- T.R. Bhaskaran, Geo Miller and Co. Pvt. New Delhi.
- P.C. Mishra and M.C. Das, Poll. Res. (1989) 8(3).
- Sawyer N.C. and Mc. Larty, L. P. Chemistry for Environmental Engineers, Mc Graw Hill Book Company, New York.
- A. K. Tripathi and R.C. Singh, “Indian J. Environ. Prot.” (1996) 16: 748.


