Assessment of Industrial effluent and underground water during monsoon season 2007 in Sitapura Industrial area, Jaipur
Rajni Agrawal1 * , S.K. Sharma1 and U. Jha2
1
Department of Applied Chemistry,
Birla Institute of Technology,
Jaipur Campus,
Jaipur,
India
2
Department of Applied Chemistry,
Birla Institute of Technology,
MESRA,
Ranchi,
India
http://dx.doi.org/10.12944/CWE.4.1.10
Study of industrial effluents and underground water of Sitapura Industrial Area was carried out during monsoon season 2007. The main purpose of this study was to assess the quality of industrial effluents and its effects on the underground water. Waste water samples were collected from 4 textile, 4 pharmaceutical, 4 printing, 4 food products industries and 3 samples of mixed effluents. Underground water samples were collected at both sites of the nala and nearby different industries. These samples were analysed for the parameters of pH, Electrical Conductivity, Total dissolved solids, Total suspended solids, Total solids, Sodium, Potassium, Chloride, Nitrate, Hardness, Alkalinity, Sulphate, Phosphate, Fluoride, Dissolved Oxygen, Chemical Oxygen Demand. The pH value varied from 6.3 to 8.6 and EC value varied from 1.0 to 3.3 mmho/cm in the industrial effluent. The pH value varied from 7.16 to 9.52 and EC value varied from 1.08 to 3.3 mmhos/cm in the underground water samples. The COD value were found to be from 110 mg/L to 710 mg/L in the industrial effluents.
Copy the following to cite this article:
Agrawal R, Sharma S.K, Jha U. Assessment of Industrial effluent and underground water during monsoon season 2007 in Sitapura Industrial area, Jaipur. Curr World Environ 2009;4(1):71-77 DOI:http://dx.doi.org/10.12944/CWE.4.1.10
Copy the following to cite this URL:
Agrawal R, Sharma S.K, Jha U. Assessment of Industrial effluent and underground water during monsoon season 2007 in Sitapura Industrial area, Jaipur. Curr World Environ 2009;4(1):71-77. Available from: http://www.cwejournal.org/?p=893
Download article (pdf)
Citation Manager
Publish History
Introduction
The industrial effluents may contain one or more of the contaminants like high suspended solids, oil, high dissolved solids, high residual chlorine and pH value outside the permitted range.1 There are many human-originated impacts that degrade the water and decrease its quality, with direct and indirect effects on the water courses. The industries are a source of punctual pollution with considerable impacts on the hydric resources, due to diversity in the composition of the effluents.2
Waste from the industry, which is subjected to reaction with percolating rain water and reaches the ground water level. This percolating water picks up a large number of contaminants and reaches the aquifer system and hence degrades the ground water quality.3 Disposal of treated & untreated industrial effluents on land has become a regular practice for some industries. Industries located in Mettupalayam taluk, Tamilnadu dispose their effluents on land and the farmers of the adjacent farmlands have complained that their shallow open wells get polluted & also the salt content of soil has started building up slowly.4 The fluoride concentration in water of BALCO, Korba area (India) varied from 1.07 ppm to 3.10 ppm causing dental and skeletal fluorosis in that area.5 A study was carried out in Malawi to assess the extent of chemical pollution in area as affected by industrial effluents. Both the effluents and the water at selected parameter were analysed for pH1 dissolved oxygen, biochemical oxygen demand, electrical conductivity, suspended solids, nitrates, alkalinity, hardness, chloride and phosphate in the dry seasons. The results showed that the effluents were acidic in both the dry season (range: 4.2 ± 0.02 – 6.5 ± 0.02) and in the rainy season (range; 4.2 ± 0.05 – 5.6 ± 0.01).6 The ground water around the salt pans has been found with the high concentration of TDS, Chloride and Sodium.7
In view of above, the Physico-chemical study of industrial effluents and groundwater of Sitapura Industrial Area, Jaipur was carried out during monsoon season and the results are discussed here.
Material and Methods
The samples were collected at the discharge points of different industries while mixed effluent samples were taken from the points where this mixed effluent is discharged into the nearby drain (nala). The industrial effluents of 4 textile industries, 4 pharmaceuticals industries, 4 printing industries, 4 food products industries, 3 samples of mixed effluents and underground water samples were collected at both sites of the nala and nearby different industries. Samples were collected in sterilized bottles. These were systematically analysed. The analysis of these samples were carried out using standard methods.8,9
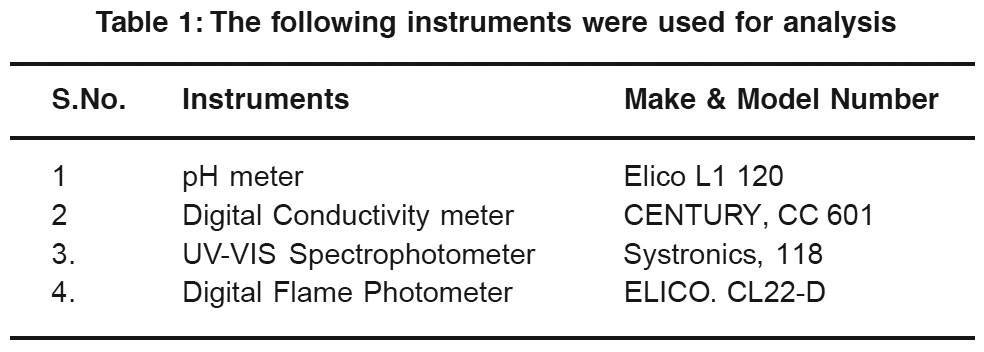 |
Table 1: The following instruments were used for analysis Click here to view table |
While chloride, alkalinity, hardness, dissolved oxygen and COD were determined by using titrimetric method, TDS and Suspended solids were determined by gravimetric method. Details of analysis are given in Table-2.
Results and Discussion
Industrial Effluents: Table-3 pH
A quick evaluation of acidic and alkaline nature of water can be done by the determination of pH which is an important parameter of wather.10 The pH value i.e. 6.3 – 8.6 were found to be under permitted limit of Industrial Effluent Standards.11
Electrical Conductivity
The value of electrical conductivity ranged from 1 to 3.3.
Total Dissolved Solids
TDS values varied from 680 to 2142 mg/ L. Which is under permitted limit as per Industrial Effluent Standards.11
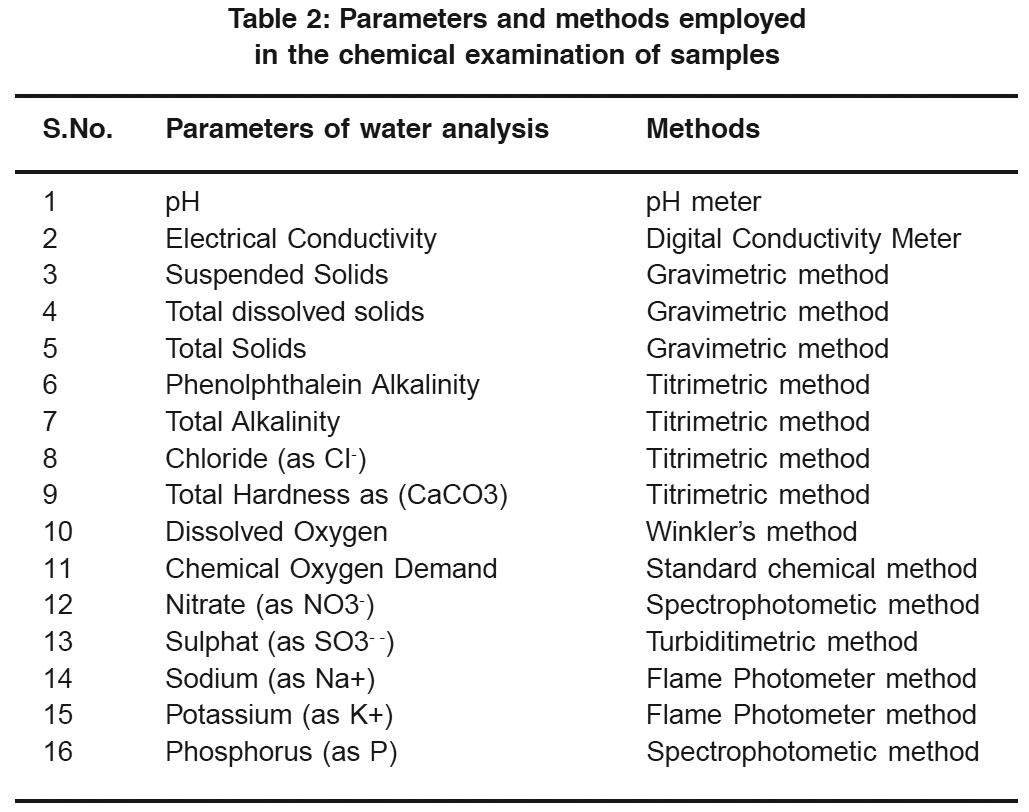 |
Table 2: Parameters and methods employed in the chemical examination of samples Click here to view table |
Total Suspended Solids
Total Suspended Solids were found in the range of 1.6 to 860.6 mg/L, 240 mg/L of textile industry, 860.6 mg/L of pharmaceuticals industry, 312, 408 and 810 mg/L of printing industries and 160.8, 178 and 230 of food products industries are at higher side as per Industrial Effluent Standards. It should be < 150 mg/L.
Chloride
Chloride value varied from 120.26 to 905.5 mg/L.
Total Alkalinity
Total alkalinity was noted from 200 to 1560 ppm. After data analysis, it is found that alkalinity of 1 pharmaceuticals effluent, 3 food products effluents and 1 mixed effluent are above 1000 ppm.
Sodium and Potassium
The value of sodium and potassium were in the range of 200-795 ppm and 4-55 ppm.
Nitrate
The nitrate values were found from 0.8 to 20 mg/L. The nitrate value are under permitted limit.
Sulphate
The sulphate value varied between 26 to 210 mg/L. The value of sulphate of some effluents like 1 textile, 2 printing and 4 food products are above 100 mg/L.
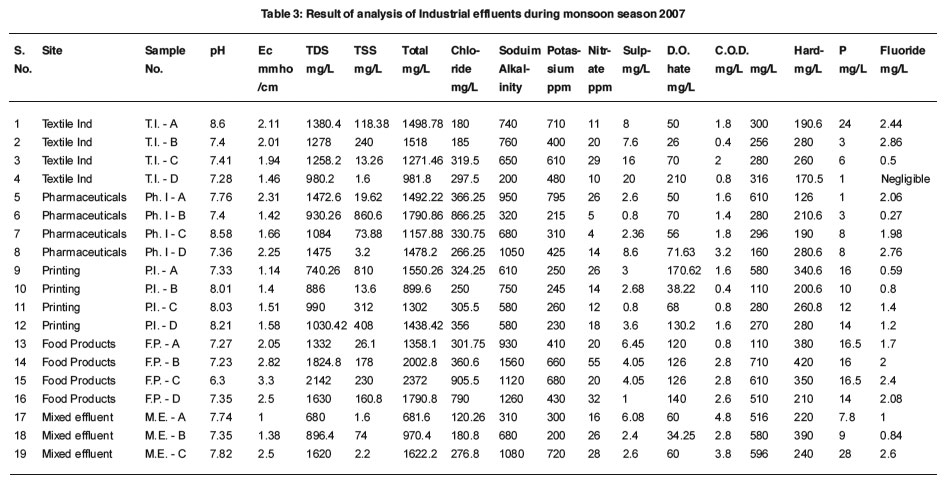 |
Table 3: Result of analysis of Industrial effluents during monsoon season 2007 Click here to view table |
Dissolved Oxygen
It’s value were noted from 0.4 - 4.8 mg/L. The dissolved oxygen in some effluents is absent as per result.
Chemical Oxygen Demand
Chemical Oxygen Demand values were found to be 110 to 710 mg/L. Some are in the higher range as per Industrial Effluent Standards.11 The value of COD should not exceed 400 mg/L.
Hardness
Hardness found to be from 126 to 420 mg/L.
Phosphorus
The value of phosphorus varied between 1 to 28 mg/L.
Fluoride
The value of fluoride was noted from negligible to 2.86 mg/L.
Under Ground Water: Table-4
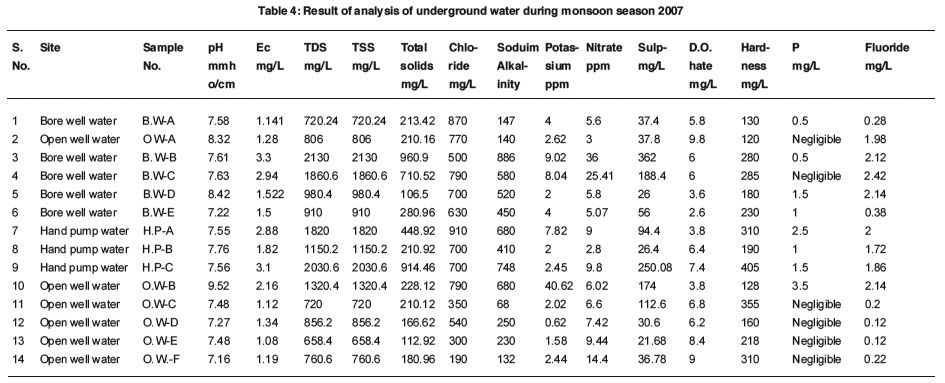 |
Table 4: Result of analysis of underground water during monsoon season 2007 Click here to view table |
pH
The pH values were found to be from 7.16 to 9.52. All the pH values are under permissible limit as per Indian Standard and WHO guideline except one i.e. 9.52.
Electrical Conductivity
The value of electrical conductivity ranged from 1.08 to 3.3 mmhos/cm. The variation in electrical conductivity could be explained to the natural concentration of ions present in water. The higher values of conductance (>1000µmhos/cm) may be due to the difference in geographical features.12
Total Dissolved Solids
TDS values varied from 658.4 to 2130 mg/ L. This is under permissible limit as per Indian Standard except two i.e. 2130 and 2030.6 mg/L. The samples have TDS above 500 mg/L but below the maximum permissible limit of 1500 mg/L which can be used for domestic purposes. But if utilized for cooking purposes, the water has a salty taste and produces scales on cooking vessels.10
Chloride
Chloride values varied from 106.5 to 960.9 mg/L. The Chloride of few samples are above the desirable limit but below the permissible limit as per Indian Standard. Chloride is one of the important parameters to know the quality of water. High chloride causes cardiovascular problems, gives a bitter taste to water, corrodes steel and affects the solidity and strength of concret.13
Total Alkalinity
Total alkalinity of few samples are above permissible limit.
Sodium and Potassium
The values of sodium and potassium wre in the range of 68-886 ppm and 0.62 -40.62 ppm. The value of sodium of mostly all samples above WHO guideline i.e. 200 mg/L except few samples.
Nitrate
The nitrate values were found from 2.8 to 36 mg/L. The nitrate values are under desirable limit as per Indian standard i.e. 45 mg/L.
Sulphate
The sulphate values varied between 21.68 to 362 mg/L. The value of sulphate of all samples under permissible limit as per Indian Standard and WHO i.e. M400 mg/L.
Dissolved Oxygen
It’s values were noted from 2.6 to 9.8 mg/ L. Do as a parameter is very useful for assessing the quality of water and providing a check on pollution.10
Hardness
Hardness found to be from 120 to 405 mg/ L. The hardness of water samples are under permissible limit as per IS and WHO guideline. Hardness may be due to the ground water receiving calcium and magnesium rich minerals leached from rocks and other deposits like limestone, gypsum and clay minerals. Sewage and domestic wastes are also important sources of total hardness in ground water.14
Phosphorus
The values of phosphorus varied between negligible to 3.5 mg/L.
Fluoride
The values of fluoride were noted from 0.12 to 2.42 mg/L. The value of fluoride of some water samples are above the permissible limit as per BIS & WHO guideline.
Conclusion
The industrial effluents data indicate, that the pH and TDS are under permitted limit but TSS and COD of few effluent samples are at higher side in the industrial effluents. Effluents should not be discharged into nearby water bodies or in soil without treatment. The results of underground water indicate, that the value of some parameters of few samples are at higher side, which may be due to seepage of effluent. So the underground water of SIA should be used for drinking purpose after treatment.
Acknowledgements
We are highly grateful to Dr. H.C. Pande, Vice Chancellor Emeritus, BIT and Director BIT Extension Centre, Jaipur for continued encouragement, helpful suggestions and providing necessary facilities.
References
- Shandilya P., Phogat S.S., Mahal G.S., Balagi S., Bhartiay S., BHEL Journal, (2006) 27(2): 45-45.
- Abrahao. R., C. Monica, Lucia C., Gadelha M., International Conference on Energy, Environment and Disasters-INCEED., Charlotte, N.C., USA-July (2005) 24-30.
- Tyadi P., Buddi D., Choudhary R., Sawhney R.L., A Review, Pollution Research, (2000) 19(3): 443-445.
- Mukhergee, S. and Nelliyat P., This paper has been presented at the IWMI-TATA water policy program’s 5th Annual Partners Research Meet, held during March 8-10, at the Institute of Rural Management Anand (IRMA), Gujarat & also awarded as the best “Yong Scientist Award for the year 2006”.
- Sahu A. and Vaishnav M.M., Journal of Environmental Science and Engineering (2006) 48(1): 65-68.
- Phiri O., Munba P., Moya B.H.Z. & Kadewa W., International Journal of Environment Science & Technology (ISSN: p-ISSN: 1-Nub3).
- Tripathi J.K. & Panig Ray R.C., Pollution Research, (1998) 17(2): 157-161.
- ‘APHA, Standard Methods for the Examination of Water and Waste Water’ American Public Health Association,Washington D.C. 20th ed New York (1998).
- HLS Tondon, Method of Analysis of soils, plants, waters and fertilizers. Fertilizers Development and Consultation Organisation, New Delhi, India, 144+vi (1995).
- Anandhaparameswari N., Hemalatha, S., Vidhyalakshmi G.S. and Shakunthala K., Nature Environment and Pollution Technology, (2007) 6(2): 333-334.
- http://f2check.rediff.com//bn/donwload.cgi/ PCD_Water_Quality_Standards..../htm.
- Kataria, H.C. and Jain O.P., Indian Journal of Environmental Protection, (1995) 5: 569-571.
- Guru Prasad, B. Nature Environment and Pollution Technology, (2003) 2(2): 173-178.
- Mishra S.R. and Saxena D.N., Pollution Research (1989) 8(2): 77-86.


