Spatiotemporal Assessment of Water Quality in the Yamuna River and Its Tributaries in Haryana
Prashant Ravish
*

1
Institute of Environmental Studies,
Kurukshetra University,
Kurukshetra,
Haryana
India
http://dx.doi.org/10.12944/CWE.20.3.18
Copy the following to cite this article:
Ravish P, Spatiotemporal Assessment of Water Quality in the Yamuna River and Its Tributaries in Haryana. Curr World Environ 2025;20(3). DOI:http://dx.doi.org/10.12944/CWE.20.3.18
Copy the following to cite this URL:
Ravish P, Spatiotemporal Assessment of Water Quality in the Yamuna River and Its Tributaries in Haryana. Curr World Environ 2025;20(3).
Download article (pdf)
Citation Manager
Publish History

Introduction
Water is indispensable for sustaining life and maintaining ecological balance. It supports not only biological and environmental systems but also the social and economic development of nations.1 However, the quality and availability of freshwater resources have come under increasing threat due to unchecked exploitation, pollution, and ecological degradation.2–4 Rivers, in particular, are among the most vulnerable water bodies as rivers receive pollution loads from both point and non-point sources—ranging from industrial effluents and domestic sewage to agricultural runoff and urban stormwater.5 In rapidly urbanizing regions, improper discharge of untreated sewage into stormwater drains has become a major contributor to river pollution, especially during dry weather when natural flow is minimal.6,7 Even in areas where sewerage infrastructure exists, issues such as leakage, illegal connections, and underperforming sewage treatment plants persist.8
India faces a serious water pollution crisis, with over 350 river stretches identified as critically polluted.9 Among them, the Yamuna River stands out not only for its religious and cultural significance but also for its alarming levels of contamination. While the river originates with relatively clean waters from the Yamunotri glacier, it deteriorates sharply as it passes through densely populated and industrial regions. Notably, the 22 km stretch between Wazirabad and Okhla in Delhi—just 2% of the river's total length—carries over 70% of its pollution load.10,11 Numerous studies have investigated water quality in this segment, identifying major pollution sources such as untreated sewage from unauthorized colonies, punctured sewer lines, and industrial discharges.12–14
Despite extensive research on the Delhi stretch of the Yamuna,12–16 the upstream regions—particularly within the state of Haryana—have received comparatively less attention. This represents a significant research gap, as tributaries and drains in Haryana such as Maskara Nallah, Dhanaura Escape, and Drain No. 2 contribute substantially to the downstream pollution load. Studies have noted that relying solely on data from major outfalls or downstream locations offers limited scope for tracing pollution back to its sources.10,17 Furthermore, while water quality assessments in Delhi have primarily focused on end-point pollution, there is a lack of spatiotemporal analysis across the upstream tributary network that would allow for precise hotspot identification and targeted mitigation. The need to identify pollution at the source has been emphasized in multiple studies, especially in the context of stormwater drains and drainage basins.1,18 Without such insights, environmental agencies struggle to enforce effective pollution control strategies. Moreover, despite the launch of initiatives like the Yamuna Action Plan, the pollution load in certain segments has increased rather than decreased, highlighting inefficiencies in current approaches.19 Despite extensive research on the Delhi stretch of the Yamuna, upstream regions, particularly within the state of Haryana, have received comparatively less attention. This represents a significant research gap, as tributaries and drains in Haryana, such as Maskara Nallah, Dhanaura Escape, and Drain No. 2, contribute substantially to the downstream pollution load. Studies have noted that relying solely on data from major outfalls or downstream locations offers limited scope for tracing pollution back to its sources. This study offers the first comprehensive, multi-year spatiotemporal assessment of water quality in the Haryana segment of the Yamuna River, providing crucial insights into pollution dynamics before the river reaches Delhi. By focusing on lesser-studied segments of the Yamuna basin in Haryana and employing a spatiotemporal framework, this study aims to fill this critical gap in current environmental research.
In this context, the present study undertakes a multi-year (2021–2023), multi-location spatiotemporal assessment of water quality in the Yamuna River and its key tributaries in Haryana. The research covers 14 critical sampling points, encompassing upstream, downstream, and drain confluence zones. A comprehensive suite of physicochemical and microbiological parameters is analyzed to track trends, assess compliance with environmental standards, and identify seasonal variations. Beyond assessment, the study also explores the potential of phytoremediation—using Canna indica—as a cost-effective, eco-friendly solution to mitigate pollution. Phytoremediation has emerged as a promising technique in global research due to its ability to reduce contaminants through natural plant-based mechanisms,20,21 offering lower energy costs and long-term sustainability. By focusing on lesser-studied segments of the Yamuna basin in Haryana and employing a spatiotemporal framework, this study aims to fill a critical gap in current environmental research. It supports the broader goal of developing evidence-based policies and localized interventions to restore riverine ecosystem health and secure water quality for future generations. The Yamuna River has received considerable attention due to its declining water quality, particularly in the Delhi stretch. However, upstream segments such as those in Haryana remain underexplored despite their critical contribution to downstream pollution loads. Existing literature predominantly addresses highly urbanized river reaches, creating a research gap in understanding water quality dynamics upstream of megacities. This study seeks to bridge this gap by investigating seasonal water quality trends over a five-year period across 14 strategically selected stations in Haryana, including both the mainstem Yamuna and key tributaries. The objectives of this study are to: (i) assess spatial variability in key water quality parameters; (ii) identify pollution hotspots; (iii) analyze correlations and principal drivers of water quality trends; and (iv) generate actionable insights for regional water governance. A conceptual framework guiding data collection, analysis, and interpretation is provided to improve methodological transparency and scientific rigor.
Materials and Methods
Study Area
This study focuses on the Haryana stretch of the Yamuna River, specifically the segment from Tajewala Barrage (Hathnikund) to the Delhi border at Palla Village, spanning approximately 224 kilometers. The Yamuna River, a major tributary of the Ganges, originates from the Yamunotri Glacier at an altitude of 6387 meters in Uttarkashi, Uttarakhand. It flows through several ecological zones before entering Haryana, where it is diverted into Western and Eastern Yamuna Canals for irrigation at Hathnikund. During dry seasons, this regulation significantly reduces surface flow downstream, with only an environmental release of 160 cusecs allowed, often resulting in a near-dry channel until it enters Delhi. The river segment under study is critical due to its vulnerability to agricultural runoff, municipal effluents, and industrial discharge. It receives inputs from various drains and seasonal streams like Som Nadi and Diversion Drain No. 8, which influence water quality conditions significantly.
Sampling was carried out at 14 strategically selected stations along the Haryana stretch of the Yamuna River, covering both the main river and its tributaries. This spatiotemporal assessment spans from 2019 to 2023, capturing seasonal variations in water quality. The novelty of this study lies in its comprehensive multi-year approach, which represents the first long-term spatiotemporal analysis of upstream Yamuna water quality in Haryana. The data collected includes a broad range of physicochemical and microbial parameters, ensuring a robust dataset to track both seasonal changes and long-term pollution trends. Multivariate statistical methods, including ANOVA, Pearson correlation, and principal component analysis (PCA), were utilized to identify key pollution drivers and analyze seasonal variability. This unique multi-year dataset, along with the combination of statistical techniques, offers deeper insights into upstream pollution patterns, bridging a critical gap in existing literature, which has primarily focused on short-term or downstream assessments.
Sampling Sites
Water quality data were collected from 14 distinct sampling points across the Yamuna River and its tributaries or drains within Haryana. These sites were selected to capture spatial variation in pollution sources and hydrological transitions. The monitored sites are listed below with their identifiers:
YMN-RDQ-001 – Yamuna River before meeting Maskara Nallah, upstream, Kalanaur
YMN-RDQ-002 – Maskara Nallah before confluence with Yamuna, Kalanaur (Ghorpipli)
YMN-RDQ-003 – Yamuna River after confluence with Maskara Nallah, downstream, Kalanaur
KRN-RDQ-001 – Yamuna River before meeting Dhanaura Escape, Karnal
KRN-RDQ-002 – Dhanaura Escape before confluence with Yamuna, Village Jarauli, Karnal
KRN-RDQ-003 – Yamuna River after meeting Dhanaura Escape, downstream, Karnal
PNP-RDQ-007 – Yamuna River before receiving Drain No. 2, Sanjoli
PNP-RDQ-008 – Drain No. 2 before meeting Yamuna, Khojkipur
PNP-RDQ-009 – Yamuna River after confluence with Drain No. 2, Khojkipur
PWL-RDQ-004 – Yamuna River downstream before Gaunchi Drain
PWL-RDQ-005 – Gaunchi Drain before merging into Yamuna, Palwal
PWL-RDQ-006 – Yamuna River downstream after Gaunchi Drain
SNP-RDQ-004 – Yamuna River after meeting Diversion Drain No. 8, Palla
FBD-RDQ-002 – Alipur Drain, Basantpur
This distributed network of stations enables evaluation of cumulative and localized pollution inputs, as well as natural attenuation or dilution effects.
Sampling Schedule and Collection Procedure
Sampling was carried out across a multi-year timeframe (2021–2023) during three key hydrological seasons—pre-monsoon, monsoon, post-monsoon and winter season . Samples were collected using grab sampling techniques in pre-cleaned HDPE containers, immediately chilled, and transported under controlled conditions to the laboratory for analysis. Site-specific environmental observations, such as flow conditions and point source proximity, were also recorded.
Parameters Analyzed and Analytical Methods
A total of 17 parameters were assessed, including pH, temperature, DO, BODs, COD, TDS, EC, nitrate, total coliforms, fecal coliforms, and heavy metals like lead, chromium, zinc, and fecal streptococci . Analytical methods followed APHA (2017) and IS: 3025 (1964) standards. Heavy metals were analyzed via Atomic Absorption Spectroscopy (AAS), microbiological parameters using membrane filtration, and chemical parameters through titration and spectrophotometry. Parameters such as DO, BOD, COD, turbidity, and fecal coliform were measured using calibrated instruments including Hach HQ40d DO meters and Systronics UV-Vis spectrophotometers. Detection limits, calibration frequencies, and instrument precision were recorded. Sample handling protocols, including preservation with reagents (e.g., Winkler's method for DO), were rigorously applied.
Statistical Analysis
Data were processed using SPSS 26.0, employing descriptive statistics, ANOVA, and correlation analysis to identify trends, outliers, and inter-parameter relationships. Statistical validation ensured reliability in detecting seasonal effects and pollution source linkages.
Quality Assurance and Control
All procedures followed standard QA/QC protocols. Field instruments were regularly calibrated, and laboratory analyses incorporated blanks, duplicates, and certified reference materials. QA/QC protocols included triplicate field samples, equipment calibration before each sampling trip, and use of blanks and standards. Outlier detection was performed using Grubbs’ test and cross-verified through replicate analyses. Data completeness and representativeness were confirmed prior to statistical analysis.
Results
These results highlight the critical pollution hotspots in the Haryana stretch, and the findings extend existing literature by demonstrating that significant ecological degradation occurs upstream, well before the river reaches Delhi. While many studies have focused on short-term or endpoint assessments, this study provides a unique, longitudinal perspective that underscores the importance of addressing upstream pollution sources. Over the five-year monitoring period from 2019 to 2023, a total of 639 water samples were collected across 14 strategically selected monitoring stations situated along the Yamuna River and its tributaries within the Haryana region. This comprehensive sampling effort ensured robust spatial and temporal coverage, capturing seasonal variations and pollution trends across pre-monsoon, monsoon, post-monsoon, and winter periods. The sample count reflects a consistent commitment to data reliability, with each station typically monitored multiple times per year. This extensive dataset not only strengthens the statistical validity of the study but also enhances its suitability for evaluating long-term pollution patterns and supporting region-specific water quality management strategies.
Spatiotemporal Trends in Key Water Quality Parameters across different segments.
Variations in Dissolved Oxygen (DO) content
Dissolved Oxygen (DO) is a critical indicator of riverine health, directly affecting the survival and distribution of aquatic organisms. It also reflects the balance between oxygen-producing and oxygen-consuming processes in water bodies. In this study, both DO minimum and maximum values were analyzed across all 14 sampling sites in the Yamuna River and its tributaries in Haryana over a five-year period (2019–2023), offering insights into oxygen availability and ecosystem stress. The DO concentrations showed substantial inter-annual variation across sampling stations. For instance: At Yamuna at Kalanaur (upstream), DO min values remained above 8 mg/L consistently, suggesting relatively clean upstream conditions. In contrast, downstream sites such as Khojkipur (after confluence with Drain No. 2) and Palwal (after Gaunchi Drain) experienced low DO levels in certain years, with values dipping below 4 mg/L—indicating hypoxic conditions. A sharp decline in DO was noted in 2021 at multiple stations, potentially reflecting reduced flow and increased organic loading post-COVID lockdown periods. In 2022, slight recovery in DO values was observed at most locations, likely aided by higher monsoon recharge, but this improvement was not uniform across all sites. The percentage difference in DO min values between the highest and lowest years was striking in several locations: At Khojkipur, DO min dropped from 8.5 mg/L in 2019 to 3.4 mg/L in 2021, marking a 60% decline. Alipur Drain (FBD-RDQ-002) recorded a >70% fluctuation in DO levels across years. Karnal downstream of Dhanaura Escape showed a moderate 25–30% change, highlighting consistent though elevated organic input from the drain. Stations with relatively stable DO trends included Kalanaur upstream and Sanoli (PNP-RDQ-007), which maintained DO levels above 7 mg/L across all years. Spatially, a clear gradient in DO depletion was evident: Upstream segments (e.g., Kalanaur, Karnal before drains) consistently exhibited higher DO values, benefiting from better flow conditions and minimal upstream pollution. Downstream confluence zones, especially after receiving urban and agricultural drains, showed reduced oxygenation, pointing to the cumulative impact of organic waste. Himachal Pradesh and northern Haryana locations retained DO levels close to pristine river standards. Sites closer to Delhi, particularly near Palla (SNP-RDQ-004), had critically low DO values in dry seasons, reflecting a buildup of pollution and reduced dilution potential. These patterns emphasize the spatially heterogeneous nature of DO distribution, shaped by both point-source discharges and regional flow regimes.
Variations in Biochemical Oxygen Demand (BOD)
Biochemical Oxygen Demand (BOD) is a key indicator of organic pollution in surface waters. It reflects the amount of oxygen required by microorganisms to decompose organic matter present in the water. High BOD levels suggest the presence of significant pollution, particularly from domestic sewage, agricultural runoff, and industrial effluents. According to CPCB standards, BOD levels should not exceed 3 mg/L in water bodies designated for bathing and primary contact use. In this study, BOD levels exhibited substantial variation across years and locations. In 2019, most sampling points in the upstream reaches, such as Kalanaur and Karnal before drain confluences, showed BOD levels within or slightly above permissible limits. However, a clear worsening trend was observed in the following years. By 2021, several stations recorded elevated BOD values, especially in downstream zones receiving drain discharge. For example, BOD levels in the Delhi segment increased from 38 mg/L in 2021 to 60 mg/L in 2022, highlighting an alarming increase in organic pollution. Similar spikes were recorded at other critical stations such as Mazawali in Haryana and the drain confluence zones at Khojkipur and Palwal. The percentage change in BOD across the study period was particularly notable at stations exposed to urban and industrial drains. The Delhi segment experienced a 57.9% rise in BOD over two years, reflecting the deteriorating water quality in this part of the river. On the other hand, stations like Karnal and the Uttar Pradesh reach showed comparatively stable BOD values below 2 mg/L, likely due to better flow conditions and limited direct sewage input. Spatial patterns revealed that upstream stations consistently performed better in terms of BOD levels. Sites located before major drain inflows often maintained concentrations close to acceptable standards. However, a significant deterioration in water quality was observed immediately downstream of drains such as Dhanaura Escape, Drain No. 2, and Gaunchi Drain. These areas consistently recorded BOD values far above the regulatory limit, especially during low-flow seasons. In terms of state-wise comparison, stations located in Himachal Pradesh and upper Haryana showed lower BOD levels, while Haryana’s downstream sites near the Delhi border, and the Delhi segment itself, experienced the most severe degradation. Overall, the analysis underscores the role of untreated or partially treated wastewater from drains and urban runoff in elevating BOD levels, particularly in the lower Yamuna stretch. These results reinforce the urgent need for targeted interventions at pollution hotspots, especially near drain confluences and urban settlements.
Variations in pH
The pH of a water body is a fundamental indicator of its chemical balance and can influence the solubility and toxicity of various contaminants. According to the CPCB, the desirable pH range for surface water is between 6.5 and 8.5. Deviations outside this range may impair biological functions and chemical stability within aquatic systems. Across the study period (2019–2023), pH values at most stations remained within the acceptable limits, indicating a generally neutral to slightly alkaline nature of the Yamuna River and its tributaries in Haryana. The lowest pH recorded was 6.43 at a Delhi segment in 2022, while the highest observed was 7.9, noted in the Uttar Pradesh stretch in 2021. Most of the stations—including those in Kalanaur, Karnal, and Sanoli—had annual minimum pH values consistently ranging between 7.0 and 7.5, suggesting stable conditions in terms of acidity and alkalinity. Temporal variations in pH were relatively minor when compared to other parameters like BOD or DO. However, a few localized shifts were detected. For example, the pH at the Delhi segment dropped from 7.4 in 2021 to 6.43 in 2022, marking a 15% change, which is notable for a typically stable parameter. This reduction may be attributed to increased organic and industrial discharge, as well as possible acid-forming effluents entering the river during low-flow periods. Spatially, upstream and less impacted stations exhibited little deviation in pH across the years. Sites located near drain inflows, however, displayed slightly greater fluctuations, possibly due to the mixing of untreated sewage and varying chemical compositions of industrial wastewater. Despite this, no site consistently breached the CPCB thresholds, which suggests that pH may be less directly impacted by the pollution loads affecting other indicators like BOD and faecal coliforms. In summary, while the pH of the Yamuna River in Haryana has largely remained within acceptable ecological limits, occasional dips near polluted stretches highlight the need to monitor this parameter continuously, especially in zones affected by urban runoff and industrial activity.
Variations in Nitrate concentration
Nitrate (NO3-) in surface water is primarily introduced through agricultural runoff, sewage discharge, and leachate from landfills or industrial activities. Elevated nitrate levels are of concern not only for aquatic life but also for human health, especially in the context of groundwater-surface water interactions. According to BIS and WHO guidelines, nitrate levels should not exceed 45 mg/L in drinking water; however, for surface waters, values are typically expected to remain well below this threshold. In the present study, nitrate levels were relatively low across most stations and years, with average minimum values typically ranging between 0.3 and 0.42 mg/L. Such low concentrations suggest that nitrate pollution is not a dominant issue along the monitored segments of the Yamuna River in Haryana. The highest nitrate value observed was 0.42 mg/L in the Uttar Pradesh stretch in 2021, while values at locations like Delhi and Karnal consistently hovered around 0.30 mg/L. Temporal variation in nitrate concentrations was minimal. At most stations, there was no significant fluctuation between years, and the calculated percentage change was effectively zero. This stability may be due to either limited agricultural runoff reaching the main river channel or the influence of consistent dilution patterns during sampling seasons. However, it is important to interpret these results with caution due to the high proportion of missing data for nitrate. Over 50% of records lacked nitrate measurements, particularly for early years like 2019 and certain drain-connected stations. This data gap limits the reliability of broader conclusions and underscores the need for more consistent sampling and analysis in future monitoring efforts. Despite these limitations, the currently available data indicates that nitrate levels remain within safe ecological bounds in the Yamuna River stretch through Haryana. Nevertheless, given the increasing use of fertilizers and expanding peri-urban agriculture along the floodplain, continued nitrate surveillance is warranted to preempt future eutrophication risks.
Variations in Faecal Coliform
Faecal coliform (FC) bacteria are indicators of microbial contamination originating from human and animal waste. Their presence in river water reflects the degree of feacal pollution, posing serious public health risks when concentrations exceed safe limits. According to CPCB standards, faecal coliform levels in Class B water should not exceed 500 MPN/100 mL. The analysis of faecal coliform data from 2019 to 2023 reveals severe contamination across multiple sampling locations. Notably, the Delhi segment of the Yamuna exhibited extremely high FC counts, with average minimum values of 70,000 MPN/100 mL in 2021 and a staggering 600,000 MPN/100 mL in 2022. These levels exceed permissible limits by over 1000 times, reflecting unchecked sewage discharge and inadequate treatment infrastructure. In comparison, upstream locations such as Karnal [Haryana] and U.P. entry points recorded much lower FC concentrations, typically below 50 MPN/100 mL, well within safe limits. The Mazawali station in Haryana, for example, reported an average of 33 MPN/100 mL in 2021. These results highlight the stark contrast between relatively clean upstream reaches and heavily polluted downstream zones, particularly near urban confluences. The temporal variation was especially pronounced in the Delhi segment, where FC levels increased by over 750% between 2021 and 2022. Such drastic surges are likely linked to high urban population density, poorly managed sanitation, and stormwater inflows during the monsoon that wash accumulated waste into the river. Other stations showed minimal year-to-year change, either because contamination remained consistently low or data was unavailable for multiple years. Spatially, the worst-affected sites were those located downstream of major drains and urban settlements. These include areas downstream of Gaunchi Drain, Drain No. 2, and the Diversion Drain at Palla, all of which receive substantial quantities of untreated or partially treated wastewater. Conversely, sites farther upstream or in less urbanized regions exhibited much lower FC levels. Despite these insights, interpretation is limited by data gaps in several years. Missing or unrecorded values—particularly in 2019 and for stations like Kalanaur and Palwal—complicate a more continuous understanding of microbial trends. Nonetheless, the existing data is sufficient to conclude that faecal coliform pollution poses a critical and persistent problem, especially in the lower stretches of the Yamuna River as it approaches Delhi.
Variations in Total Coliform
Total coliform bacteria serve as general indicators of microbial contamination in surface water and help assess the sanitary quality of water bodies. While not all coliforms are harmful, their presence signals potential contamination by pathogens associated with untreated sewage and animal waste. According to CPCB guidelines, total coliform counts in Class B waters should not exceed 500 MPN/100 mL. The analysis of total coliform (TC) data across sampling sites and years indicates highly variable but often excessive contamination levels, particularly in the more urbanized segments of the Yamuna River. In 2021, the Delhi segment recorded an average minimum TC value of 3.3 million MPN/100 mL, vastly surpassing acceptable limits. Similarly, the CANAL segment in Delhi reported 940,000 MPN/100 mL, underscoring chronic contamination issues. These results mirror the trends observed for faecal coliforms, further confirming the widespread microbial pollution in the lower stretches of the river. In contrast, upstream and less-impacted sites such as Karnal [Haryana] and Mazawali [Haryana] had much lower total coliform levels, with recorded values of 46 and 79 MPN/100 mL respectively—both comfortably within safe limits. The same values were also reported in the Uttar Pradesh stretch, indicating relatively better microbial water quality at these locations. Interestingly, despite the large differences in contamination levels across space, the available data did not show notable inter-annual variation at most stations. The percentage change between the highest and lowest TC values remained zero for all sites with available multi-year data. This static trend is likely due to data limitations, as many stations had measurements for only a single year. The bulk of total coliform data was concentrated in 2021, with few entries for other years. The spatial distribution of total coliforms closely followed patterns seen in faecal coliform analysis: relatively clean upstream segments and dramatically polluted downstream reaches near major drains and urban zones. These findings highlight the urgent need for enhanced sewage treatment and stricter pollution control in the Delhi-Haryana transition zone of the Yamuna. As with other microbiological parameters, the interpretation is constrained by data sparsity. A significant proportion of total coliform records were missing, particularly for the years 2019, 2020, and 2023. This further emphasizes the necessity for consistent and complete monitoring to support reliable assessments and policy decisions.
Variations in Temperature and Conductivity
Water temperature and electrical conductivity are key physical parameters that provide insights into the environmental conditions and dissolved ion content in river water. Temperature influences biological activity, solubility of gases, and the rate of chemical reactions, while conductivity reflects the total concentration of dissolved salts and is often associated with pollution from sewage and industrial effluents. In the present study, temperature readings across stations remained relatively stable over the 2019–2023 period. The minimum recorded temperatures ranged between 16°C and 26°C. Mazawali [Haryana] registered the highest average minimum temperature at 26°C, while the Delhi Canal segment recorded the lowest at 16°C. Other stations such as Karnal [Haryana] and U.P. segments maintained average temperatures in the range of 21°C to 25°C, typical of the pre-monsoon season when most samples were collected. No significant temporal change was observed, with all stations showing no variation in minimum temperature between years. Conductivity, which indicates the ionic strength and mineral content of water, varied significantly across space but showed no temporal variation due to sparse data. Among the stations with available data, Delhi recorded the highest conductivity at 1225 µmho/cm, followed by Delhi Canal segment with 1001 µmho/cm. These values suggest high levels of dissolved inorganic pollutants, likely contributed by urban runoff and untreated wastewater inflows. In contrast, upstream sites such as Karnal [Haryana] and U.P. entry points exhibited much lower conductivity, with values of 230 µmho/cm and 597 µmho/cm respectively. Mazawali [Haryana] showed a moderate value of 750 µmho/cm. Although year-to-year variation in conductivity could not be analysed due to limited data availability, the spatial distribution alone reflects the increasing pollution load as the Yamuna flows downstream through more densely populated and industrialized regions. These findings align with trends observed in BOD and microbial parameters. Overall, both temperature and conductivity support the broader interpretation of water quality conditions across the Yamuna basin. While neither parameter exceeded critical ecological thresholds, their spatial differences—especially in conductivity—highlight the importance of maintaining longitudinal monitoring to detect early signs of pollution escalation.
Variations in Faecal Streptococci value
Faecal streptococci are a subgroup of fecal indicator bacteria used to detect pollution from human and animal waste, often in combination with faecal coliform counts. Their persistence in aquatic environments provides important complementary information on microbial contamination, especially in cases where multiple pollution sources are suspected. In the current study, data on faecal streptococci was extremely limited. More than 68% of the records were missing across the dataset, with most values available only for the year 2021. Despite this constraint, the limited data paints a concerning picture of microbial pollution in certain stretches of the Yamuna River. In 2021, extremely high faecal streptococci levels were observed in the Delhi segment, with an average minimum value of 330,000 MPN/100 mL, well beyond any acceptable threshold for water quality. Similarly, the Delhi Canal segment recorded 4,600 MPN/100 mL, while upstream sites such as Karnal [Haryana] and U.P. segments had significantly lower values of 13 MPN/100 mL and 17 MPN/100 mL, respectively. Mazawali [Haryana] reported a moderate level of 78 MPN/100 mL, which, while elevated, remained within a tolerable range for recreational or agricultural use. Temporal analysis could not be performed due to the lack of multi-year data at most locations. The percentage difference across years was zero for all stations with data, but this is only a reflection of single-year measurements rather than stability in water quality. The sparse nature of this data set severely limits its interpretative value for long-term trend analysis. Nevertheless, the available measurements corroborate findings from faecal coliform and total coliform analyses—showing severe microbial contamination in urbanized downstream areas and relatively clean conditions upstream. These results reinforce the critical need for improved sanitation infrastructure, especially in and around Delhi. Given the potential public health risks associated with faecal streptococci exposure and their usefulness as a secondary indicator of pollution, future monitoring efforts should prioritize more systematic and frequent testing of this parameter. A more complete dataset would strengthen microbial source tracking and help differentiate between human and non-human pollution inputs.
Variation in pollution across different location and identification of pollution hotspots
The pH of river water remained within the permissible BIS range (6.5 to 8.5) across all stations. Seasonal means ranged from 7.4 to 7.8. Upstream locations (e.g., L1) showed relatively stable and neutral pH values (7.54 ± 0.29 in monsoon, 7.76 ± 0.24 in pre-monsoon), while downstream sites such as L10 maintained slightly acidic to neutral conditions. Year-over-year trend analysis revealed mixed shifts: L1 experienced a decrease during the monsoon (-4.15%), while L10 showed an increase (+4.27%), reflecting potential anthropogenic influences. DO levels varied significantly across stations. As per CPCB guidelines (Class B: DO > 5 mg/L), upstream station L1 consistently maintained healthy oxygen levels with a mean of 6.83 ± 0.82 mg/L. In contrast, critical oxygen stress was evident at L12 (mean: 4.82 ± 0.93 mg/L), falling below the acceptable limit. L10 and L11 also showed borderline oxygen deficiency (5.55 ± 0.84 mg/L and 5.66 ± 0.89 mg/L, respectively). The maximum DO variability was observed at L13 (SD: 1.37 mg/L), indicating fluctuating pollution load or hydrological disturbances. The spatial DO gradient revealed a 29.4% drop from L1 to L12. BOD levels across multiple downstream stations significantly exceeded the CPCB threshold of 3 mg/L. L12 emerged as the most polluted station, with a mean BOD of 29.14 ± 7.23 mg/L. L10 and L11 followed closely, registering means of 25.06 ± 7.40 mg/L and 22.05 ± 7.29 mg/L, respectively. These values are indicative of high organic loading from sewage, industrial effluents, and agricultural runoff. L1, by contrast, showed a much lower BOD mean of 5.77 ± 5.27 mg/L. The difference between the best (L1) and worst (L12) stations was approximately 405%, underscoring the severity of downstream pollution. High seasonal standard deviations at L10 and L1 also suggest episodic pollution events.
COD analysis further confirmed heavy organic pollution downstream. L10 exhibited extremely high seasonal COD values (Monsoon: 110.4 ± 27.34 mg/L), which is symptomatic of industrial and untreated domestic waste inflows. COD values at L12 and L11 also exceeded safe thresholds (>70 mg/L in multiple seasons). Conversely, upstream stations like L1 displayed lower COD levels, averaging around 19.67 ± 11.63 mg/L in the pre-monsoon season. Temporal trends indicated increasing COD across midstream stations over the five-year period, reinforcing the spatial pollution gradient.
Microbial contamination posed a severe threat to water safety, particularly during the monsoon and pre-monsoon seasons. L10 recorded the highest faecal coliform concentrations, averaging 11,530 ± 10,226.99 CFU/100 mL during monsoon. Total coliform counts at this station reached 58,400 ± 35,803 CFU/100 mL, well beyond the CPCB limit of 500 CFU/100 mL for faecal coliforms. Similar spikes were observed at L12 and L14. Upstream locations like L1 showed lower, though still non-compliant, levels. These elevated microbial levels indicate direct sewage discharge, poor sanitation, and lack of wastewater treatment infrastructure in downstream areas. Conductivity, a proxy for ionic and salinity load, increased substantially along the river’s course. The highest seasonal conductivity was recorded at L10 (Monsoon: 1922.0 ± 847.2 µS/cm), whereas L1 registered relatively low values (Pre-monsoon: 408.33 ± 224.04 µS/cm). This rising trend reflects cumulative impacts of agricultural runoff, domestic discharge, and industrial effluents. High standard deviations at downstream sites signal fluctuating contaminant loads across seasons. Water quality deteriorates progressively from upstream (L1–L4) to downstream (L10–L14) stations. BOD, COD, and coliforms showed seasonal peaks during the monsoon and post-monsoon, with year-over-year increases at midstream locations. Most stations failed to meet CPCB Class B criteria for DO, BOD, and coliforms, especially L10–L12. These results underscore the urgent need for pollution source control, improved sewage treatment, and ecological restoration in the Yamuna basin region of Haryana. Based on the multi-year, multi-parameter analysis of water quality data from 2019 to 2023, several pollution hotspots have been clearly identified along the Yamuna River and its tributaries in Haryana. These hotspots are primarily concentrated downstream of major drain confluences, where untreated or partially treated wastewater from urban, industrial, and peri-urban sources enters the river system. One of the most consistently polluted zones is located near Khojkipur, where the Drain No. 2 merges with the Yamuna. This site recorded elevated Biochemical Oxygen Demand (BOD) levels—often above 15 mg/L—alongside faecal coliform counts that exceeded 1,000,000 MPN/100 mL in certain years. These values are more than 300 times higher than the CPCB limit for Class B water, indicating intense microbial and organic pollution.
Another major hotspot was observed downstream of the Gaunchi Drain in Palwal, where water quality deteriorated sharply. High BOD, low Dissolved Oxygen (DO), and surges in both faecal and total coliforms were recorded, suggesting heavy sewage inflows with little or no treatment. Similarly, the Palla region, where the Diversion Drain No. 8 meets the Yamuna, exhibited extremely poor water quality, with faecal streptococci and faecal coliform levels often among the highest recorded in the study. In contrast, upstream sites such as Kalanaur (YMN-RDQ-001) and Karnal (KRN-RDQ-001) consistently displayed better water quality, with DO levels >7 mg/L, BOD <3 mg/L, and microbial counts well within acceptable ranges. These locations are generally less impacted by urban runoff and benefit from higher flow and natural dilution, especially during the monsoon season.
Spatially, the degradation trend follows a clear pattern: as the river flows from upstream rural areas through more urbanized and industrial belts, water quality declines markedly. This pattern is most prominent in the transition from Haryana to Delhi, where multiple drains discharge high pollutant loads into a river stretch that receives minimal fresh inflow during dry seasons. Temporal data also shows that certain hotspots exhibit persistent degradation year after year. For example, the Delhi segment, while not located within Haryana, influences downstream quality and has consistently recorded extreme BOD and microbial contamination from 2020 through 2022. This supports findings from previous CPCB reports and underscores the interconnectedness of regional water management.
These pollution hotspots highlight areas requiring immediate intervention through:
Strengthening sewage treatment infrastructure,
Implementing decentralized wastewater management in rural-urban transition zones,
Enforcing industrial effluent regulations, and
Enhancing real-time monitoring capabilities to enable rapid response.
Targeted remediation at these sites could significantly improve the overall health of the Yamuna River and reduce the cumulative pollutant load entering Delhi.
Comparative Analysis with Regulatory Standards
To evaluate the ecological and public health implications of the observed water quality trends, measured values across all sampling points were compared against standard limits prescribed by the Central Pollution Control Board (CPCB) and World Health Organization (WHO). This comparison provides a clear picture of where the Yamuna River and its tributaries in Haryana stand in relation to desired water quality classes. As per CPCB guidelines, a minimum DO of 5 mg/L is recommended for Class B water (outdoor bathing use). Across the study period, several stations fell below this threshold, especially during dry seasons. In 2021, DO values dropped to as low as 3.4 mg/L in downstream zones such as Khojkipur, reflecting poor aeration and high organic loading. Although some recovery was seen in 2022, compliance remained inconsistent, particularly in drain-affected sites. The acceptable limit for BOD in Class B water is <3 mg/L. This threshold was frequently and significantly exceeded. For instance, BOD values in the Delhi segment reached up to 60 mg/L, while Palwal and Khojkipur regularly recorded values between 10–20 mg/L. Only a few upstream stations such as Kalanaur and Sanoli consistently met the standard, confirming the spatial disparity in pollution levels. The CPCB recommends a pH range of 6.5 to 8.5. The Yamuna’s pH values generally complied with this range, with minor fluctuations. The lowest observed was 6.43 at a Delhi-influenced station in 2022, but this still fell within the acceptable band. Hence, pH did not emerge as a major concern in this study.
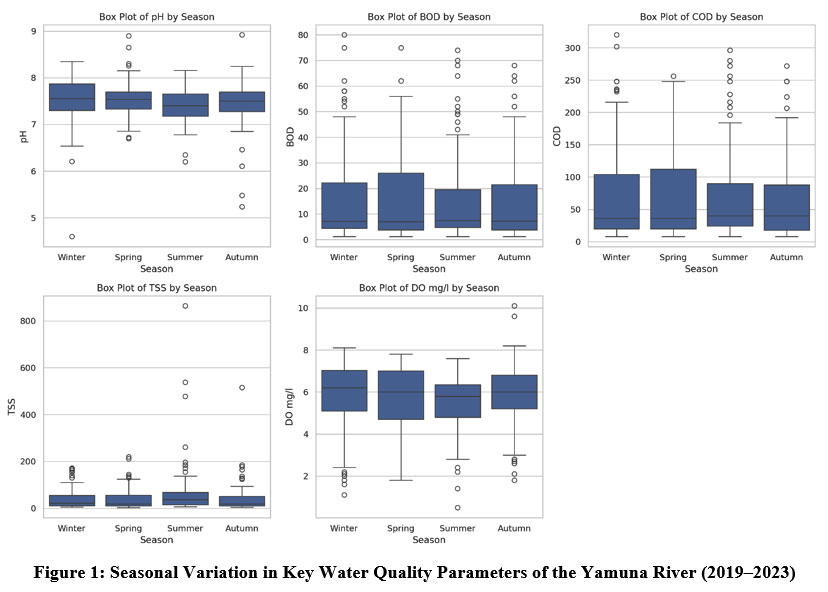 | Figure 1: Seasonal Variation in Key Water Quality Parameters of the Yamuna River (2019–2023).
|
For recreational and bathing purposes, CPCB prescribes a faecal coliform limit of <500 MPN/100 mL. This standard was severely violated across most drain-influenced stations:
Delhi segment: up to 600,000 MPN/100 mL
Khojkipur and Palwal: often exceeded 100,000 MPN/100 mL
Total coliforms also breached the 5,000 MPN/100 mL limit by several orders of magnitude.
Table 1: Compliance Assessment of Yamuna River Water Quality Parameters Against Standard Limits (2019–2023)
Parameter | Standard Limit | Max Observed | Compliance Status |
DO | >5 mg/L | 3.4 mg/L | Frequently violated |
BOD | <3 mg/L | 60 mg/L | Severely violated |
Faecal Coliform | <500 MPN/100 mL | 6,00,000 | Severely violated |
Total Coliform | <5,000 MPN/100 mL | 33,00,000 | Severely violated |
Ph | 6.5–8.5 | 6.43–8.1 | Largely compliant |
Nitrate | <45 mg/L | <1 mg/L | Fully compliant |
Conductivity | ~<750 µmho/cm (ideal) | 1225 | Elevated in downstream |
Faecal Streptococci | No CPCB limit | 3,30,000 | Indicative of unsafe water |
Such values pose serious risks for waterborne diseases, particularly in areas where river water is used for domestic or agricultural purposes. Nitrate values were consistently low (<1 mg/L) and well below the WHO threshold of 45 mg/L for drinking water. This indicates that agricultural runoff may not be the primary contributor to pollution in the studied segments. However, electrical conductivity, though lacking extensive time series data, reached 1225 µmho/cm in Delhi stretches—suggesting elevated ionic and industrial pollution. There are no formal CPCB limits for faecal streptococci, but values exceeding 100–200 MPN/100 mL are generally indicative of unsafe water. The study recorded values as high as 330,000 MPN/100 mL, again pointing to extreme microbial pollution. These comparisons highlight widespread regulatory non-compliance across multiple parameters, particularly in stretches affected by domestic and industrial wastewater. The results underscore the urgent need for intervention through improved pollution control, stricter enforcement, and enhanced real-time water quality monitoring.
Correlation Analysis of Water Quality Parameters
To investigate the interdependencies among physicochemical and microbial parameters of the Yamuna River, Pearson correlation analyses were conducted separately for each season: Pre-Monsoon, Monsoon, Post-Monsoon, and Winter. The results are visualized in Figure 1 as seasonal heatmaps, and highlight statistically relevant interactions that vary with hydrological conditions. During the pre-monsoon season, strong positive correlations were observed between BOD and COD (r = 0.99), suggesting that both parameters are influenced by common sources of organic and chemical pollution—likely untreated sewage and industrial effluents. BOD also showed a strong negative correlation with DO (r = -0.70), reinforcing the expected inverse relationship where elevated oxygen demand depletes dissolved oxygen levels. Faecal coliform and total coliform were highly correlated (r = 0.94), reflecting shared fecal contamination pathways, possibly from direct sewage discharge. Conductivity exhibited moderate positive correlations with both BOD (r = 0.65) and COD (r = 0.67), indicating that ionic pollutants may co-occur with organic matter during low-flow periods. In the monsoon season, the correlations between parameters were generally weakened, likely due to rain-induced dilution and hydrological turbulence. While the BOD–COD correlation remained strong (r = 0.98), the strength of other associations—such as DO with BOD/COD—was reduced. Notably, coliform levels continued to correlate with BOD and COD, suggesting that even during high flow, microbial contamination persists in areas with organic loading. Post-monsoon dynamics revealed partial recovery of water quality, with moderate negative correlations between DO and BOD (r = -0.64) and DO and COD (r = -0.61). The microbial indicators remained closely aligned (r = 0.91), and conductivity correlations with pollutants remained moderate, highlighting ionic retention following flood recession. In the winter season, the system returned to low-flow conditions, amplifying pollutant relationships. The BOD–COD correlation was again nearly perfect (r = 0.99), and a stronger negative association re-emerged between DO and organic parameters. Interestingly, conductivity showed its strongest correlation with COD (r = 0.72), suggesting salinity and chemical load concentration in stagnant conditions. This season also showed elevated correlations between microbial and organic parameters, reinforcing winter as a high-risk period for pollution accumulation. Across all seasons, BOD, COD, and coliform counts consistently co-varied, reinforcing their utility as integrated pollution indicators. Seasonal correlation variability suggests that monitoring efforts should be seasonally calibrated, with greater attention during Pre-monsoon and Winter, when water quality interactions are strongest and pollution most concentrated. These insights may support multivariate modeling, pollution source apportionment, and evidence-based policymaking.
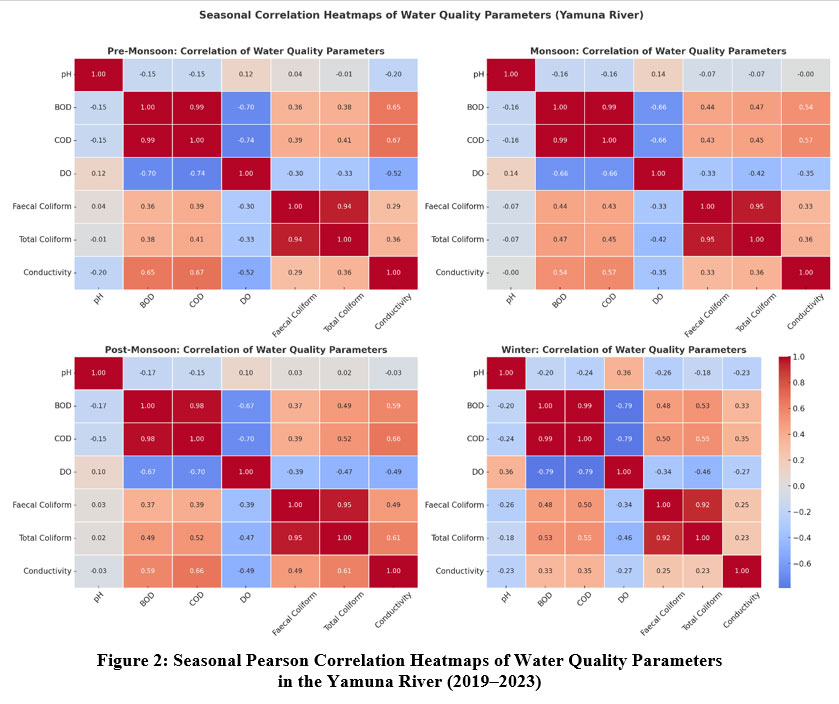 | Figure 2: Seasonal Pearson Correlation Heatmaps of Water Quality Parameters in the Yamuna River (2019–2023)
|
Principal Component Analysis (PCA)
To explore the underlying patterns and dimensional structure of water quality variation across different seasons and locations in the Yamuna River, a Principal Component Analysis (PCA) was performed on standardized values of key physicochemical and microbial parameters. The first two principal components (PC1 and PC2) captured a cumulative 71.8% of the total variance, indicating a strong capacity of the reduced dimensions to represent the dataset. PC1, accounting for 55.8% of the variance, was predominantly influenced by Biochemical Oxygen Demand (BOD), Chemical Oxygen Demand (COD), Conductivity, and microbial indicators (faecal and total coliforms). These variables clustered tightly along PC1, reflecting a strong common structure related to organic pollution and ionic concentration. Conversely, Dissolved Oxygen (DO) exhibited an inverse loading on PC1, reinforcing its known antagonistic relationship with organic contaminants. PC2, explaining 16.0% of the variance, appeared to capture secondary interactions among parameters not explained by the dominant pollution gradient. This may reflect subtle seasonal dynamics, such as variations in pH, localized treatment impacts, or temporal shifts in water temperature and turbulence. A biplot of PC1 vs PC2 (Figure 2) revealed clear seasonal clustering. Samples from the Pre-Monsoon and Winter periods formed more distinct and separated groups, suggesting heightened pollution concentration and stronger inter-parameter relationships during low-flow conditions. In contrast, Monsoon and Post-Monsoon samples were more widely dispersed, likely due to dilution effects and hydrological mixing during the wet season.
This pattern supports the interpretation that seasonality strongly moderates pollution interactions, with the most structured and pronounced pollutant gradients appearing during drier months. Additionally, overlap in certain clusters suggests that some locations consistently exhibit similar pollution signatures regardless of season—implying persistent sources of contamination. The PCA not only validates the redundancy between BOD and COD (also evident from correlation analysis), but also highlights the antagonistic role of DO and the co-behavior of microbial contaminants. By reducing complex multivariate relationships to a small number of components, PCA serves as a powerful diagnostic tool for identifying pollution drivers, grouping similar water quality profiles, and informing targeted interventions
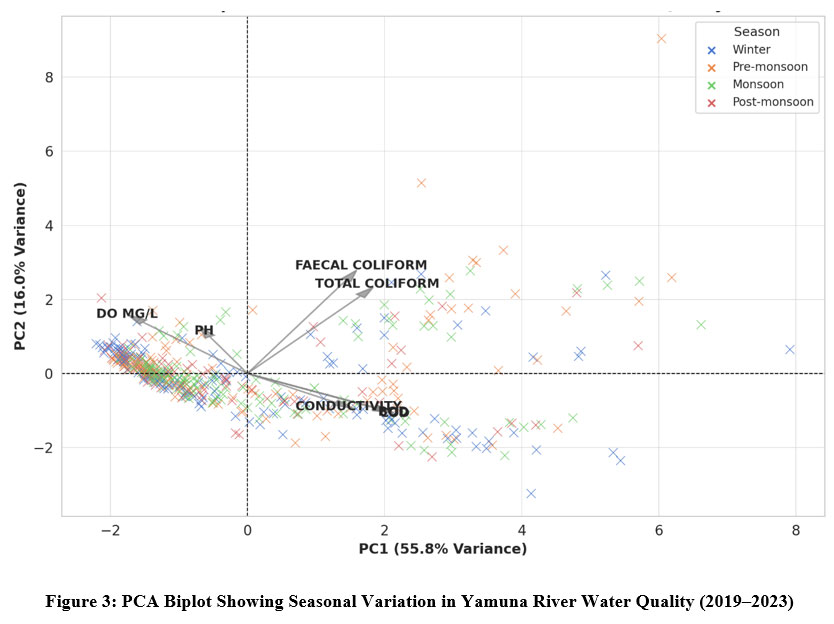 | Figure 3: PCA Biplot Showing Seasonal Variation in Yamuna River Water Quality (2019–2023)
|
The use of advanced statistical techniques, such as PCA and ANOVA, offers a deeper understanding of how various pollutants interact seasonally and spatially. By applying these methods, study able to identify key drivers of water quality variability, which is often overlooked in studies relying on simple descriptive statistics.
Riverine Ecosystem Impacts
The deteriorating water quality of the Yamuna River and its tributaries in Haryana has profound implications for the riverine ecosystem. The data from 2019 to 2023 clearly indicate that several physico-chemical and microbiological parameters consistently exceed permissible limits, particularly downstream of urban and industrial discharges. Low dissolved oxygen (DO) levels, particularly in the range of 3–4 mg/L observed at downstream stations like Khojkipur and Palwal, are inadequate to support most sensitive aquatic organisms. Hypoxic conditions can lead to fish kills, migration of species, and disruption of trophic interactions. High BOD concentrations further exacerbate oxygen depletion, especially in stagnant water stretches where decomposition of organic matter intensifies microbial oxygen demand. These conditions favour pollution-tolerant species, thereby reducing biological diversity and altering ecosystem structure. The extremely high levels of faecal and total coliforms—often exceeding standards by hundreds to thousands of times—also indicate a high risk of pathogen presence. This creates unsuitable conditions for recreational activities, animal watering, and even agricultural reuse, especially in rural areas where untreated river water may still be used for irrigation. Additionally, the presence of faecal streptococci in some zones reinforces the risk of waterborne diseases, including gastrointestinal infections and skin conditions among communities interacting with the river. Another ecological consequence of sustained nutrient loading and microbial contamination is the increased potential for eutrophication, particularly during low-flow months. While nitrate levels were relatively low in this study, the high organic loads and occasional phosphate inputs from domestic sources may still trigger algal blooms in slower river segments. Such blooms can reduce light penetration, alter pH, and further reduce DO through night-time respiration and decomposition. Conductivity levels, particularly exceed 1000 µmho/cm, reflect the presence of dissolved solids and ions—some of which may originate from industrial effluents. This can negatively impact aquatic species sensitive to salinity changes and may contribute to long-term sediment toxicity. In addition to ecological damage, these water quality trends pose serious risks to human use and livelihoods. Fisherfolk, farmers, and residents living along the river are directly impacted by poor water quality, which reduces fish availability, contaminates crops, and undermines safe water access. The loss of aesthetic and cultural value—especially in a river as spiritually significant as the Yamuna—further compounds the ecological harm. In summary, the current state of the Yamuna River in Haryana reflects a riverine system under acute stress. If unaddressed, these pressures could lead to irreversible ecosystem degradation. Restoration will require not only technological interventions but also watershed-level planning, community engagement, and inter-state coordination to manage pollution loads and rehabilitate river health.
Policy and Management Implications
The findings of this study underscore a critical need to reevaluate and reinforce current water governance practices in the Yamuna River basin, particularly across the Haryana stretch. Despite decades of policy attention under initiatives such as the Yamuna Action Plan (YAP) and the National Mission for Clean Ganga (NMCG), the persistent exceedance of CPCB water quality limits—especially for BOD, DO, and microbial contamination—demonstrates serious implementation and enforcement gaps. A central policy implication is the inadequacy of centralized sewage treatment infrastructure in managing the growing pollution loads from both urban and peri-urban areas. The study reveals that many pollution hotspots, such as Drain No. 2 in Khojkipur and Gaunchi Drain in Palwal, contribute significantly to river degradation. These inflows often bypass treatment systems entirely or enter the river after only partial treatment. Strengthening and decentralizing wastewater treatment—through modular DEWATS (Decentralized Wastewater Treatment Systems) or constructed wetlands—should be prioritized in rural and semi-urban regions. Enforcement remains another challenge. While environmental clearance norms and effluent discharge limits exist, their application is often limited by institutional fragmentation and lack of real-time monitoring. The widespread non-compliance with CPCB standards for faecal coliforms and BOD, especially in downstream segments, highlights the urgency of implementing online effluent monitoring systems (OCEMS) and empowering state pollution control boards (SPCBs) to take timely action.
This study also reinforces the importance of inter-state coordination between Himachal Pradesh, Haryana, and Delhi. Because upstream actions affect downstream outcomes, the management of the Yamuna cannot succeed through isolated state-level interventions. Integrated basin-level governance—coordinated by the Yamuna Standing Committee or NMCG—should be institutionalized with shared responsibilities and transparent reporting. Additionally, data gaps identified in parameters like faecal streptococci, nitrate, and conductivity point to weaknesses in the current monitoring framework. Establishing standardized, high-frequency, and multiparametric monitoring protocols, ideally automated and sensor-based, will improve both the accuracy and responsiveness of river management strategies. On the regulatory front, there is scope to align water quality monitoring with designated best-use classification, making it easier to assess whether the river can meet functions like bathing, irrigation, or aquatic life support. Policy focus should also extend beyond pollution control to include ecological restoration, such as riparian buffer development, phytoremediation using species like Canna indica, and flow regime restoration during dry seasons. Finally, greater community involvement and public transparency in river monitoring can drive accountability. Tools like citizen science, school-led river audits, and publicly accessible dashboards can foster participatory stewardship and put pressure on authorities to act. In conclusion, while the technical and financial resources for river cleanup exist, their strategic deployment, enforcement, and inter-agency coherence remain the missing links. A multi-pronged governance framework—combining infrastructure, institutional reform, real-time monitoring, and civic engagement—is essential for restoring the health of the Yamuna River in Haryana and beyond.
Sources of Pollution in the Yamuna River
The Yamuna River, particularly across Haryana and at the Delhi border, receives multifaceted pollutant loads from urban, industrial, and agricultural sources. The degradation of water quality observed in this study is the outcome of cumulative and chronic inputs, many of which reflect structural governance and infrastructure failures. The primary sources of pollution, as identified through data trends and literature synthesis, are outlined below.
Untreated and Partially Treated Sewage
Domestic sewage constitutes the single largest contributor to Yamuna pollution. Despite investments under programs such as the Yamuna Action Plan and NMCG, over 70% of the total pollution load in the river is discharged along just a 22 km stretch in Delhi—a zone heavily influenced by upstream flows from Haryana.10,11 Numerous drains such as Drain No. 2 (Khojkipur) and Gaunchi Drain (Palwal) were identified in this study as chronic hotspots for raw or semi-treated sewage inflows, severely exceeding permissible limits for BOD and microbial contaminants.
Urban Dry Weather Flows via Misconnected Drains
Sewage intrusion into stormwater drains during non-monsoon periods has emerged as a serious pathway for pollution. Infrastructure audits reveal that dry-weather flow in storm drains often consists of domestic wastewater due to illegal connections, sewer leakages, and faulty crossovers.6 This phenomenon was observed in Faridabad, Palwal, and Karnal—where continuous base flows in urban nullahs indicate direct sewage input.
Industrial Wastewater
Although industrial contributions are spatially constrained, their pollutant loads are often chemically complex and toxic. Industrial estates near Panipat and Sonepat discharge effluents with elevated concentrations of heavy metals, detergents, and dissolved solids. These effluents often escape effective treatment due to inadequate ETPs (Effluent Treatment Plants) or illegal disposal.5 This study recorded conductivity values exceeding 1000 µmho/cm in downstream zones, consistent with ionic loading from industrial waste.
Agricultural Runoff and Nutrient Loading
The contribution of fertilizer residues, pesticides, and sediments from agricultural fields increases significantly during the monsoon. However, nitrate levels remained consistently low (<1 mg/L) across all sampling stations during this study, suggesting limited impact during the dry season. Nonetheless, the risk of future eutrophication cannot be ruled out, particularly given intensifying peri-urban agriculture.18,19
Open Defecation and Livestock Waste
In rural stretches, especially near drain-fed confluence points, high levels of faecal coliforms and streptococci were observed. This likely stems from open defecation, lack of latrine access, and unregulated animal bathing and waste runoff. Observed faecal coliform values as high as 600,000 MPN/100 mL far exceed CPCB's Class B guideline of 500 MPN/100 mL, posing serious health risks.10,14
Flow Regulation and Limited Dilution Capacity
Post diversion at Hathnikund Barrage, the Yamuna receives only an environmental release of 160 cusecs, rendering the channel almost stagnant until Delhi. This low-flow regime drastically reduces the river’s natural assimilative and dilution capacity,10 resulting in concentration of pollutants even when pollutant volumes remain static.
Table 2: Major Pollution Sources, Key Pollutants, and Affected Zones Along the Yamuna River in Haryana
Source | Key Pollutants | Affected Zones | Evidence |
Untreated domestic sewage | BOD, coliforms, organic matter | Palwal, Panipat, Khojkipur | 10,11,14 |
Urban dry-weather flows | Pathogens, greywater, nutrients | Faridabad, Palla, Sonepat | 6,7 |
Industrial discharges | Heavy metals, surfactants, TDS | Panipat, Sonepat industrial zones | 5,10 |
Agricultural runoff | Nitrates, phosphates, pesticides (seasonal) | Rural Haryana (monsoon only) | 18,19 |
Open defecation & livestock | Faecal coliforms, streptococci, sediments | Kalanaur, Palwal outskirts | 10,14 |
Flow regulation (Hathnikund) | Reduced dilution capacity | Entire Haryana downstream of Tajewala | 10,13 |
These pollution sources operate synergistically, with poor flow conditions amplifying the impact of otherwise localized discharges. Acknowledging and addressing this multi-source complexity is critical for designing adaptive, spatially targeted, and participatory river restoration strategies.
Discussion
The findings of this study not only reveal alarming trends in the water quality of the Yamuna River across Haryana but also align with, extend, and in some cases challenge insights presented in existing literature. By focusing on a spatiotemporal dataset spanning five years and 14 stations, this work offers a deeper understanding of pollution dynamics, especially upstream of Delhi—a region comparatively underrepresented in scholarly discourse. Sharma and Kansal13 conducted one of the earliest long-term studies of the Yamuna in Delhi and reported severe violations of water quality norms, with BOD concentrations exceeding 30 mg/L and DO levels dropping below 2 mg/L. Their work attributed these patterns to untreated sewage inflow and inefficient infrastructure. The current study not only confirms such trends but also demonstrates that degradation begins well before the river enters Delhi. Downstream of major drains like Khojkipur and Palwal, BOD levels consistently ranged from 15–25 mg/L, with microbial contamination far exceeding acceptable limits, suggesting a broader spatial origin of river pollution. This spatial extension of pollution origins is supported by Verma et al.,14 who emphasized the role of upstream inflows in deteriorating water quality in Delhi. Study data substantiate their modeling-based findings with field evidence, pinpointing specific Haryana drains—such as Drain No. 2 and Gaunchi Drain—as major contributors. Similarly, Mutiyar and Mittal11 reported the persistence of pharmaceutical residues in the Yamuna downstream of STPs, implicating inadequate treatment efficiency. While this study did not assess antibiotics, the prevalence of high BOD, COD, and faecal coliforms post-confluence strongly supports their conclusion of systemic STP underperformance. Flow regulation is another factor repeatedly cited in the literature. Upadhyay et al.,19 and the CPCB10 both identified reduced discharge from the Hathnikund Barrage as a key cause of stagnation and pollutant accumulation during dry seasons. This study reaffirms that post-barrage, the Yamuna’s discharge—restricted to 160 cusecs—is grossly insufficient to maintain ecological integrity, resulting in hypoxic conditions at multiple points in Karnal and Panipat.
From a pollution source perspective, several studies echo the role of misconnected drainage systems and urban infrastructure failure. Xu et al.,7 and Yin et al.,6 emphasized the influence of dry-weather flows in stormwater drains due to illegal sewer connections and leaking pipelines. The current study mirrors these findings, with sites in Faridabad, Palla, and Sonepat showing continuous baseflow in drains, suggestive of underlying cross-connections between domestic sewage and storm drains. While agricultural runoff was identified as a contributor in the monsoon by Yan et al.,18 this study observed consistently low nitrate levels across seasons, indicating minimal non-point source influence during dry periods. Nonetheless, the methodology used here—combining GIS-based sampling point selection and trend analysis—reinforces their advocacy for spatially targeted pollution diagnostics. In terms of industrial pollution, Aggarwal et al.,5 highlighted the accumulation of heavy metals in Ganga river sediments near industrial zones. Though metal concentrations were not the focus in this analysis, stations like Panipat and Khojkipur recorded electrical conductivity values exceeding 1000 µmho/cm, hinting at possible ionic or metal-laden discharges—consistent with patterns reported in their study. Finally, the recent CPCB10 assessment underlines the failure of over half the STPs in the Yamuna basin to comply with standards, and identifies microbial contamination levels >1 million MPN/100 mL in downstream outfalls. This aligns with study findings, where similar microbial exceedances were recorded upstream of Delhi, further emphasizing the transboundary nature of pollution and the need for inter-state cooperation in mitigation. Together, these comparisons not only validate the rigor and relevance of the current study but also fill a vital spatial and temporal gap in Yamuna River research. Study reinforce the call for basin-scale governance, flow restoration, real-time monitoring, and targeted infrastructure investment to reverse ecological decline. Several challenges were encountered during the study. Some sites were inaccessible during monsoons due to flooding, resulting in occasional data gaps. COVID-19-related restrictions caused delays in field campaigns during 2020–2021. Hydraulic data for river discharge were unavailable for all sampling events, limiting flow-adjusted pollutant load estimation. These constraints, however, do not undermine the integrity of the multi-year trends reported. This study provides empirical evidence that the Haryana segment of the Yamuna is ecologically stressed prior to its entry into Delhi. The persistence of high BOD and microbial contamination underscores the need for targeted policy interventions. This study highlights the spatiotemporal variability of water quality in the Brahmani River Basin, identifying pollution hotspots and their causes. Sites H-(1), (2), and (7) consistently showed high pollutant concentrations, primarily due to industrial effluents, agricultural runoff, and urban discharges.22 Cluster Analysis (CA) classified the sampling sites into three groups, with 57.14% of sites falling into the "poor" water quality category, indicating the urgent need for targeted interventions. This pattern mirrors findings from other regions like the Yamuna River, where urban runoff and untreated wastewater are major contributors to water quality degradation.23,24 The use of Multi-Criteria Decision-Making (MCDM) techniques, specifically Simple Additive Weighting (SAW), provided valuable insights into the pollution sources and their impact on water quality. High pollution levels were observed in areas influenced by runoff from urban, industrial, and agricultural sources.25,26 This reinforces the need for better wastewater treatment infrastructure, pollution control, and sustainable farming practices, particularly in identified hotspots. The findings are consistent with those from the Tigris River, where urbanization and agricultural practices contributed significantly to water contamination.27 The findings align with global research, which highlights the significant role of urbanization and industrial discharge in water pollution.24 The study calls for integrated water management approaches that include continuous monitoring, seasonal analysis, and effective governance at both local and basin levels.26 Furthermore, seasonal variations in water quality, especially related to nutrient concentrations, highlight the need for ongoing efforts to manage nutrient inputs and mitigate eutrophication risks.28 Recommendations for future research include further investigation into heavy metals and emerging contaminants, as well as exploring the effects of climate change on water quality. Management strategies should focus on decentralized wastewater treatment, enhancing effluent treatment, and real-time monitoring systems to enable responsive management.29 Additionally, integrating land use management and pollutant source identification can help in better-targeted interventions for water quality restoration.25 In conclusion, the study underscores the importance of improved water quality management and policy interventions to mitigate pollution in the Brahmani River Basin, aligning with strategies proposed in previous studies for regions like Lake Dian and the Yellow River. 25,26 Study recommend establishing decentralized wastewater treatment systems in peri-urban zones, strengthening real-time monitoring along tributaries, and integrating water quality data with land use planning. Seasonal monitoring protocols should be institutionalized to capture peak pollution periods and inform adaptive river basin management. Through multi-year, multi-site monitoring, this study has characterized spatiotemporal variations in water quality across Haryana’s Yamuna basin. Results demonstrate alarming degradation patterns driven by untreated effluents and diffuse pollution sources. The application of robust statistical methods and QA/QC procedures strengthens the validity of study findings. Future work should incorporate hydrological modeling and pollutant source tracking to support integrated river restoration efforts in the region.
Conclusion
This study presents a comprehensive spatiotemporal assessment of water quality in the Yamuna River and its major tributaries and drains across Haryana over a five-year period (2019–2023). By analyzing 14 strategically selected sampling points—encompassing upstream, downstream, and drain confluence zones—across multiple seasons and years, the research uncovers persistent patterns of degradation driven by untreated sewage, industrial discharges, flow regulation, and microbial contamination. Key findings highlight consistently high BOD levels (often exceeding 20 mg/L), depressed dissolved oxygen (<4 mg/L in several locations), and severe microbial pollution, particularly in downstream stations and drain-impacted zones like Khojkipur, Palwal, and Palla. While parameters like nitrate and phosphate remained within acceptable limits across most sites, the consistently elevated conductivity and coliform counts raise urgent concerns for ecological health and public safety. The reduction in river discharge post-Hathnikund Barrage, along with poor STP performance and dry-weather sewage flows, has left large stretches of the river with minimal assimilative capacity. These findings reveal that critical ecological degradation occurs upstream in Haryana, underscoring the need for urgent, decentralized pollution control measures and coordinated basin-wide management before the Yamuna enters Delhi. A comparative analysis with existing literature reaffirms and extends previous findings from Delhi and adjacent regions, but also introduces novel insights from underexamined upstream locations in Haryana. Unlike earlier studies that focused on single-year or end-point pollution assessments, this work provides a temporal lens into pollution persistence, emerging hotspots, and spatial transitions in water quality. It also identifies data gaps—such as those for faecal streptococci and heavy metals—which, if addressed, could further strengthen pollution diagnostics and policy responses. The implications are clear: piecemeal interventions will not suffice. This study underscores the critical need for decentralized wastewater treatment systems, especially in rural and semi-urban regions. The novel contribution of this study lies in its ability to pinpoint upstream pollution sources, a critical insight for improving basin-wide water governance. The findings provide actionable recommendations for river management, including targeted infrastructure interventions, seasonal monitoring, and inter-state coordination to address upstream pollution before it affects the downstream regions. Restoring the ecological health of the Yamuna requires integrated basin-scale planning, improved real-time monitoring, and decentralized infrastructure solutions tailored to rural and semi-urban geographies. Special attention must be paid to drain-level pollution controls, STP efficiency upgrades, and flow regime restoration. While this study provides robust evidence to inform river management, its limitations—such as missing data for certain microbial and metal parameters—should be acknowledged. Future research should integrate ecotoxicological indicators, remote sensing, and hydrological modeling to develop more predictive and system-wide understanding of riverine health. Ultimately, this research underscores that without strong inter-state coordination, institutional reform, and community engagement, the vision of a rejuvenated Yamuna River will remain elusive. The findings advocate for immediate, science-driven, and participatory strategies to arrest further degradation and to protect one of India’s most culturally and ecologically significant rivers.
Acknowledgment
The authors gratefully acknowledge the Central Pollution Control Board (CPCB) and Haryana state pollution control board, India, for providing publicly accessible air quality data. The data accessed has been instrumental in supporting the analysis and findings presented in this study.
Funding Sources
The author(s) received no financial support for the research, authorship, and/or publication of this article.
Conflict of Interest
The authors do not have any conflict of interest.
Data Availability Statement
Data examined throughout this study are provided within the manuscript.
Ethics Statement
This research did not involve human participants, animal subjects, or any material that requires ethical approval.
Informed Consent Statement
This study did not involve human participants, and therefore, informed consent was not required.
Permission to reproduce material from other sources
Not Applicable
Author Contributions
The sole author was responsible for the conceptualization, methodology, data collection, analysis, writing, and final approval of the manuscript
References
- Shekhar S, Sarkar A. Hydrogeological and hydrochemical characterization of a part of the Yamuna flood plain, Delhi, India. Environmental Earth Sciences. 2013;68:1023-1038. doi:10.1007/s12665-012-1805-5
- Chotpantarat S, Thamrongsrisakul J. Natural and anthropogenic factors influencing hydrochemical characteristics and heavy metals in groundwater surrounding a gold mine, Thailand. Journal of Asian Earth Sciences. 2021;211:104692. doi:10.1016/j.jseaes.2021.104692
CrossRef - Das N, Bhattacharjee R, Choubey A, Agnihotri AK, Ohri A, Gaur S. Analysing the change in water quality parameters along river Ganga at Varanasi, Mirzapur and Ghazipur using Sentinel-2 and Landsat-8 satellite data during pre-lockdown, lockdown and post-lockdown associated with COVID-19. Journal of Earth System Science. 2022;131(2):102. doi:10.1007/s12040-022-01825-0
CrossRef - Qian L, Zhao Y, Wang H, Dang S. Prediction of water shortage loss in situations with small samples based on an improved Gumbel copula. Journal of Earth System Science. 2021;130. doi:10.1007/s12040-020-01490-1
CrossRef - Aggarwal M, Anbukumar S, Vijaya Kumar T. Heavy metals concentrations and risk assessment in the sediment of Ganga River between Kanpur and Prayagraj, UP, India. Sadhana. 2022;47:1-12. doi:10.1007/s12046-022-01972-6
CrossRef - Yin H, Xie M, Zhang L, et al. Identification of sewage markers to indicate sources of contamination: Low cost options for misconnected non-stormwater source tracking in stormwater systems. Science of the Total Environment. 2019;648:125-134. doi:10.1016/j.scitotenv.2018.07.448
CrossRef - Xu Z, Yin H, Li H. Quantification of non-stormwater flow entries into storm drains using a water balance approach. Science of the Total Environment. 2014;487:381-388. doi:10.1016/j.scitotenv.2014.04.035
CrossRef - Kumar B, Singh UK, Ojha SN. Evaluation of geochemical data of Yamuna River using WQI and multivariate statistical analyses: A case study. International Journal of River Basin Management. 2019;17(2):143-155. doi:10.1080/15715124.2018.1437743
CrossRef - Patel PP, Mondal S, Ghosh KG. Some respite for India’s dirtiest river? Examining the Yamuna’s water quality at Delhi during the COVID-19 lockdown period. Science of the Total Environment. 2020;744:140851. doi:10.1016/j.scitotenv.2020.140851
CrossRef - Central Pollution Control Board (CPCB). Report on Water Quality of River Yamuna at Interstate Locations, Drains and Compliance Status of STPs in Delhi. Published online 2023. https://greentribunal.gov.in/sites/default/files/news_updates/REPORT%20BY %20CPCB%20IN%20OA% 20NO.%2021%20o f%202023% 20Ashwani%20Yadav%20Vs.%20Govt.%20of%20NCT%20of%20Delhi.pdf
- Mutiyar PK, Mittal AK. Occurrences and fate of selected human antibiotics in influents and effluents of sewage treatment plant and effluent-receiving river Yamuna in Delhi (India). Environmental Monitoring and Assessment. 2014;186(1):541-557. doi:10.1007/s10661-013-3398-6
CrossRef - Ghosh KG, Mondal S, Patel PP. Spatiotemporal changes in river water quality during COVID-19 lockdown: An analysis on river Yamuna, India. Environmental Science and Pollution Research. 2021;28:67910-67928. doi:10.1007/s11356-021-15369-5
- Sharma D, Kansal A. Water quality analysis of River Yamuna using water quality index in the national capital territory, India (2000–2009). Applied Water Science. 2011;1(3–4):147-157. doi:10.1007/s13201-011-0011-4
CrossRef - Verma N, Singh G, Ahsan N. Spatiotemporal assessment of Yamuna River water quality during COVID-19 lockdown using WQI and GIS: A case study of Delhi stretch, India. Environmental Monitoring and Assessment. 2022;194(2):94. doi:10.1007/s10661-021-09748-z
- Bhat MA, Jeelani G, Shah RA. Hydrogeochemical characteristics of the surface water and groundwater in the middle catchment of the Jhelum River Basin, Kashmir Himalaya, India. Environmental Earth Sciences. 2018;77(7):1-17. doi:10.1007/s12665-018-7387-5
CrossRef - Mandal P, Singh AK, Majumder CB. A review on arsenic: Source, exposure, metabolism, genotoxicity and remediation techniques. Environment International. 2010;36(6):514-532. doi:10.1016/j.envint.2010.05.008
CrossRef - Vaid A, Agrawal R, Mittal AK. Source identification and spatiotemporal distribution of emerging contaminants in the River Yamuna using advanced analytical techniques. Environmental Science and Pollution Research. 2022;29:50845-50858. doi:10.1007/s11356-022-19140-1
- Yan CA, Zhang W, Zhang Z, Liu Y, Deng C, Nie N. Assessment of water quality and identification of polluted risky regions based on field observations & GIS in the Honghe River Watershed, China. PLoS ONE. 2015;10(3):e0119130. doi:10.1371/journal.pone.0119130
CrossRef - Upadhyay R, Dasgupta N, Hasan A, Upadhyay SK. Managing water quality of River Yamuna in NCR Delhi. Physics and Chemistry of the Earth, Parts A/B/C. 2011;36(9–11):372-378. doi:10.1016/j.pce.2010.03.018
CrossRef - Grzegorzek M, Latif M, Yasmeen F, et al. Advances in phytoremediation technologies for sustainable and green treatment of industrial wastewater. Chemosphere. 2023;329:138640. doi:10.1016/j.chemosphere.2023.138640
CrossRef - Mustafa A, Hayder G. Phytoremediation: a promising approach for contaminant removal from wastewater. Environmental Technology & Innovation. 2021;24:102014. doi:10.1016/j.eti.2021.102014
CrossRef - Das A. Surface water potential zones delineation and spatiotemporal variation characteristics of water pollution and the cause of pollution formation in Brahmani River Basin, Odisha. HydroResearch. 2025;8:99-112. doi:10.1016/j.hydres.2024.10.002
CrossRef - Antil R, Kumari N, Singh D. Comparative Assessment of Pollution Indices of Selected Tree species in Urban, Industrial, Institutional and Agricultural Setups at Sonipat, Haryana, India. Published online 2025. Accessed May 19, 2025. http://editorial.neptjournal.com/index.php/1/article/view/733
- Kuznietsov P, Biedunkova O. Application of Multivariate Statistical Techniques for Assessing Spatiotemporal Variations of Heavy Metal Pollution in Freshwater Ecosystems. Water Conserv Sci Eng. 2025;10(1):13. doi:10.1007/s41101-025-00341-8
CrossRef - Ma C, Sun W, Yang Z, Wang J, Zhou L. Spatiotemporal variations in land use impacts on river water quality in a mountain-to-plain transitional basin in arid region of northern China. Journal of Contaminant Hydrology. 2025;271:104542. doi:10.1016/j.jconhyd.2025.104542
CrossRef - Li H, Zhang H, Duan L, et al. Spatiotemporal variations in water quality parameters and assessment of the current status and challenges of eutrophication in Lake Dian. Ecological Indicators. 2025;177:113821. doi:10.1016/j.ecolind.2025.113821
CrossRef - Algamal ZY, Shehab ZN, Faisal RM. Spatiotemporal variation analysis of Tigris River water quality in Mosul, Iraq during 2020–2023 based on environmetric techniques. Environ Earth Sci. 2025;84(2):69. doi:10.1007/s12665-024-12086-z
CrossRef - Chen S, Luo Y, Qiu Y, et al. Spatiotemporal evolution of environmental factors in representative tributaries of the Yellow River: insights from a decade of monitoring data. Environ Geochem Health. 2025;47(5):152. doi:10.1007/s10653-025-02442-8
CrossRef - Varma K, Saxena A, Jha PK, Tripathi P, Kumar M. Geogenic Weathering, Spatial/Seasonal Variability, and Nonpoint Pollution Govern the Aquatic Ionic Probability Exceedance and Associated Health Risks in the Ganga and Yamuna Rivers. ACS EST Water. 2025;5(6):3129-3146. doi:10.1021/acsestwater.5c00026
CrossRef
Abbreviations List
BOD – Biochemical Oxygen Demand;
COD – Chemical Oxygen Demand;
DO – Dissolved Oxygen;
EC – Electrical Conductivity;
TDS – Total Dissolved Solids;
pH – Potential of Hydrogen;
FC – Faecal Coliform;
TC – Total Coliform;
MPN – Most Probable Number;
PCA – Principal Component Analysis;
ANOVA – Analysis of Variance;
QA/QC – Quality Assurance / Quality Control;
CPCB – Central Pollution Control Board;
WHO – World Health Organization;
IS:3025 – Indian Standard for water testing methods;
AAS – Atomic Absorption Spectroscopy;
SPSS – Statistical Package for the Social Sciences;
DEWATS – Decentralized Wastewater Treatment Systems;
NMCG – National Mission for Clean Ganga;
ETP – Effluent Treatment Plant;
OCEMS – Online Continuous Effluent Monitoring System;
YAP – Yamuna Action Plan.


