Analysis of Pollution Load, Assimilation Capacity, and Pollution Status of Babon River, Semarang, Central Java
Haeruddin Haeruddin
*
 , Arif Rahman
, Kukuh Prakoso
and Diani Estining Tyas
, Arif Rahman
, Kukuh Prakoso
and Diani Estining Tyas
1
Department of Aquatic Resources,
Faculty of Fisheries and Marine Sciences,
Diponegoro University,
Semarang,
Central Java
Indonesia
http://dx.doi.org/10.12944/CWE.20.3.11
Copy the following to cite this article:
Haeruddin H, Rahman A, Prakoso K, Tyas D. E. Analysis of Pollution Load, Assimilation Capacity, and Pollution Status of Babon River, Semarang, Central Java. Curr World Environ 2025;20(3). DOI:http://dx.doi.org/10.12944/CWE.20.3.11
Copy the following to cite this URL:
Haeruddin H, Rahman A, Prakoso K, Tyas D. E. Analysis of Pollution Load, Assimilation Capacity, and Pollution Status of Babon River, Semarang, Central Java. Curr World Environ 2025;20(3).
Download article (pdf)
Citation Manager
Publish History

Introduction
Semarang Bay is part of the Java Sea waters, stretching from Tanjung Korowelang in Kendal Regency to the coast of Morodemak, Demak Regency, at a distance of about 23 miles and a water area of approximately 23 miles.1,2,29 Streams empty into this bay.3 The number of rivers that empty into Semarang Bay, causing the waters of the bay to be prone to pollution, by waste from various activities on coastal lands and along river flows, such as agriculture, aquaculture, households, and industry, and carried by currents to the sea.4 Research by the Ministry of Marine Affairs and Fisheries shows that the concentration of nitrates, phosphates, sulfides, phenols, cadmium, lead, copper, nickel, and coliform bacteria exceeds the concentration of quality standards, causing the coastal waters of Semarang Bay to be heavily to very heavily polluted by these various substances.5
The Babon River is believed to contribute to the pollution in Semarang Bay, primarily because of rapid changes in land use in the watershed. Over 15 years (from 1986 to 2001), the area designated for residential use increased by 730 hectares (34%), whereas agricultural land shrank by 28% and pond land decreased by 5%.6 In the Babon sub-watershed, land use was categorized as follows: 70% open land, 27% closed land, and 3% river. The open land consisted of 30% grassland, 34% plantations and gardens, and 6% dry land and fields. In contrast, closed land includes 26.6% designated for settlements and activities, with only 0.4% allocated for buildings.7
The Babon River flows through four districts, namely East Ungaran District, Semarang Regency, Tembalang, Pedurungan, and Genuk Districts in Semarang. The population densities in these districts were as follows: 2,100 people/km² in East Ungaran, 4,730 people/km² in Semarang Regency, 9,335 people/km² in Tembalang, and 4,680 people/km² in Pedurungan. Areas with a population density greater than one person/km were classified as densely populated urban areas.8
Based on BMWP-ASPT measured the macrozoobenthos index, the upstream section of the Babon River exhibits slightly to moderately polluted water quality; the middle stream is moderately polluted, nearing the upstream's slight pollution, while the downstream is highly polluted.9 The research results indicated that the Babon River water is still suitable for recreation, freshwater aquaculture, livestock use, plant utilization, and irrigation.10
The Babon River serves as a water supply for fisheries, agriculture, and livestock.11 Utilization as a source of drinking water since 2002 for the Kudu Drinking Water Treatment Plant in Kedung Mundu and Pucang Gading, Semarang City, requires stricter water quality management in the Babon River to meet the quality standards.12 Knowledge of the pollution load, assimilation capacity, and pollution status of the Babon River water is necessary to regulate the water quality of the Babon River so that the pollution burden does not exceed the river's assimilation capacity.
Materials and Methods
Location and Time of Research
Water sampling was conducted from late April to early May, late June to early July, and late August to early September. Samples were collected from seven observation stations (Figure 1). The coordinates of each station are: station 1 (7°5' 39.1524" S, 110°27'4.536" E), station 2 (7°4'12.0822" S, 110°27'47.88" S), station 3 (7°3'13.4784" S, 110° 28' 50.736" E), station 4 (7° 2' 22.2066" S, 110° 29' 3.3" E), station 5 (7° 0' 42.0732" S, 110° 29'29.0394" E), station 6 (6°59'20.8464" S, 110°29'40.056" E), station 7 (6°56'46.9494" S, 110°28'46.884" E).
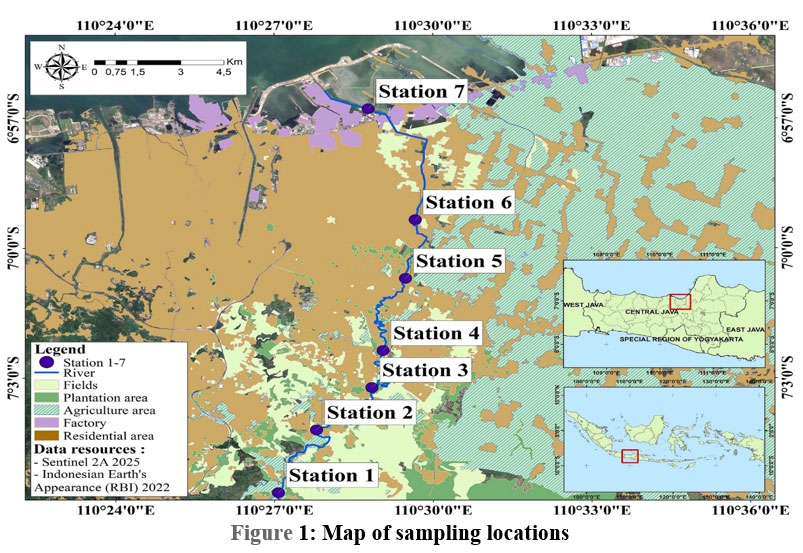 | Figure 1: Map of sampling locations
|
Data Collection Methods
This study was a surveyresearch. Data were collected from water samples using purposive random sampling. Water samples (up to 2 L each) were collected using a Van Doorn Bottle Sampler. Samples for organic compound analysis were placed in dark-colored glass bottles, and those for metal analysis were placed in plastic ones. Water samples for metal analysis were treated with 0.5 ml of 65% HNO3.13
The gravimetric method was used to determine the concentration of Total Suspended Solids (TSS). The Total Dissolved Solids (TDS) were measured on-site using a HORIBA water checker. The nitrate concentration in water was determined according to the parameters stated in SNI Method SNI 6989.79:2011, which refers to water and wastewater testing for nitrate (NO3-N) using a cadmium-reduced UV-visible spectrophotometer.14 The phosphate levels were examined based on SNI 06-6989.31-2005: Water and Wastewater-Part 31: A method for testing phosphate concentrations using an ascorbic-acid spectrophotometer. Total phosphate was measured using a spectrophotometer in accordance with SNI 06-6989.31-2005. Metal concentrations in river water were measured using a spectrophotometer according to the methods of the APHA, AWWA, and WEF.15
Data Analysis Methods
The parametric one-way ANOVA was used to assess the difference in discharge between stations, and between sampling times. Previously, a Ryan-Joiner normality test was performed to check whether the data spread normally to qualify the parametric test. Data analysis was performed to assess the pollution load, assimilation capacity, and pollution conditions of the river water. The extent of pollution in river water was evaluated using the formula provided in Annex 2 of the Regulation of the Minister of Environment of the Republic of Indonesia Number 01 of 2010.10,17,18 as follows:
![]()
where PL = pollution load (kg/day), Q = river water discharge (m3/sec), C = TSS, nitrate, phosphate, and metal concentrations (mg/L), and f = conversion factor = 86.4 = (1 kg/1000000 mg) × (1000 liters/1 m3) × (84,600 s. /1 d) = 86.4 kg. lt.s.mg.m3.day.
The assimilation capacity of river water is determined by the Local Authority Services National Training Group (LASNTG)19 formula:
The following formulas define nitrate and phosphate:
![]()
where AC = Assimilation Capacity (kg/day), Cmax = contaminant concentration on water quality standards (mg/l), Cback = Average Concentration of Contaminants in the Upper Reaches of the River (mg/l), and F95 = maximum river water discharge in the Rainy Season.
The metals and various other toxic substances were determined using the following formula:
![]()
Where DWF is the minimum river water discharge in the arid season.
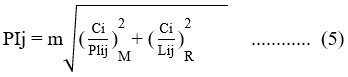
The status of water pollution is calculated according to the formula of the Decree of the Minister of Environment, Republic of Indonesia, Number 115 of 2003.20
![]()
Pij represents the pollution index for allocation (j), calculated as a function of Ci/Lij, where Ci is the water concentration specified by quality standard j. In this case, the designation used is the classification of class II water quality standards based on the National Water Quality Standards for rivers and similar sources, as regulated by Appendix 6 of Government Regulation Number 22 of 2021 concerning the Implementation of Environmental Protection and Management (Secretariat of State of the Republic of Indonesia, 2021). A Pij value of >1 indicates that the river water has been polluted, and this situation is called the state of criticism. Thus, it is calculated as follows:
Where m = balancing factor
The critique state is used to compute m.
PIj = 1.0 if the maximum value of Ci/Lij = 1.0 and the average value of Ci/Lij = 1.0, then,
.jpg)
If m = 1/2 , then equation (7) becomes
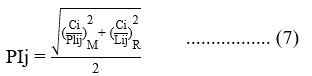
The water quality standard employed is the Class II classification based on the National Water Quality Standard for rivers and lakes, as stipulated in Appendix 6 of Government Regulation Number 22 of 2021.21 Water classified as Class II is intended for recreational water facilities, freshwater aquaculture, livestock use, crop irrigation, and other uses requiring comparable water quality. The designation of Class II water is based on the requirements for community activities along rivers. According to the Minister of Environment's Decree Number 115 of 2003, river water is classified using a Pollution Index of 20, as presented in table.
Table 1: River Water Classification Based on Pollution Index (PI)
PI | Classification |
0 | Meet quality standards (good condition) |
1,0 | Light polluted |
5,0 < PIj | Medium polluted |
PIj > 10 | Heavy polluted |
Results
The normality test revealed that the Babon River discharge data spread normally. The results of the ANOVA for the Babon River discharge at the seven sampling stations are displayed in the table below.
Table 2: The analysis of variance results for the Babon River discharge between sampling stations
Sources of Variance | DF | SS | MS | F | P |
Stations | 6 | 1.005 | 0.167 | 1.57 | 0.227 |
Error | 14 | 1.491 | 0.106 | ||
Total | 20 | 2.495 |
S = 0.3263R-Sq = 40.26%R-Sq(adj) = 14.66%
The variance analysis showed no noticeable difference in discharge between the sampling stations, and the analysis of variance in the Babon River discharge between sampling times at the seven sites is presented in table below.
Table 3: The analysis of variance results for the Babon River discharge between sampling times.
Sources of Variance | DF | SS | MS | F | P |
Sampling time | 2 | 0.277 | 0.139 | 1.13 | 0.346 |
Error | 18 | 2.218 | 0.123 | ||
Total | 20 | 2.495 |
S = 0.3510R-Sq = 11.12%R-Sq(adj) = 1.24%
Analysis of variance showed no noticeable difference in discharge between sampling times at the various stations. The pollution load and assimilation capacity of various sampling stations in the Babon River are shown in Figures 2 and 3.
The data in Figure 2 and 3 show that several water quality variables have pollution loads that do not exceed the assimilation capacity of waters at all sampling locations and times, namely, TSS, nitrates (except at stations 1, 1, and 2), total phosphates, some exceed at specific times only, namely: station 1 Cd at sampling 1 and 2 and Cr at sampling 2, station 2: Cd at sampling 1, and Cr at sampling 2. Cd, Cr, and Pb levels exceeded the assimilation capacity at all sites, except for Cd at stations 1 and 2 during sampling 1 and 2. Appendices 1 and 2 contain the full pollutant load and assimilation capacity data, respectively, for several observation stations along the river. The pollution status of Babon River water and sediments is presented in Table 4.
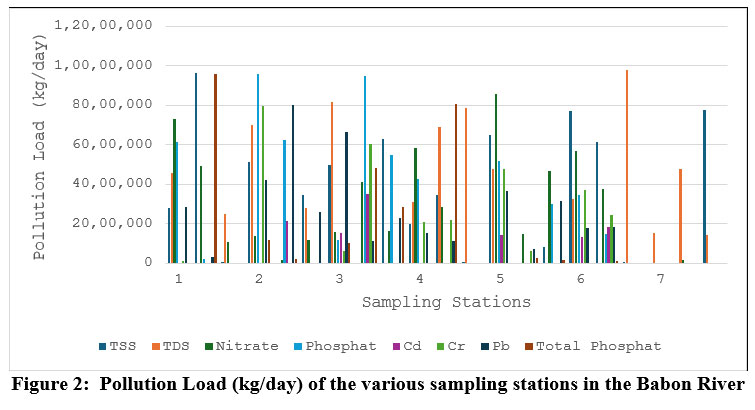 | Figure 2: Pollution Load (kg/day) of the various sampling stations in the Babon River
|
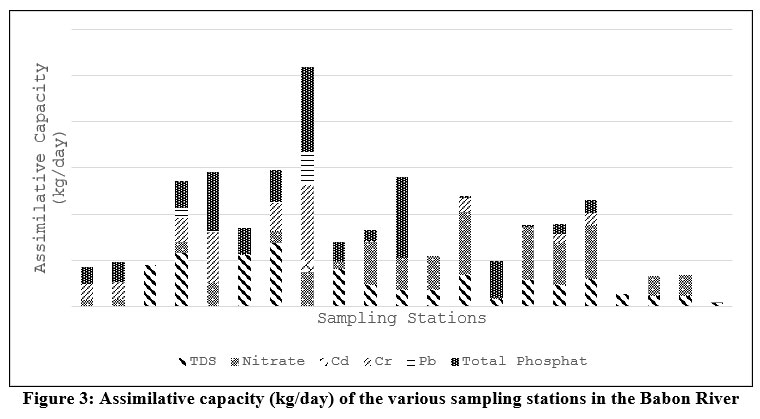 | Figure 3: Assimilative capacity (kg/day) of the various sampling stations in the Babon River
|
Table 4: Average and Maximum Ci/Lij,Ci/Lij-New, and Plj values for assignment Pollution status of Babon River waters
Stations | Variables | Ci/Lij | Ci/Lij | Ci/Lij | Ci/Lij-New | Ci/Lij-New | Pollution Index |
Stations | Variables | 1 | 2 | 3 | 1 | 2 | 3 |
1 | Average | 3.531 | 2.740 | 1.871 | 2.408 | 1,719 | 1.609 |
Max | 12.180 | 13.067 | 7.133 | 6.428 | 6.581 | 5.266 | |
PIj | 4.854 | 4.809 | 3.894 | ||||
2 | Average | 2.662 | 2.566 | 2.151 | 2.261 | 1.769 | 1.576 |
Max | 6.325 | 11.133 | 8.100 | 5.005 | 6.233 | 5.542 | |
PIj | 3.884 | 4.582 | 4.074 | ||||
3 | Average | 3.177 | 3.002 | 2.306 | 2.734 | 2.324 | 1.608 |
Max | 6.767 | 10.533 | 9.833 | 5.152 | 6.113 | 5.964 | |
PIj | 4.124 | 4.624 | 4.367 | ||||
4 | Average | 3.267 | 4.469 | 2.638 | 2.759 | 2.818 | 1.664 |
Max | 6.918 | 12.960 | 12.367 | 5.200 | 6.563 | 6.461 | |
PIj | 4.162 | 5.051 | 4.718 | ||||
5 | Average | 4.328 | 4.730 | 3.887 | 3.152 | 3.012 | 1.883 |
Max | 8.900 | 15.467 | 19.000 | 5.747 | 6.947 | 7.394 | |
PIj | 4.635 | 5.354 | 5.395 | ||||
6 | Average | 4.639 | 4.331 | 3.692 | 3.191 | 3.084 | 1.890 |
Max | 12.000 | 10.833 | 16.067 | 6.396 | 6.174 | 7.030 | |
PIj | 5.054 | 4.880 | 5.147 | ||||
7 | Average | 5.297 | 4.289 | 2.519 | 3.292 | 3.093 | 1.141 |
Max | 14.000 | 10.167 | 16.767 | 6.731 | 6.036 | 7.122 | |
PIj | 5.298 | 4.796 | 5.100 |
Table 4 displays the Babon River water pollution index at various research stations as follows: Station 1 varied from 3.894 to 4.854, Station 2 ranged from 3.884 to 4.582, Station 3 ranged from 4.124 to 4.624, Station 4 ranged from 4.162 to 5.051, Station 5 ranged from 4.635 to 5.395, Station 6 ranged from 4.880 to 5.147, and Station 7 ranged from 4.796 to 5.298. According to the pollution status criteria (Table 1), the Babon River was weakly contaminated at stations 1, 2, and 3 and moderately polluted at stations 4, 5, 6, and 7. Appendix 3 provides basic facts for determining the pollution level in the Babon River.
Discussion
The pollution load is the concentration of pollutants in water or wastewater.21 The pollution load of river water is determined by the pollutant concentration and river discharge (Equation 1). The cross-sectional area and water flow rate determine river discharge, and pollutant dilution is strongly affected by both flow rate and cross-sectional area. River cross-sectional area and flow rate vary between the dry and rainy seasons. The volume of river water was smaller and the flow speed was slower during the dry season; therefore, the discharge was lower than that during the rainy season. Consequently, the assimilation capacity of rivers is lower than that during the rainy season because of a drop in the volume of water for diluents, and the concentration of contaminants is higher during the dry season. Rainfall data from SCB22 showed that rainfall in Semarang in April, June, and September was 131, 134, and 199 mm, respectively. Although rainfall differed between the study periods, the analysis showed that river discharge did not differ among stations or sampling times. Therefore, the pollution load between the stations and sampling times was caused only by differences in pollutant concentrations.
Contaminants with pollution loads exceeding their assimilation capacity were generally total dissolved solids (TDS), Cd, Cr, and Pb. The TDS and Pb pollution loads exceeded the assimilation capacity at all stations and times. The nitrate pollution load surpassed the assimilation capacity at Station 1 during sampling at 3. The Cd pollutant load exceeded the assimilation capacity at all stations and sampling times, except for station 1 and 2 during sampling 1. The Cr pollutant load surpassed the assimilation capacity at all stations and sample times, except for stations 1 and 2, during the second sampling period. The pollutant concentration is the load of pollution that exceeds the assimilation capacity because it exceeds the class 2 water quality standard for river waters.21 TDS and Pb concentrations exceeded quality standards at all stations and sampling times, indicating that the concentrations of these two pollutants in water bodies were high and stable. TDS refers to the quantity of organic and inorganic substances, including metals, minerals, salts, and ions, dissolved in a particular volume of water. Total dissolved solids originate from a range of natural and anthropogenic sources. Extraction of fossil fuels can produce wastewater with a high TDS level.23 TDS for fresh water is typically low, less than 500 mg/l.24
The Pb metal, which is higher than other metals, is thought to originate mainly from the combustion of mineral oil fuel and coal containing Pb metal. The population is quite dense in Semarang City and the surrounding districts, accompanied by daily mobility for various purposes, especially work, using vehicles that generally still use fuel in the form of pertalite (RON 90), pertamax (RON 95), and diesel. Dust from vehicle fumes and gases containing Pb can fall out and eventually accumulate in river waters and the sea. Pb is primarily emitted into the atmosphere by the combustion of fossil fuels. It can reach the Babon River directly from the air, as well as indirectly through rainfall runoff, soil surface erosion, and other land surface leaching by rainwater.25 Pb can also be found in batteries, children's toys, wall paint, and plastics.25 The usage of fertilizer in rice fields causes soil and rice to contain Pb and Cd elements.26Another source of Cd and Pb is domestic garbage.27
The input nitrate concentration was sufficiently high only at Station 1, therefore, the pollution load only exceeded the assimilation capacity at Station 1 at the 3rd sampling. It is suspected that the high nitrate levels are due to agricultural and household activities in the upper reaches of the river. Discharges of nutrients from urban and agricultural activities have led to elevated nitrate concentrations in freshwater environments.28 Chemical fertilizers are the primary source of river nitrate in agricultural areas.29 During intense rainfall, additional flushing of soil organic nitrogen and fertilizer from cultivated land into rivers occurs.30 Station 1 is located in Mluweh Village, East Ungaran District, Ungaran Regency. Approximately 10% of Mluweh villagers are farmers (Mluweh Village Government, 2020). Consumption of water containing high levels of nitrates reduces the capacity of blood to bind oxygen, especially in infants younger than five months of age. This condition is known as methemoglobinemia or blue baby disease, which results in bluish baby skin31, nitrate can reduce activity levels32, and decrease reproductive outputs.31,32 Nitrate also causes significant disruptions to oxygen delivery mechanisms (e.g., affecting haemoglobin concentrations).33
The concentrations of Cd and Cr were extremely high at stations 3-7. Stations 3 (Sendangmulyo Dalam, Kelurahan Sendangmulyo), 4 (Klipang, Kelurahan Sendangmulyo, Tembalang), 5 (Kelurahan Penggaron Kidul, Pedurungan), 6 (Kelurahan Penggaron Lor, Genuk), and 7 (Kelurahan Trimulyo, Genuk) are populated villages with the potential to be a source of Cd and Cr metals from household activities such as the use of battery stones, batteries, metal plating using Cd and/or Cr, and the use of Cr in tanning leather in household industries. Cd enters the environment via both natural and manmade sources.34 Pb enters the aquatic environment directly or through air intermediaries as a result of smelting or refining Pb, burning fuels with Pb additions, smelting other metals, and burning coal or oil. Human exposure to lead occurs by ingestion or inhalation of polluted dust, air, and food; however, broad prohibitions on lead gasoline and paint and better food safety minimize these exposures.35 Most environmental chromium (Cr) discharges originate from industrial activities, particularly chemical and mineral processing, steel and metal manufacturing, metal plating, leather tanning, textile dyeing, electroplating, cement production, metallurgical, and other industries.36,37 Cr is primarily derived from tanning waste38 and tanning activities by villages along the Babon River.39
TSS, phosphate, and total phosphate pollutants always have a pollution load lower than the assimilation capacity because their concentrations are still below the quality standards. TSS is thought to originate from soil surface erosion due to agricultural land clearing activities, riverwall landslides, and land clearing for housing purposes, whereas phosphate and total phosphate are thought to originate from agricultural and household activities.
The lowest water pollution index was found at Station 2 (3.884) and the highest index was found at Station 5.39. The value of this index suggests that the Babon River is polluted at mild-to-moderate levels from upstream to downstream regions. The concentrations of several variables measured in the water exceeded the river water quality criteria of classes 1 and 2 (the lowest quality standard values), whereas some were still below the highest concentration of quality standards (classes 3 and 4).
Analysis of the pollution load received by the Babon River water body compared to the assimilation capacity of the river water showed that some of its load variables exceeded the assimilation capacity, thus potentially causing pollution in the river.
Compared to other rivers in Semarang City, such as the Bringin River and West Banjir Kanal, the pollution level of the Babon River is still low because the sources of pollution of the Babon River are generally household activities, agriculture, and plantations.16,17 The two rivers mentioned earlier receive the burden of pollutants from industrial activities.
Conclusion
The Babon River discharge at the time of the study was relatively the same at all sampling locations and times; therefore, the pollution load was determined only by the input concentrations of pollutants. The pollution load of the Babon River exceeded the assimilation capacity for variable TSS, nitrate, and metals Cd, Cr, and Pb, while for TSS, phosphate, and total phosphate, the pollution load was still in accordance with the river’s assimilation capacity. The water pollution index of the Babon River ranged from 3.884 to 5.395, indicating that the Babon River, from upstream to downstream, was polluted at mild-to-moderate levels.
Acknowledgement
We would like to express our sincere gratitude to all parties who contributed to this research. I extend my deepest gratitude to the Dean of the Faculty of Fisheries and Marine Sciences, Diponegoro University, my colleagues and friends for their valuable discussions, and to the research participants for their contributions and support throughout this study.
Funding Sources
The author received funding for this research through a 2021 Output-Based Research Grant Contract Number 62/UN7.5.10.2/ PP/2021 from the Faculty of Fisheries and Marine Sciences of Diponegoro University
Conflict of Interest
The authors do not have any conflict of interest.
Data Availability Statement
This statement does not apply to the present study.
Ethics Statement
This study did not involve human or animal subjects and, therefore, did not require ethical approval.
Informed Consent Statement
This study did not involve human participants, and therefore, informed consent was not required.
Permission to reproduce material from other sources
Not Applicable
Author Contributions
Haeruddin: Conceptualization, methodology, writing draft preparation
Arif Rahman: Analysis, writing original draft preparation
Kukuh Prakoso: Formal analysis
Diani Estining Tyas: Writing review and editing
References
- Adinugroho M, Subiyanto, Haeruddin. Composition and distribution of plankton in the waters of Semarang Bay. Journal of Science. 2014; 16 (2): 1-10 [Indonesian].http://download.garuda.kemdikbud.go.id/article.php?article=1306822&val=524&title=DISTRIBUSI%20KELIMPAHAN% 20DAN%20KEANEK ARAGAMAN%20ZOOPLANKTON%20DI%20PERAIRAN%20PESISIR%20YAPEN%20TIMUR%20PAPUA
- Maslukah L, Ismunarti DC, Widada S, Sandi NF, Prayitno HB. The Interaction of Chlorophyll-a and Total Suspended Matter along the Western Semarang Bay, Indonesia, Based on Measurements and Retrieval of Sentinel 3. Journal of Ecological Engineering. 2022; 23(10), 191–201 https://doi.org/10.12911/22998993/ 152428
CrossRef - Suprapto D, Latifah N, Suryanti S. Spatial distribution of heavy metal content in the water and green mussel (Perna viridis) in Semarang Bay, Indonesia. AACL Bioflux, 2021: 14(1): 298-308. https://bioflux.com.ro/docs/2021.298-308.pdf
- Ministry of Marine Affairs and Fisheries (MMAF). Final Report on Pollution Profile Preparation (Semarang City Coast). 2015. Directorate General of Marine, Coastal and Small Islands, Working Unit of the Directorate of Coastal and Marine. https://core.ac.uk/display/11705675 [Indonesian]
- Hastuti Y. Land use study of Semarang City, Babon watershed and its implications for water availability. 2002. Thesis. Master’s Program in Urban Development Engineering, Diponegoro University [Indonesia].
- Kurniawan T, Bisri M, Juwono PT, Suhartanto E, Sarastika T. Community Participation in River Conservation in the Babon River, Central Java. Journal of Hunan University Natural Sciences. 2021; 48(10): 500-512. https://www.jonuns.com/index.php/journal/ article/view/817/812
- https://www.policytracker.com/help/the-spectrum-database-population-density-tabs/)
- Agustatik S. Gradation of Babon River pollution with macrozoobenthos bioindicators.Thesis. Master’s Study in Environmental Science, Postgraduate Program, Diponegoro University, Semarang, Indonesia. 2010. https://123dok.Com/Document/ Q01kd1lz-Gradasi-Pencemaran-Bioindikator-Makrozoobentos-Diponegoro-University-Institutional-Repository.html. [Indonesian]
- Wahyudi RS, Wahyudi SI, Subagya PH. Water quality evaluation was used to assess the feasibility of a case study of the Babon River in Semarang, Central Java, Indonesia. IOP Conf. Series: Earth and Environmental Science 612 (2020) 012034 IOP Publishing. 2020. doi:10.1088/1755-1315/612/1/012034.
CrossRef - Sari TE. Sedimentation Study Using the MUSLE Model in the Babon Watershed, Central Java Province. Thesis, Semarang State University, Semarang, 2011. Available online at https://lib.unnes.ac.id/6836/1/ 7898.pdf
- Regional Public Company (Perumda) Tirta Moedal, Semarang City, Indonesia. History. 2018. Available online at https://www.pdamkotasmg.co.id/page/history, https://www.pdamkotasmg.co.id/page/instalasi_pengolahan_air) [Indonesian]
- Uddin AH, Khalid RS, Alaama M, Abdulkader AM, Kasmui Ar, Abbsa SA. Comparative study of three digestion methods for elemental analysis of traditional medicine products using atomic absorption spectrometry. Journal of Analytical Science and Technology. 2016; 6(7):1. https://doi.org/10.1186/s40543-016-0085-6
CrossRef - [NSA] National Standardization Agency. SNI 06-6989.9-2004: Water and wastewater – Part 79: Testing nitrates with cadmium-reduced UV-visible spectrophotometer. Available online at (http://sainstkim.teknik.ub.ac.id/wp-content/uploads/2016/12/SNI-6989-79-2011-Cara-uji-Nitrat-dengan-Spektrofotometer-UV-VIS-secara-reduksi-kadmium.pdf) [Indonesian].
- [NSA] National Standardization Agency (NSA). Water and Wastewater – Part 31: Testing Phosphate Levels Using an Ascorbic Acid Spectrophotometer. SNI 06-6989.31-2005, 1– 10 [Indonesian]. https://pesta.bsn.go.id/produk/by_ics/2?key=&ics_no=13.060.50
- American Public Health Association [APHA], American Water Works Association [AWWA], and Water Environment Federation [WEF]. Standard Methods for the Examination of Water and Wastewater. 2017. 23rd Edition, American Public Health Association, American Water Works Association, Water Environment Federation, Denver.
- Haeruddin, Pujiono WP, Sigit F. Pollution Load, Assimilation Capacity and Pollution Status of the West Canal Flood Estuary, Semarang City, Central Java.Journal of Natural Resources and Environmental Management. 2019; 9(3): 723-735. http://dx.doi.org/10.29244/ jpsl.9.3.723-735. [Indonesian]
CrossRef - Yuliati Y, Sumiarsih E, Efawani E, Mulyani I, Fahreza MI. Pollution Load On Tide Conditions in Air Hitam River, Pekanbaru City, Riau Province. IOP Conf. Series: Earth and Environmental Science 1118 (2022) 012046 IOP Publishing doi:10.1088/1755-1315/1118/1/012046
CrossRef - [LASNTG] Local Authority Services National Training Group. Discharges to Surface Waters: Guidance for the Applicant.Monastery Road, Roscrea, County Tipperary, Munster Province, Ireland. 2011.
- State Ministry of Environment (SME). Decree of the Minister of Environment (KEPMEN) Number 115 of 2003: Guidelines for Determining Water Quality Status. 2003 Available online at https://luk.staff.ugm.ac.id/atur/sda/KepmenLH115-2003StatusMutuAir.pdf [Indonesian]
- Secretariat of State. Annex to Government Regulation Number 22 of 2021, concerning the National Water Quality Standards. 2021. [Indonesian]
- Statistical Central Bureau (SCB), Semarang.Semarang City Rainfall (mm) 2020 – 2022. 2023. Available online at :https://semarangkota.bps.go.id/indicator/ 151/79/1/ curah-hujan-kota-semarang.html [Indonesian]
- Wilson J, Yuxin W. Sources of High TDS in Drinking Water Supply in Southwestern Pennsylvania. Journal of Environmental Engineering. 2013;140(5), DOI:10.1061/(ASCE)EE.1943-7870.0000733
CrossRef - Moran S. Applied Guide to Water and Effluent Treatment Plant Design. Elsevier Inc. 2018.
CrossRef - Le Roux G, Vleeschouwer FD, Weiss D, Masson O, Pinelli E, Shotyk W. Learning from the Past: Fires, Architecture, and Environmental Lead Emissions. Environ. Sci. Technol. 2019; 53:8482?8484. http://dx.doi.org/10.1021/acs.est.9b03869. Available on-line on http://pubs.acs.org/action/showCitFormats?doi=10.1021/ acs.est.9b03869.
CrossRef - Lamondo D, Soegianto A, Abadi A, Keman S. Antioxidant effects of ant nests (Myrmecodia pendans) on the apoptosis of spermatogenic cells of rats exposed to plumbum. J Pharm Biol Chem Sc.i 2015; 5(4):1-14. https://www.researchgate.net/publication/ 264936115_Antioxidant_Effects_of_Sarang_Semut_Myrmecodia_ pendans_ on_the_Apoptosis_of_Spermatogenic_Cells_of_Rats_Exposed_to_Plumbum
- Sukarjo, Hidayah A, Zulaehah I. Effect of fertilizer on the accumulation and translocation of Cd and Pb in soil and plants. National Seminar on Biology and Science Education III. 2018. [Indonesian]
- Eshmat ME, Mahasri G, Rahardja BS. Analysis of lead (Pb) and cadmium (Cd) content in green shells (Perna viridis L.) in Ngemboh Waters in the Gresik District of East Java. Fish Mar Sci J. 2014; 6 (1): 101-108. DOI: 10.20473/jipk.v6i1.11387. [Indonesian]
CrossRef - Daniel F, Isaza G, Cramp RL, Franklin CE. Living in polluted waters: A meta-analysis of the effects of nitrate and its interactions with other environmental stressors on freshwater taxa. Environmental Pollution. 2020; 261: 114091. https://www.sciencedirect.com/science/article/abs/pii/S0269749119348936
CrossRef - Zhao Y, Zheng B, Jia H, Chen Z. Determination of sources of nitrates into the Three Gorges Reservoir using nitrogen and oxygen isotopes. Sci. Total Environ. 2019; 687: 128–136. https://www.sciencedirect.com/science/article/abs/pii/S0048969719326415
CrossRef - Li C, Li S, Yue F, et al. Identification of sources and transformations of nitrate in the Xijiang River using nitrate isotopes and Bayesian Model. Sci. Total Environ. 2019; 646: 801–810. https://www.sciencedirect.com/science/article/abs/pii/S0048969718328407
CrossRef - Effendi H. Water quality study: for managing aquatic resources and environment. Publisher: Kanisius. Yogyakarta. 2003. (in Indonesia)
- Alonso A, Camargo JA. Nitrate causes deleterious effects on the behavior and reproduction of the aquatic snail Potamopyrgus antipodarum (Hydrobiidae, Mollusca). Environmental Science and Pollution Research. 2013; 20(8). https://link.springer.com/article/10.1007/s11356-013-1544-x
CrossRef - Soucek DJ, Dickinson A. Influence of chloride on the chronic toxicity of sodium nitrate to Ceriodaphnia dubia and Hyalella Azteca. Ecotoxicology. 2016; 25:1406-1416. https://pubmed.ncbi.nlm.nih.gov/27386878/
CrossRef - Monsees H, Klatt L, Kloas W, Wuertz S. Chronic exposure to nitrate significantly reduces growth and affects the health status of juvenile Nile tilapia (Oreochromis niloticus L.) in recirculating aquaculture systems. Aquacult. Res.,2017; 48:3482-3492. https://onlinelibrary.wiley.com/doi/abs/10.1111/are.13174
CrossRef - Mahmood Q, Asif M, Shaheen S, Hayat MT, Ali S. Cadmium Toxicity and tolerance in plants from physiology to remediation. 2019; p:141-161. Academic Press
CrossRef - Fisher MB, Amy Z, Guo J, et al. Occurrence of lead and other toxic metals in drinking-water systems in three West African Countries. Environmental Health Perspectives. 2021; 129(4):1-11. https://ehp.niehs.nih.gov/doi/full/10.1289/EHP7804
CrossRef - Nakkeeran E, Patra C, Shahnaz T, Rangabhashiyam S, Selvaraju N. Continuous biosorption assessment for the removal of hexavalent chromium from aqueous solutions using Strychnos nux vomica fruit shell. Bioresour. Technol. Rep. 2018. 3:256-260. https://www.sciencedirect.com/science/article/abs/pii/ S2589014X18300884
CrossRef - Lian G, Wang B, Lee X, Li L, Liu T, Lyu W. Enhanced removal of hexavalent chromium by engineered biochar composite fabricated from phosphogypsum and distiller’s grains. Sci.Total Environ. 2019; 697:134119. https://www.sciencedirect.com/science/article/abs/pii/S0048969719340963
CrossRef


