Study of heavy metals in river water of Satna region
K.B.L. Shrivastava1 * , S.K. Pandey2 and B.P. Singh3
http://dx.doi.org/10.12944/CWE.3.2.15
Water pollution has become one of the major threat to human health. The safe drinking water is now globally one of the most serious challenges.Vast industrialization, uses of insecticides and pesticides and vast use of fertilizers to meet the need of food of exponential growth in population is responsible to change physico-chemical characteristics of water. Water is vital for life, it should be clear, colourless, odourless and should not have any suspended particles as well as harmful and toxic chemical substances. The main aim of this study is to find out the concentration of different heavy metals in the water of Satna region on paying proper attention on the availability of mineral resources in this region. Crosssection survey of different scaled industries to recognize their discharged wastage is also considred at the root level.
Copy the following to cite this article:
Shrivastava K.B.L, Pandey S.K, Singh B.P. Study of heavy metals in river water of Satna region. Curr World Environ 2008;3(2):297-300 DOI:http://dx.doi.org/10.12944/CWE.3.2.15
Copy the following to cite this URL:
Shrivastava K.B.L, Pandey S.K, Singh B.P. Study of heavy metals in river water of Satna region. Curr World Environ 2008;3(2):297-300. Available from:http://www.cwejournal.org/?p=849
Download article (pdf)
Citation Manager
Publish History
Introduction
Satna is a district of M.P. in India. It is situated in eastern part of the state. It abounds in natural resources like lime stone, latterite and silica sand i.e. silicates. Due to the availability of different kinds of industries, main among them are cement factories and lime kilns and due to industrial activities and uncontrollable use of insecticides, pesticides and fertilizers the water pollution has become a threat in this region.
The present paper has the target to give data base informations of heavy metals found in water of this region. For this purpose valuable help from P.H.E. Department, Water pollution control authority and Communication and Capacity development unit is availed. The test of different heavy metals are done using the method furnished by this unit.
Tamas is the most important river of satna region, and hundred of villages are contaminating the river by waste water per day (Khan, et al., 1998). Among the inorganic contaminants of the river water, heavy metals are getting importance for their non-degradable nature and often accumulate through tropic level causing a deleterious biological effect (Jain, 1978). Anthropogenic activities like mining, ultimate disposal of treated and untreated waste effluents containing toxic metals as well as metal chelates (Amman, et al. ,2002) from different industries based on use of batteries, paints, ceramics,electroplating,utensils manufacturing etc are incorporating heavy metals in river water.Mandakini and Paisuni rivers are basically receive heavy metals from effluents coming from temple washings and worshiping, also the indiscriminate use of heavy metal containing fertilizers and pesticides in agriculture resulted in deterioration of water quality rendering serious environmental problems posing threat on human.
The area under study receives domestic raw sewage from surrounding habitation; so also the activity like cattle washing, cloth washing, bathing, religious activities like idol immersion etc. paves the way for high concentration of harmful chemicals in the river water. So it is vital to study the heavy metals of this (SATNA) region to find a safeguard instruction regarding health of human and crops production.
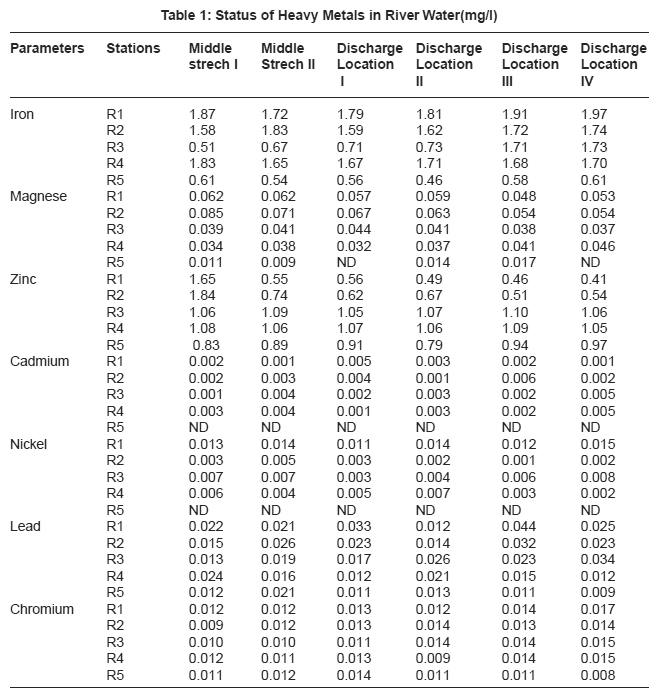 |
Table 1: Status of Heavy Metals in River Water(mg/l) Click here to view table |
Material and Methods
Water samples were collected once in every month during April 2007 to March 2008 from two sites one from the middle strech of the river and four other discharge receiving points of the rivers Tamas, Kariyari, Satna river, Mandakini river and Paysuni river over a strech of 20 kms.
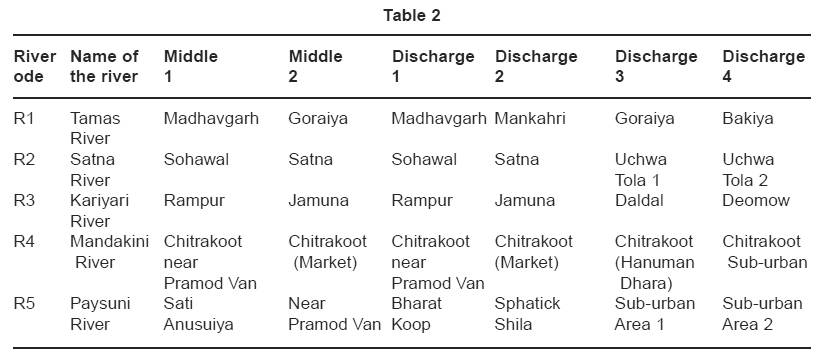 |
Table 2 Click here to view table |
The samples were collected from a depth of 1ft below the surface using Nansen type water sampler and kept in polythene containers (500 mL) with the addition of 2 mL concentrated HNO3 at 2 mL in order to preserve the metals and also to avoid precipitation. The pH of water samples was determined using pH-meter with electronic glass electrode (LI 127 of Elico, India) and conductivity was measured by conductivity-meter (Systronics 304).
 |
Figure 1: Mean concentration of Fe in river water Click here to view figure |
For the analysis of total heavy metals (dissolved and suspended), water (200 mL) samples were digested with 5 mL of di-acid mixture (HNO3: HClO4 :: 9: 4 ratio) on a hot plate and filtered by Whatman No. 42 filter paper and made up the volume to 50 mL by double distilled water for analysis of seven heavy metals viz. Fe, Mn, Zn, Pb,Cd,Cr and Ni using atomic absorption spectrophotometer (GBC-902, Australia) (APHA, 1995) Among the methods available for the determination of Manganese, the Persulphate method is the best suited and is applicable to all types of water. The soluble manganese compounds are oxidized to Permanganate by Persulphate in Acid solutions. The resulting colour of the Permanganate solution is measured spectrophotometrically at 545 nm. Cadmium ions react with Dithiozone to from a pink-red colour. The colour so formed is extracted with Choloroform and can be determined spectrophotometrically at 518 nm. For the detection of iron, all the Iron is converted into Ferrous state by boiling with Hydrochloric Acid and Hydroxyl Amine. The reduced Iron Chelates with 1, 10-Phenonthroline at a pH 3.2 to 3.3 to form a complex of orange red colour. The intensity of this colour is proportional to the concentration of Iron and follows Beer’s law, and therefore, can be determined colorimetrically at 510 nm. Chromium is spectrophotometrically estimated by measuring the intensity of yellow coloured sodium chromate solution For the assessment of Lead, it is made to react with Dithizone at a pH of about 11.5 to form Lead Dithizone which is soluble in Chloroform. In the presence of an Alkaline Cyanide solution, the free green coloured Dithizone is not extracted by Chloroform. The interference from Bismuth and Tin is eliminated by preliminary treatment of the sample with Dithizone at a pH about 2 to 3. Zinc reacts with Dithizone (Diphenyl Thiocarbazone) to form a coordinate compound which when extracted into Carbon Tetrachloride is red in colour and is used to measure the Zinc content.
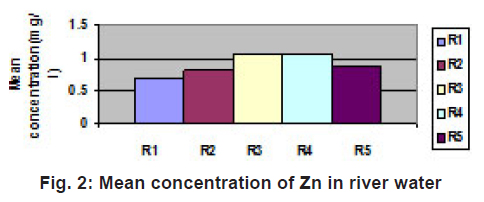 |
Figure 2: Mean concentration of Zn in river water Click here to view figure |
Results and Discussion
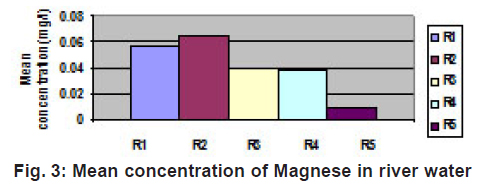 |
Figure 3: Mean concentration of Magnese in river water Click here to view figure |
Cd concentration in this region is very less. Its minute concentration in the water of this region may be due to paint-pigments as well as plastics and silver cadmium batteries. Its accumulation may also be possible due to its photographic use as cadmium bromide and iodide as well as its use as fertilizers. The W.H.O. permissible limit of cadmium is 0.01gm/l, suggesting concentration of cadmium is within the permissible limit. Accumulation of nickel may be owing to nickel storage batteries used abundantly. Nickel and its salts are used in several industrial applications such as in electroplating, storage batteries, automobile parts, spark plugs, electrodes, cooking utensils and in pigments paints and cosmetics. As a result its accumulation in water becomes possible. The concentration of nickel in the water of this region is also within the permissible limit of water quality standards of India( 1975). Although no any metal except iron and zinc are crossing the W.H.O. and BIS parameters but their presence in traces suggest to take proper precautions before using this water in domestic purpose. Concentration of Mn is 0.5 ppm as per water quality standards (India). Mn concentration is also within the limit and its accumulation in the water of this region is due to use of dry battery cells, iron alloys, glass, ceramics and fertilizers. Chromium accumulation in the water of this region may be owing to using Cr as corrosion inhibitor in photography and in manufacture of green varnishes and paints etc. Chrome steel disposal may also be a cause of it. The concentration of zinc in this region may be due to manufacture of bronze and brass in Unchehara Satna as well as its use as fertilizers, pesticides and fungicides and as Zn batteries. Latterite ores of iron are the main cause of iron concentration in this region. Traces of lead may be due to application in alloys, lead pipes, lead arsenate as pesticide as well as its use in pigments, paints and as lead storage batteries.
Thus it can be concluded that traces of heavy metals are mainly in the river R1 (Tamas) which receives sewage from Maihar, Unchehara and Satna which have increasing industrial activities. Trace element concentration in river R2, R3, R4 and R5 is due to agricultural and domestic activities.
References
-
Silva M.A. , Mater L., Souza-Sierra M.M., Correa A.X., Sperb R. and Radetski C.M.,J.Hazard mater., (2007) 147: 986.
-
S. Mansoor, Munir H. Shah, N. Shahin, A.Khalique, M.Jaffar. Journal of hazardous material. A (2006) 137: 31-37.
-
BIS: 10500: Drinking water specification, first revision, Bureau of Indian standards New Delhi (1991)
-
Baruah,B.K. Water quality Ponds in Chandrapur area of Kamarup distt. Assam Environ. Ecology Vol. (1998) 16(2): 254-256.
-
Mishra Sanjay Some studies on water pollution due to mining activities around mining areas of Sahdol (M.P.) (2001).
-
Impact of agricultural modernization on socio-economic status of farmers of Satna Distt. by Sashank Lenka & A.Das Indian Journal of soil conservation, (2003) 20(3).
-
Kumar A. Saxena, K.K. and Chauhan S., study of physico chemical characteristics of river Jamuna in distt. Auraiya (U.P.), Him. J. Env Zool. (2004) 18(1): 85-88.
-
Pandey B.N., Lal R.N., Mishra P.K. and Jha A.K., seasonal rhythm in the physico-chemical properties of Mahananda River, Katihar (Bihar). Env. and Ecol., (1992) 10(2): 354-357.
-
M.B. Ubale, Faroqqui Mazber, Arif Pathan, Mo. Zahir Ahmed, Dhule D.G. Oriental Jounal Chemistry., (2001) 17(2): 347-348.
-
Prasanna Kumari, A.A. Gangadevi,T. and Sukesh Kumar, C.P., Surface water quality of River Neyyar, Thiruvananthapuram, Kerala (India) Poll. Research, (2003) 22(4): 515-525.
-
Sanap R.R., Mohite A.K., Pingle S.D. , Gunale V.R., Evaluation of water qualities of Godavari River with reference to physico-chemical parameters, Distt. Nasik (M.S.) India Poll. Res. (2006) 25(4): 775-778.
-
Singh S.K. and Rai J.P.N., Pollution studies of River Ganga in Allahabad Distt., Poll. Res. (2003) 22(4): 469-472.


