Physico-chemical study of Chambal river water in Dholpur (Rajasthan)
P.S. Tiwari1 * and M.K. Singh1
1
Department of Chemistry,
Government P.G. College,
Dholpur,
India
http://dx.doi.org/10.12944/CWE.3.2.13
This study was carried out in each season for one year, deals with the assessement of physico-chemical parameters of chambal river water in Dholpur district. The samples were tested for their temperature, pH, electrical conductivity, turbidity, hardness, BOD, COD, dissolved oxygen, sulphate, chloride, calcium and magnesium indicating the deteriorating life sustaining capacities of the river due to domestic and industrial pollution
Copy the following to cite this article:
Tiwari P.S, Singh M.K. Physico-chemical study of Chambal river water in Dholpur (Rajasthan). Curr World Environ 2008;3(2):289-292 DOI:http://dx.doi.org/10.12944/CWE.3.2.13
Copy the following to cite this URL:
Tiwari P.S, Singh M.K. Physico-chemical study of Chambal river water in Dholpur (Rajasthan). Curr World Environ 2008;3(2):289-292. Available from: http://www.cwejournal.org/?p=845
Download article (pdf)
Citation Manager
Publish History
Introduction
Water is a vital component of the environment which sustains life on earth. The rapid pace of industrialization, urbanization, agricultural activities and population growth have made all the sources of water either polluted or contaminated globally. Release of treated and untreated industrial effluents in an unplanned manner is one of the major causes of water pollution. Almost 70% of water in India has become polluted due to the discharges of domestic sewages, detergents and industrial effluents into natural water resources1 e.g. rivers, lakes etc.
Chambal, the principal tributary of river Yamuna and the most important river of the Malwa plateau, originates from Janapao hill in M.P, enters Bundi, Kota and then Dholpur districts of Rajasthan and unite with Yamuna, 38 km away from Etawah in U.P. As chambal river flows from different areas of dholpur district, it becomes polluted due to which BOD in the river often rises to 9-14 mg/litre. Roughly 70 mld. of munciple waste is also dumped in chambal river from different areas situated on its bank in Dholpur district. The large population of coastal area of this river is totally dependent on its water. Therefore, it is necessary to assess water quality of Chambal river water at upstream site A (Highway) and downstream site D (near Railway bridge).
In the present observation, water quality with reference to physico-chemical parameters have been assessed at a specific stretch of the water length (approx. 10 kms.) of chambal river. The study has been conducted at the following four sites :
-
National Highway (Upstream)
-
Shamshan Ghat
-
Shergarh Fort
-
Near Railway Bridge (Downstream)
Experimental
Water samples for the present investigation were collected from all four experimental sites of the chambal river in Dholpur each after three months interval from October 2005 to July 2006. They were analysed for physico-chemical parameters like temperature, turbidity, electrical flow conductivity (EC), hardness, pH , Biochemical Oxygen Demand (BOD),Chemical Oxygen Demand (COD), Dissolved Oxygen(DO), sulphate, phosphate, chloride, calcium and magnesium as per standard procedures described in APHA.2,3 All chemicals used were of AR grade . Double distilled water was used for preparation of reagents.The different methods used for physico-chemical analysis of Chambal river water are summarized in Table 1.
Results and Discussion
The results of physico-chemical analysis of Chambal river water samples of Dholpur district are given in Table-2. The temperature of the sample was noted at the sample site during collection and is more important for its effect on the chemistry and biology of organisms in water. The temperature of the water samples ranged from 150C to 320C. All the water samples were colourless, odourless and tasteless.
The observed pH values ranging from 7.10 to 7.96 showed that the water samples are slightly alkaline. These values are within highest desirable limit, which is safe range of drinking and growth of plants,4 as prescribed by WHO. Beyond pH 8.5, the water becomes bitter in taste.
A non significant increase in hardness has been observed in July 2006 i.e rainy season due to dilution of the river but a significant increase in hardness from Oct.2005 to April 2006 may be accounted for reduced availability of chambal water and of untreated sewage in the river.In all the water samples collected, the hardness ranges from 83 to 190 mgL-1. According to some classification, water having hardness upto 75 mgL-1 is classified as soft,76-150 mgL-1 is moderately soft, 151-300 mg/ L as hard and more than 300 mgL-1 as very hard.5 The total hardness above permissible limit causes health hazards and becomes unfit for domestic as well as industrial purposes.
Turbidity ranges from 15.0 to 36.0 NTU. Higher values of turbidity are due to higher concentration of suspended solid particles which decreases the water flow velocity.
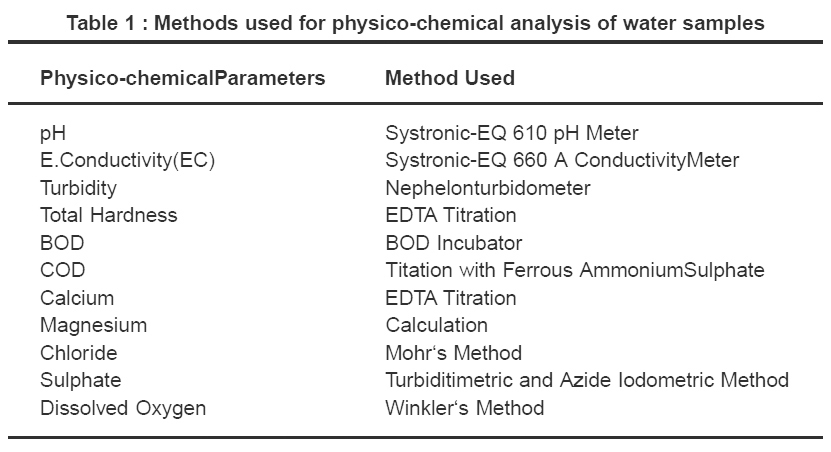 |
Table 1 : Methods used for physico-chemical analysis of water samples Click here to view table |
As electrical flow conductivity depends on the presence of ions and their total concentration, a non significant increase in conductivity from July 2006 is due to dilution factor whereas a significant rise in it from Oct 2005to April 2006 is due to low level of chambal water. Electrical conductivity ranges between 0.820 to 0.951 Mhoscm-1 for all seasons. The importance of EC is its measure of salinity, which greatly affects the taste and thus has a significant impact on the uses, acceptance of water as potable.6
BOD is the oxygen demand of any system, required for stabilization under biological condition. The value of BOD and COD significantly increases in July 2006 (rainy season) due to influx of more water in the river. Further, a significant increase in BOD and COD from Oct 2005 to April 2006 at downstream site D as compared to upstream site A is due to washing, cattle bathing and domestic sewage of the city. Chemical oxygen demand test allows measurement of a waste in terms of the total quantity of oxygen required for oxidation to carbon dioxide and water.7 In this context, COD analysis in surface waters can give the indication of the degree of pollution from municipal or industrial wastewaters. Increasing trends in COD at most of the sites indicate that more wastewaters, treated, untreated or partially treated have been discharged to Chambal river due to population increase and industrial development in the basin.
The values of DO decreases and BOD increases which indicates the rise in organic pollution due to addition of wastes in water. These organic matter undergo degradation by microbial activities in presence of DO, thus decreasing it and increasing BOD.
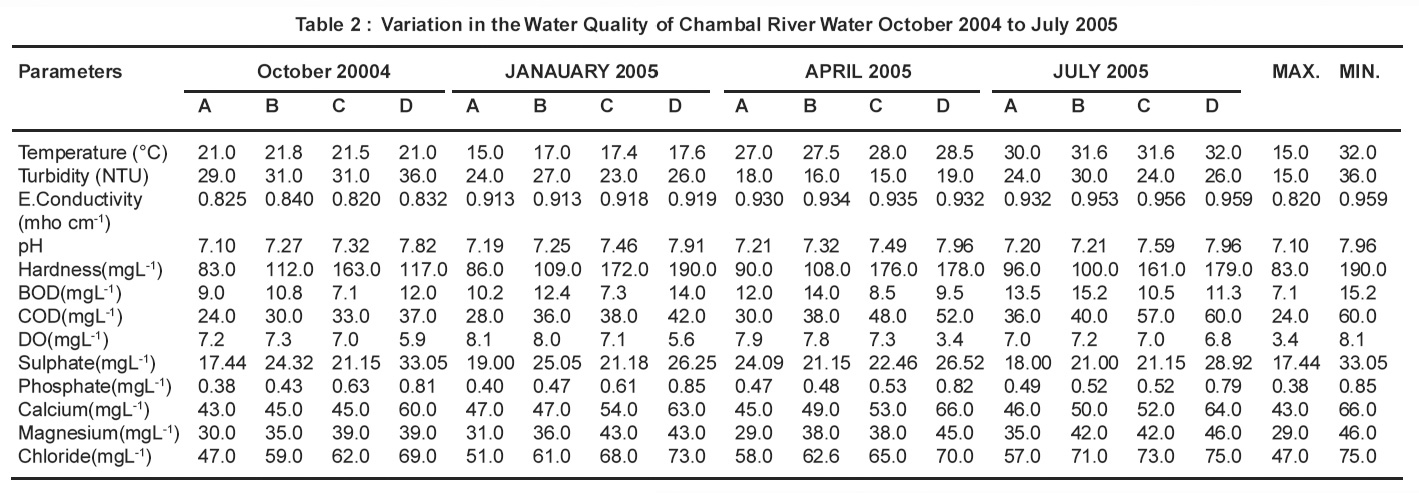 |
Table 2 : Variation in the Water Quality of Chambal River Water October 2004 to July 2005 Click here to view table |
The BOD and COD values in chambal river is increased due to addition of sewage, small scale industries wastes and rich amount of microbes, discharging their toxic effluents.
Concentration of Sulphate in all the water samples ranged from 17.44 to 33.05 mgL-1. It is within the highest desirable limit prescribed by WHO. Sulphate arises from atmospheric deposition of oceanic aerosols and the leaching of sulphate compounds from sedimentary rocks and industrial discharges. Atmospheric precipitation can also add significant amounts of sulphate to surface waters.8
Present investigation shows the concentration of Calcium in the water samples ranging from 43 to 66 mgL-1. The water above Calcium value 25 mgL-1 is specified as Cacium rich.9 Thus , the Chambal river water is Calcium rich. Calcium is present in all waters as Ca2+ and is readily dissolved from rocks rich in calcium minerals, particularily as carbonates and sulphates, especially limestone and gypsum. The cation is abundant in surface and groundwaters. Industrial as well as water and wastewater treatment processes also contribute calcium to surface waters.8
The observed values of Magnesium were between 29 to 46 mgL-1 -maximum in the month of July i.e. Rainy season. Results of present investigation shows that the magnesium content in majority of samples does not exceed the limit as prescribed by WHO. Magnesium is common in natural waters as Mg2+ and along with calcium is a main contributor to hardness. Magnesium arises mainly from the weathering of rocks containing ferromagnesium minerals and from some carbonate rocks. Although magnesium is used in many industrial processes, these contribute relatively little to the total magnesium in surface waters.8
In the present study , Chlorine in water samples ranged from 47 to 75 mgL-1 being minimum in October and maximum in Rainy season . According to WHO,10 the maximum permissible limit for Chlorine is 500 mgL-1 and since the values observed in present study are well below this level , it has not imported the taste to water. It was also found that Chlorine ion concentration bear a conjugate relationship with mineral contents of the respective water samples as Chloride contents increases with increasing mineral.11 Chloride enters surface waters with atmospheric deposition of oceanic aerosols, with the weathering of some sedimentary rocks and from industrial and municipal effluents and agricultural and road run-off . As chloride is frequently associated with sewage, it is often incorporated into assessments as an indication of possible faecal contamination or as a measure of the extent of the dispersion of sewage discharge in water bodies.8
Conclusion
This study shows that all the physico-chemical parameters fall within the permissible limit as per standards. The quality of water is safe for domestic and irrigation purposes. Significant increasing trends in COD values at most of the sites suggest that water quality of Chambal river has been deteriorated in terms of organic pollution from industries and from residential areas in the period during which data were obtained. The results of this study will be expected not only to provide public with the recent changes quantitavely in water quality of Chambal river but also to help establish future surface water quality management strategies in the basin.
References
-
Radhakrishnan, R. Dharamaraj, K and Ranjithakumari ., J of Environmental Biology., (2007) 28(1): 105-108.
-
APHA, Standard methods for the examination of water and wastewater, Washington DC edn 18 (1992).
-
Trivedi, R. K. and Goel, P. K., Chemical and Biological methods for water pollution studies, Environmental Publication, Karad (India) (1986).
-
Weber, W. J. Jr. and Stun, W., Mechanism of hydrogen ion buffering in natural water, J American Water Works Association., (1963) 55: 1553.
-
Twort, A. C. Hoather, R. C. and Law, F. M., Water Supply, Edward Ornold Pub. Ltd., London (1974).
-
Srinivas, C. H. Ravishankar, P.Venkateshwar, C.Rao, Satyanarayana M.S. and Reddy,R.R., Studies of ground water quality of Hyderabad, Poll Res. (2000) 19(2): 285-289.
-
Sawyer,C.N. and McCarty, P.L., Chemistry for Environmental Engineering, McGraw Hill Book Company , Singapore (1985).
-
Chapman, D.and Kimstach, V., Selection of Water Quality Variables, Water Quality Assessments : A Guide to the Use of Biota, Sediments and water in Environmental Monitoring, Taylor and Francis, New York, pp (1998) 59-126.
-
Ohle, W., Bioactivity production and energy utilization of lakes, Limnal and Ocenog., (1956) 1: 139-149.
-
WHO ., Guidline for drinking water quality , vol.1, recommendation, World Health Organisation, Geneva (1994).
-
Mohapatra, T. and Purohit, K. M., Ecology of Polluted Waters , APH Pub.Co. New Delhi (2002) 1: 145.


