Physico-chemical investigation and correlation analysis of water quality of Upper Lake of Bhopal, M.P., (India)
Kriti Shrivastava1 * and Smita Joshi1
1
S.N.G.G.P.G. College,
Shivaji Nagar,
Bhopal,
Madhya Pradesh
India
http://dx.doi.org/10.12944/CWE.3.2.22
Upper lake is major source of water for Bhopal city, but over the years, the quality of lake water has deteriorated due to inflows of waste and sewage. The present study was undertaken to characterize the physico-chemical parameters of water samples from Prempura site of the Upper Lake in Bhopal city during summer season (2005). Evaluation of physico-chemical parameters was carried out. To assess the quality of water, each parameter was compared with the standard desirable limit of that parameter in drinking water as prescribed by different agencies. A systematic calculation was made to determine the correlation coefficient ‘r’ amongst the parameters and the strength of relationship is measured by the coefficient of determination ‘r2’. Then these values were interpreted in terms of interdependence of water quality parameters on each other.
Copy the following to cite this article:
Shrivastava K, Joshi S. Physico-chemical investigation and correlation analysis of water quality of Upper Lake of Bhopal, M.P., (India). Curr World Environ 2008;3(2):327-330 DOI:http://dx.doi.org/10.12944/CWE.3.2.22
Copy the following to cite this URL:
Shrivastava K, Joshi S. Physico-chemical investigation and correlation analysis of water quality of Upper Lake of Bhopal, M.P., (India). Curr World Environ 2008;3(2):327-330. Available from:http://www.cwejournal.org/?p=863
Download article (pdf)
Citation Manager
Publish History
Introduction
The Ministry of Environment and Forest (MOEF) has recognized the Upper and Lower lakes of Bhopal as Wetlands of national importance and designated them as "Bhoj Wetland" in 1988. Wetlands are facing serious threats due to human activities. Upper Lake is major source of water for Bhopal city. It contributes about 25 MGD water out of 55 MGD that Bhopal needs. But over the years, the quality of water has deteriorated due to inflow of waste and sewage. It is estimated that about 9.82 MGD of sewage water flows into upper lake through 14 drains of Bhopal [Bhoj Wetland Project, EPCO, BPL, 1999]. The major activities responsible for the wetland loss are urbanization, drainage for agriculture and water system regulation [IUCN, 1999].
A correlation analysis is a statistical procedure that evaluates the association between two sets of variables. The correlation coefficient r is a measure of the linear relationship between two attributes or columns of data. The value of r can range from -1 to +1 and is independent of the units of measurement. A value of 'r' near 0 indicates little correlation between attributes; a value near +1 or - 1 indicates a high level of correlation. When two attributes have a positive correlation coefficient, an increase in the value of one attribute indicates a likely increase in the value of the second attribute. A correlation coefficient of less than 0 indicates a negative correlation. That is, when one attribute shows an increase in value, the other attribute tends to show a decrease.
Experimental
Study Area and Collection of Samples
Water Samples were collected from Prempura site at the bank of Upper Lake, from middle layer at a distance of 0m, 10m, 20m, 30m and at a distance of more than 100m from aeration units. Water samples were collected in acid washed plastic cans of 5L capacity from lake. For estimation of DO, samples were collected in 250 ml glass bottles.
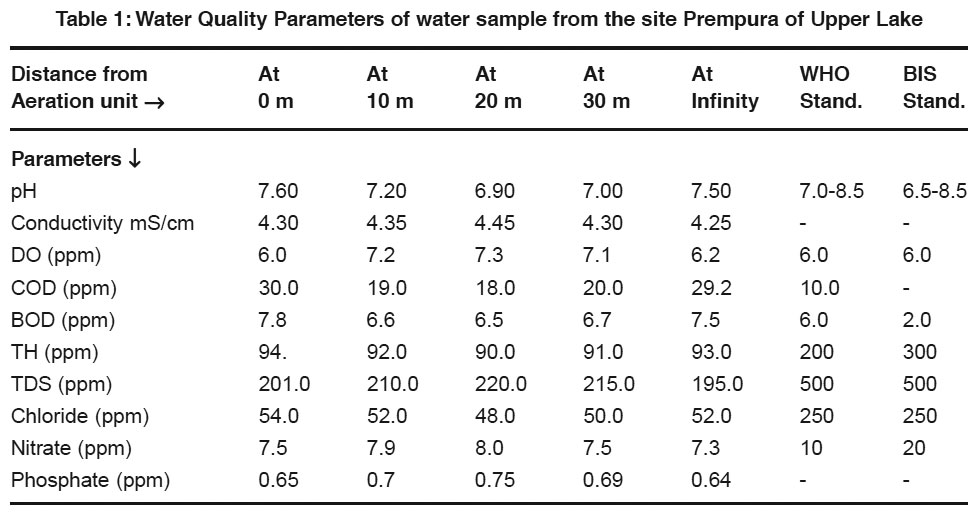 |
Table 1: Water Quality Parameters of water sample from the site Prempura of Upper Lake Click here to view table |
Determination of Water Quality Parameters
The Standard methods for the analysis of water was followed as prescribed in APHA (1995) and NEERI manual.
|
pH |
- |
pH meter |
|
Specific Conductivity |
- |
Conductivity meter |
|
DO |
- |
Winkler’s Method |
|
COD |
- |
Potassium dichromate Reflux Method |
|
BOD |
- |
Incubation Method |
|
Total Hardness |
- |
Titrimetric Method |
|
Total Dissolved Solids |
- |
TDS meter |
|
Chloride |
- |
Titrimetric Method |
|
Nitrate |
- |
Spectrophotometric Method |
|
Phosphate Method |
- |
Spectrophotometric |
Statistical Analysis
Karl Pearson’s measure known as Pearson’s Correlation Coefficient between two variables x and y, usually denoted as rxy is a numerical measure of the relation between them.
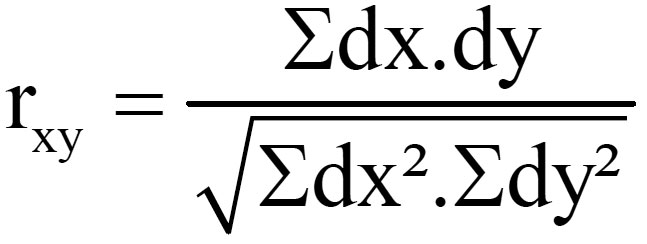
(dx=X- Xm , dy=Y-Ym where X and Y are two different parameters, Xm= Mean value of X, Ym= Mean value of Y)
-
If r = 1, then x and y are perfectly positively correlated. The possible values of x and y all lie on a straight line with a positive slope in the (x, y) plane.
-
If r = 0, then x and y are not correlated. They do not have an apparent linear relationship. However, this does not mean that x and y are statistically independent.
-
If r = -1, then x and y are perfectly negatively correlated. The possible values of x and y all lie on a straight line with a negative slope in the (x, y) plane.
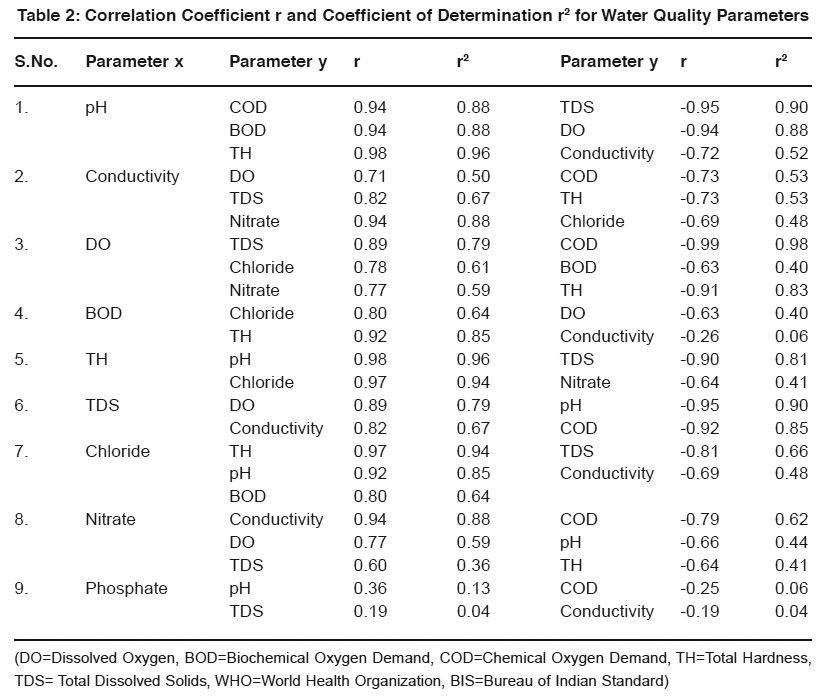 |
Table 2: Correlation Coefficient r and Coefficient of Determination r2 for Water Quality Parameters Click here to view table |
Strength of relationship is expressed by Correlation coefficient (r) but actually it is measured by Coefficient of determination (r2). It gives percentage of variance of one parameter with the other parameter.
Results
Discussions
- pH - Most of the natural aquatic bodies are generally alkaline in nature [Mittal et.al (1990)] due to presence of sufficient quantities of carbonates. pH is found in the range of 6.9-7.6. It shows strong positive correlation with TH(r=0.98, r2=0.96). It reveals that in 96% cases, the pH vary positively with total hardness. It shows negative correlation with TDS, DO and Conductivity(r=0.95, 0.94, 0.72).
- Specific Conductivity- Conductivity is always related to the amount of dissolved solids [Pandian et.al (1985)]. High values of conductivity show presence of ionic substances in water. It shows strong positive correlation with nitrate, TDS and DO(r=0.94, 0.82, 0.71) and negative correlation with COD, TH and Chloride(r=0.73, 0.73, 0.69).
- DO- The water may receive oxygen from the atmosphere at the water surface and by photosynthetic activity of chlorophyll bearing organisms. Low oxygen concentrations lowers the redox-potential near the mudwater and releases the dissolved nutrients as an insoluble oxide. It shows strong negative correlation with COD, BOD and TH(r=0.99, 0.63, 0.91). It reveals that dissolved oxygen reduces when COD and BOD increases indicating organic pollution of water.
- BOD- BOD values approximates the amount of oxidizable organic matter. Therefore it is used as a measure of degree of water pollution and waste strength. Both BOD and COD are found to have higher values than described by the WHO and ISI standards. It shows positive correlation with chloride and TH(r=0.80, 0.92) and negative correlation with DO and Conductivity(r=0.63, 0.26).
- COD- It is a measure of both the biologically oxidizable and biologically inert organic matter. COD values are generally higher than BOD values. It indicates toxic conditions and the presence of biologically resistant organic substances.
- Hardness- Hardness is caused by polyvalent metallic ions dissolved in water. In fresh water, theses are principally Ca2+ & Mg2+ but other metals like Fe2+ & Mn2+ can also contribute. It shows positive correlation with chloride, pH(r=0.97, 0.98) and negative correlation with TDS and nitrate(r=0.90, 0.64).
- Total Dissolved Solids-It consists of inorganic salts (anions like carbonates, chlorides, sulfates, nitrates and cations like (Na+, Ca2+, Mg2+ and K+ etc). It shows positive correlation with DO and Conductivity(r=0.89, 0.82) and negative correlation with pH and COD(r=0.95, 0.92).
- Chloride- It shows positive correlation with TH, pH and BOD(r=0.97, 0.92, 0.80) and negative correlation with TDS and Conductivity(r=0.81, 0.69).
- Nitrate- It shows positive correlation with Conductivity, DO and TDS(r=0.94, 0.77, 0.60) and negative correlation with COD, pH and TH (r=0.79, 0.66, 0.64).
- Phosphate- It shows weak positive correlation with pH, TDS(r=0.36,0.19) and negative correlation with COD, Conductivity (r=0.25,0.19).
- Only COD and BOD values are found exceeding the prescribed limit of WHO and ISI which reveals presence of organic pollution in water.
References
​​​​​​​
- APHA, Standard Methods for Examination of Water and Wastewater. 16th edition APHA, AWWA,Wpcf, Washington, DC (1985).
- Bahl Anshu, Evaluation and Monitoring of Water Quality of Upper Lake using Artificial Aeration Units (Ph. D. Thesis).
- Rolling revision of the WHO guidelines for Drinking Water Quality, (2004).
- BIS, Water Quality Standards for classifying surface water sources.
- Shayamala R., Shanthi M. and Lalitha P., Physico-Chemical Analysis of Borewell Water Samples of Telungupalayalam Area in Coimbatore District, TamilNadu, India, E-Journal of Chemistry, (2008) 5(4) 924-929.
- Tatawat Rakesh Kumar and Chandel C.P. Singh, Hydro chemical Investigations and Correlation Analysis of Ground Water Quality of Jaipur City, Rajasthan, India, Journal of Environ. Science & Engg., (2007) 49(3): 229-234.
- Karthikeyan G., Pius Anitha and Meenakshi S., Correlation Studies of Fluoride with alkalinity and hardness, 26th WEDC Conference on Water, Sanitation and Hygiene: Challenges of the Millennium, Dhaka, Bangladesh (2000).
- Bhandari Narendra Singh and Nayal Kapil, Correlation Study on Physico-Chemical parameters and Quality Assessment of Kosi River Water, Uttarakhand., E-Journal of Chemistry, (2008) 5(2) 342-346.


