Physico-chemical characteristics of surface water of Sehore town, district Sehore, M.P. (India)
Rachna Sharma1 * , Anand Sharma2 and D.R. Tiwari3
1
Department of Chemistry,
LNCT,
Bhopal,
462 001
India
2
Department of Chemistry,
Government, M.V.M,
Bhopal,
462 001
India
3
Department of Geology,
Government, M.V.M,
Bhopal,
462 001
India
http://dx.doi.org/10.12944/CWE.3.2.17
The paper deals with analytical data of different type of parameters such as Ca2+, Na2+, K+, Turbidity and Temperature of pH, Hardness of surface H2O of sehore town. Eight different surface water samples were collected during August 2008. Results were discussed with respect to possible impact on Human Health.
Copy the following to cite this article:
Sharma R, Sharma A, Tiwari D.R. Physico-chemical characteristics of surface water of Sehore town, district Sehore, M.P. (India). Curr World Environ 2008;3(2):307-309 DOI:http://dx.doi.org/10.12944/CWE.3.2.17
Copy the following to cite this URL:
Sharma R, Sharma A, Tiwari D.R. Physico-chemical characteristics of surface water of Sehore town, district Sehore, M.P. (India). Curr World Environ 2008;3(2):307-309. Available from:http://www.cwejournal.org?p=140/
Download article (pdf)
Citation Manager
Publish History
Introduction
Today water resources have been the most exploited natural system since man strode the earth. Pollution of water bodies is increasing steadily due to rapid population growth, industrial proliferations, urbanizations, increasing living standards and wide spheres of human activities. Time is, perhaps not too for when pure & clean water, particularly in densely populated, industrialized water scarce areas may be inadequate for maintaining the normal living standards.
Ground water, rivers, seas, lakes, ponds, and streams, are finding it more & more difficult to escape from population. Many rivers of the world receive heavy flues of sewage, industrial effluents, domestic and agriculture waste which consist of substances varying from simple nutrient to highly toxic hazardous chemicals. In Sehore Parwati River, Jamunia Dam and Bhagwanpura Dam and Siwan River is the main source of surface water in the area of study.
Material and Methods
Water samples were collected from 4 sampling points of different locality in Sehore town during a period of August 2008. The sampling points and places are given in Table 1.
Water samples were collected in plastic canes of 3 liter capacity as per standard procedure. The physico-chemical parameters such as pH, Temperature, Turbidity Total Alkalinity (TA), Total hardness (TH), Calcium (Ca2+), Magnesium (Mg2+), Sodium (Na+), potassium (K+), chloride (Cl-), Sulphate (So42-), Nitrate (No3-), were determined using standard method Reagents used for the present investigation were AR grade and Double Distilled Water was used for preparing various solution.
 |
Table 1: Sampling Point and Places Click here to view table |
Results and Discussion
The average values of physicochemical parameters during Aug-2008 are presented in Table-3. The pH is a measure of the intensity of acidity or alkalinity and gives the concentration of hydrogen ions in water. It has no direct adverse effect on health, but a low value below 4.0 gives sour taste and higher value above 8.5 shows alkaline taste. In the present study, the pH values of water samples varies between 6.7 to 7.7 and were within the limit prescribed by WHO.
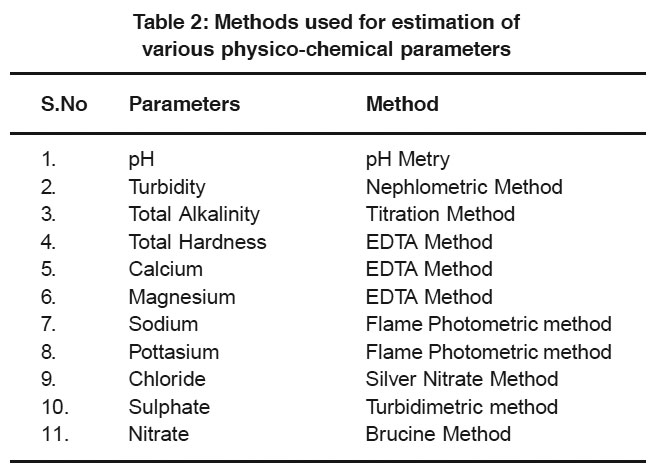 |
Table 2: Methods used for estimation of various physico-chemical parameters Click here to view table |
Turbidity of water is actually the expression of an optical property (Tyndall effect) in which the light is scattered by the particles present in water.
urbidity makes the water unfit for domestic purposes, food and beverage industries and many other industrial uses. In the present study the turbidity values varies between 0.5 to 117 NTU and were not within the limit prescribed by ISI 10500-91 of Sample A4.
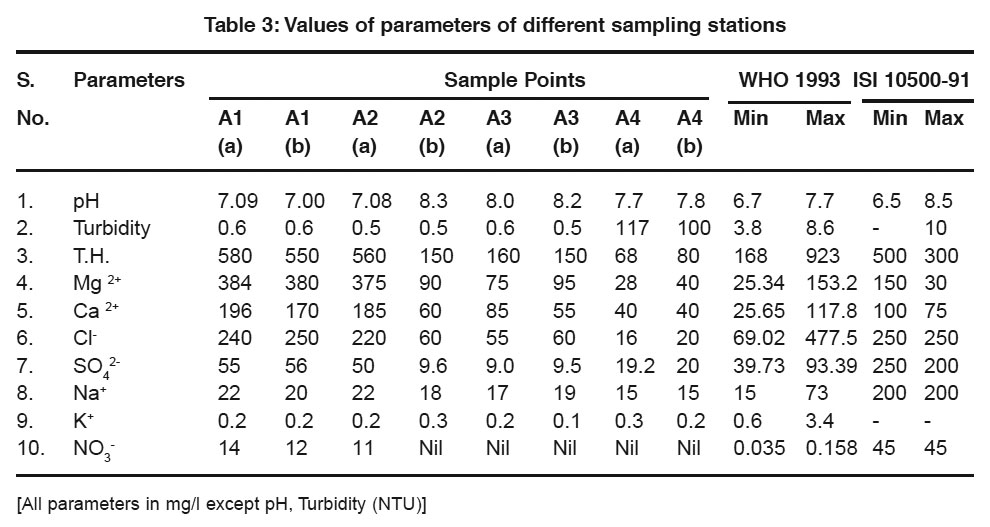 |
Table 3: Values of parameters of different sampling stations Click here to view table |
Hardness of water mainly depends upon the amount of calcium or magnesium salts or both. Hardness of water is objectionable regarding water use of laundry and domestic purpose, since it consumes a large quantity of soap. In the present study; Total Hardness (TH) value varies from 168 to 923 mg/l. The values are not higher than the prescribed limit.
The amount of calcium varies from 25.65 to 117.8 mg/l. which is not found in prescribed limit in A1 and A2. Sodium content varies between 15 to 73 mg/l and found within the prescribed limit. Potassium concentration varies from 0.6 to 3.4 mg/l in which no standard values are suggested for drinking by WHO and ISI 10500-91.
Chloride imparts salty taste if present in excess (> 250mg/l). People accustomed to high chloride in water are subjected to laxative effects. Chloride presence in study area rages form 69.02 to 477.5. All samples found within the prescribed limit. The sulphate content varies between 39.73 to 93.39 mg/l and the nitrate content varies between 0.035 to 0.158 mg/l. The sulphate was found within the prescribed limit. But the nitrate content is more than prescribed limit in sample A1 and absent in all other sample.
Acknowledgements
The authors are thankful to Mr. Ashok Rai OSD LNCT, Bhopal for continuous encouragement and support for doing my research work.
References
-
WHO, International standard for drinking water Genera (1984).
-
APHA standard method for examinations of water and waste water (19th Edn.) American public Health Association, Washington, OC (1995).
-
India standard specification for Drinking Water, ISI, New Delhi (1991).
-
ICMR, Manual Standards of Water Quality for Drinking Water supplies, 2nd Edition, Indian council of Medicinal Research, New Delhi (1973) 21.
-
Holden, W.S. Water Treatment and Examination church hill London, (1970) 513.
-
Rebhun M., Goodman N.2. and Barker F.B., J. Water pollution control Fed, (1987) 59: 242-248.
-
Anand Sharma and Tiwari D.R., (2008) 3(1): 199-202.
-
B.K. Sharma Environmental Chemistry sixth edition 2001 (water 17-18).


