Comparative adsorption study for the removal of Alizarin Red S and patent Blue VF by using mentha waste
Rais Ahmad1 * and Rajeev Kumar1
1
Department of Applied Chemistry,
Faculty of Engineering and technology,
Aligarh Muslim University,
Aligarh,
202 002
India
http://dx.doi.org/10.12944/CWE.3.2.09
The adsorption of the Alizarin Red S (ARS) and Patent Blue VF (PBVF) from aqueous solution onto agricultural waste mentha has been investigated. The effects of initial dye concentration, contact time, pH, temperature and ionic strength were studied in a batch system. ARS and PBVF adsorption onto mentha increased to minor extent with decreasing pH. Adsorption capacities of dyes increased with contact time, initial concentration, and temperature for both ARS and PBVF. Adsorption of ARS on mentha is more favorable than PBVF. The adsorption of ARS and PBVF was spontaneous and endothermic as concluded from thermodynamic assays.
Copy the following to cite this article:
Ahmed R, Kumar R. Comparative adsorption study for the removal of Alizarin Red S and patent Blue VF by using mentha waste. Curr World Environ 2008;3(2):261-268 DOI:http://dx.doi.org/10.12944/CWE.3.2.09
Copy the following to cite this URL:
Ahmed R, Kumar R. Comparative adsorption study for the removal of Alizarin Red S and patent Blue VF by using mentha waste. Curr World Environ 2008;3(2):261-268. Available from: http://www.cwejournal.org/?p=835
Download article (pdf)
Citation Manager
Publish History
Introduction
Dyes are common constituents of effluents discharged by various industries, particularly the textile industry. The presence of very small amounts of dyes in water is highly visible and undesirable.1-2 Dyes may significantly affect photosynthetic activity of aquatic life due to reduced light penetration and may also be toxic to some aquatic life due to the presence of aromatics, metals, chlorides, etc. in them.3-6 Total dyes consumption of the textile industry worldwide is more than 10000 tones /year, with an estimated 90% in fabrics industries. It is reported that approximately 100 tones of dyes are discharged into waste streams by the textile industry per year.7 Alizarin Red S and Patent Blue VF are the most hazardous dyes, responsible for several hazardous effects like skin and eyes irritation when comes in contact and possible cancer hazard.
Although conventional chemical and biological treatments have been applied for the removal of dyes from textile wastewater. These processes are insufficient in removing dye contaminants since dyes are stable to light, heat, and oxidizing agents.8-11 Adsorption has evolved as one of the most effective physical processes for purification of the textile wastewaters since it can produce high-quality water and also be a process that is economically feasible.¹² The most commonly used adsorbent for colour removal is activated carbon.¹³ However, due to the problem of activated carbon’s cost, the use of alternative adsorbents is attractive. Several researchers have been studying the use of other materials, such as industrial waste, agricultural by products, minerals eg., bottom ash,14 peat,15 montmorillonite,16 orange peel17 etc.
In this study we investigated the mentha waste as a potential biosorbent. India is the leading producer of mentha in the world. China and Brazil follow India in the list of major producers on 2nd and 3rd place. The oil is extracted by steam distillation from the fresh or partly dried plant and the yield is 0.1-1.0%. Around 96-99% de-oiled mentha plant is dumped as agricultural waste.
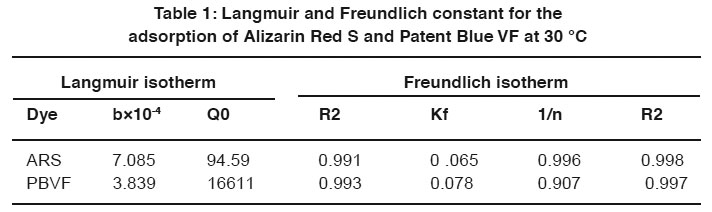 |
Table 1: Langmuir and Freundlich constant for the adsorption of Alizarin Red S and Patent Blue VF at 30 °C Click here to view table |
The objective of this study was to explore the potential use of agricultural waste mentha to remove Alizarin Red S and Patent Blue VF dyes from an aqueous solution in batch.
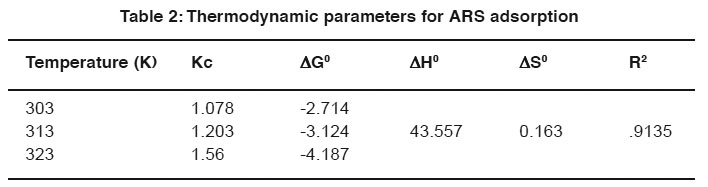 |
Table 2: Thermodynamic parameters for ARS adsorption Click here to view table |
equation:
Where C0 and Ce (mg/L) are the liquid-phase concentrations of dye at initial and equilibrium, respectively. V is the volume of the solution (l) and W is the mass of dry adsorbent used (g).
Results and Discussion
 |
Table 3: Thermodynamic parameters for PBVF adsorption Click here to view table |
Material and methods
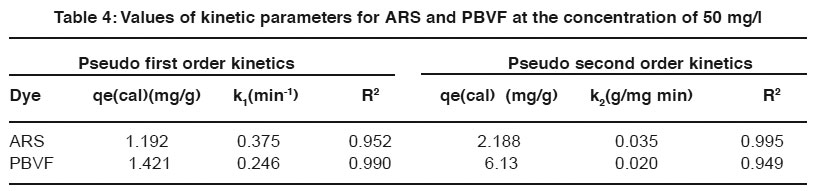 |
Table 4: Values of kinetic parameters for ARS and PBVF at the concentration of 50 mg/l Click here to view table |
Effect of Contact Time
Adsorbate
The dyes, Alizarin Red S, molecular formula (C14H7NaO7S), molecular weight (342.26), C.I. (58005), (λmax 425) and Patent Blue VF molecular formula (C27H31N2NaO6S2) (λmax 635 nm), molecular weight (566.66), C.I.( 42045) was obtained from CDH New Delhi, India .The stock solution was prepared by dissolving accurately weighted dye in double distilled water. The structure of ARS and PBVF is shown in Fig. 1.
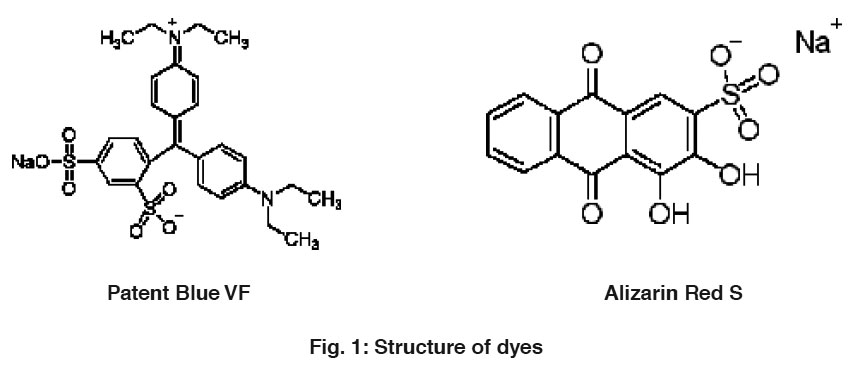 |
Figure 1: Structure of dyes (c) Click here to view figure |
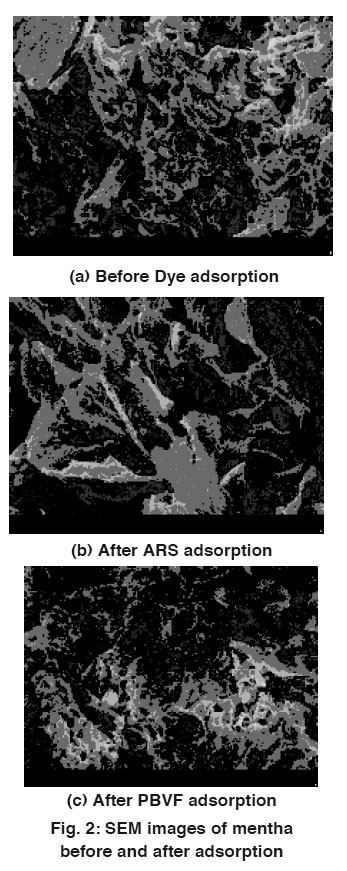 |
Figure 2: SEM images of mentha before and after adsorption Click here to view figure |
Preparation and Characterization of Adsorbent
Mentha was collected from local mentha oil distillation plant. The dry leaves were removed and the colleted biosorbent was extensively washed with hot water and dried. Afterwards, the mentha was crushed. The resulting material sieved by the 100BSS mesh and subsequently washed with double distilled hot water for several time, and then dried in oven at 60°C for 24 h. Mentha surface was characterized by scanning electron microscopy. SEM images clearly show the irregular and porous surface of mentha particles. SEM images of mentha before and after adsorption are shown in Fig. 2.
 |
Figure 3: Effect of contact time for the uptake of ARS Click here to view figure |
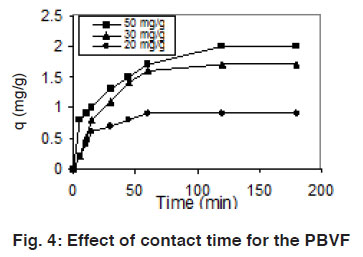 |
Figure 4: Effect of contact time for the PBVF Click here to view figure |
Adsorption Studies
The adsorption capacity of mentha for ARS and PBVF were studied in batch process. 0.5g of mentha was placed in a 250 ml standard flask containing 50 ml of dye solution (concentration range 20-100 mg /L) at contact time ranging from 5-180 min. The dye remained in the solution was determined by double beam UV–vis spectrophotometer (Elico SL 164 model) with 1.0 cm path length cell. Absorbance measurements were made at the maximum wavelength of ARS at 425 and 638 nm for PBVF. The amount of dye uptake by the biosorbent was calculated by applying the equation:
q (C0 C e )V / M ...(1)
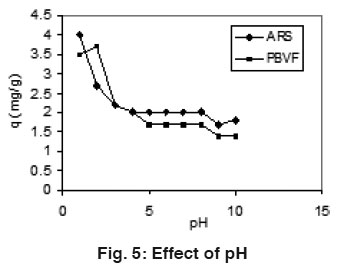 |
Figure 5: Effect of pH Click here to view figure |
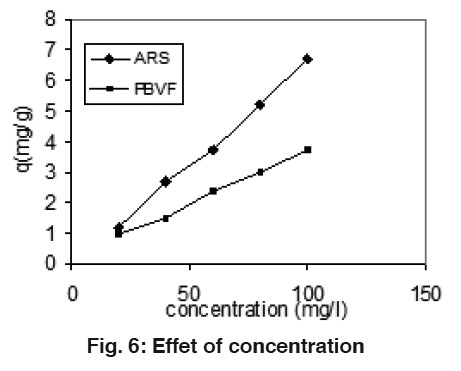 |
Figure 6: Effet of concentration Click here to view figure |
The effects of contact time in the range 5–180 min were studied in the concentration range 20-50 mg/L of dyes solution at 30°C. The uptake of the ARS and PBVF as a function of contact time is shown in the Fig. 3 & 4. The uptake of dyes increased with increased contact time. Maximum quantitative removal of dyes from an aqueous solution was obtained less than120 min. However, the experimental data were measured at 180 min to make sure that full equilibrium was attained. Beyond 120 min, there was no increase in dyes removal.
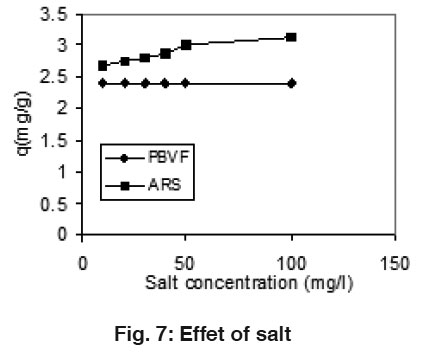 |
Figure 7: Effet of salt Click here to view figure |
Effect of pH
The effect of solution pH on the adsorption of ARS and PBVF is shown in Fig 5. For both the dyes, the amount of adsorption decreases when the pH increased. Low pH was found to be favorable for maximum adsorption of dyes. At lower pH, the positive charge density on the surface of mentha increased which favors the adsorption of negatively charge dyes through the electrostatics force of attraction.18
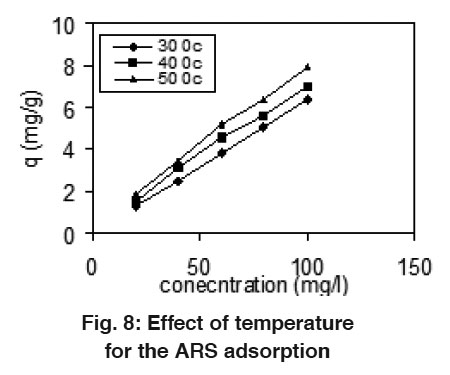 |
Figure 8: Effect of temperature for the ARS adsorption Click here to view figure |
Effect of Concentration
The effect of the amount of adsorbate on the rate of uptake of dyes was studied at various concentrations. The results are shown in Fig. 6. It is obvious that by increasing the initial dyes concentration, the uptake of the dyes increase with increasing the concentration of dyes. It might be explained by the fact that in dilute solution the numbers of dye molecules are less than concentrated.
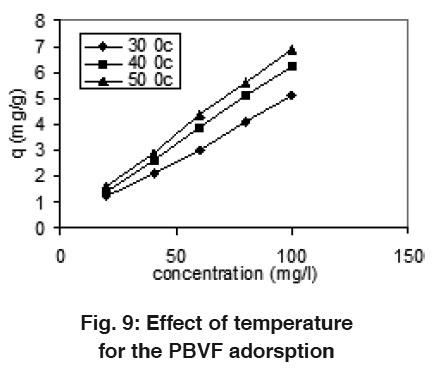 |
Figure 9: Effect of temperature for the PBVF adorsption Click here to view figure |
Effect of Salt
The effect of salt on the adsorption capacity was carried out by varying the concentration of salt in the range 10-100 mg/L. Results indicate the slightly increase in the adsorption of ARS while in case of PBVF, no change in adsorption as shown in Fig. 7. The presence of external electrolyte rise the adsorption of ARS, it means that an electrostatic interaction occurs between ARS and mentha surface.
 |
Figure 10: Langmiur adsorption isotherm for ARS and PBVF at 30°C Click here to view figure |
Effect of Temperature
Effect of temperature on adsorption capacity was studied at the temperature 30, 40 and 50°C. The results are shown in Fig. 8 and 9. There was gradual increase in the adsorption capacity of mentha as the temperature increase 30-50°C and shows that endothermic nature of adsorption. The enhancement in adsorption with temperature may be due to increase in the number of active surface sites available for adsorption on adsorbent, increase in the porosity and in the total pore volume of the adsorbent. This may also be as a result of an increase in the mobility of the dye molecule with increase in their kinetic energy and the enhanced rate of intra-particle diffusion of adsorbate with the rise in temperature.19
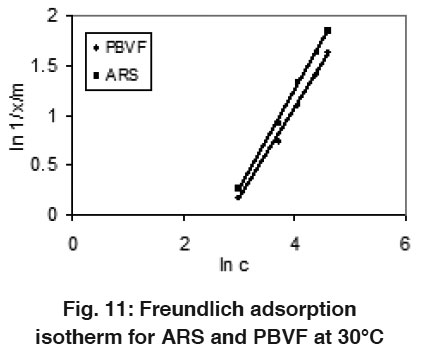 |
Figure 11: Freundlich adsorption isotherm for ARS and PBVF at 30°C Click here to view figure |
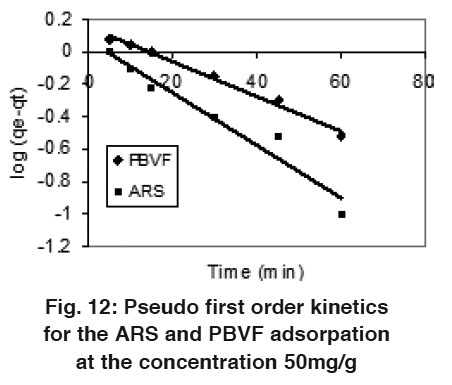 |
Figure 12: Pseudo first order kinetics for the ARS and PBVF adsorpation at the concentration 50mg/g Click here to view figure |
Adsorption Isotherm
The equilibrium adsorption data were analyzed using the well known Langmuir and Freundlich models. Langmuir model is based on the assumption of homogeneity, such as equally available adsorption sites, monolayer surface coverage and no interaction between adsorption species while Freundlich adsorption isotherm is based on the assumption that the sites on the surface of adsorbent have different binding energies. The linear form of the Langmuir and Freundlich isotherm models are given by following equations, respectively:
1/x/m=1/Q0 b c + 1/Q0 ...(2)
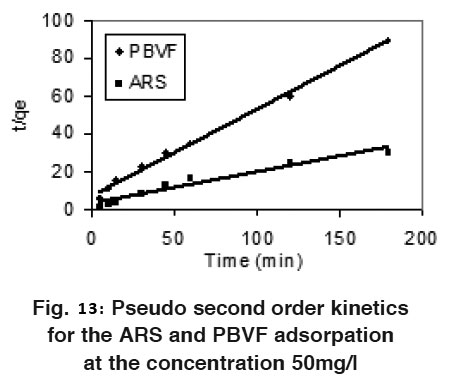 |
Figure 13: Pseudo second order kinetics for the ARS and PBVF adsorpation at the concentration 50mg/l Click here to view figure |
Where x/m is dye uptake in mg/g, c is equilibrium concentration of dye (mg/l), Q0 and b are the Langmuir constant related to the adsorption capacity and adsorption energy. Kf is the Freundlich constant and n the Freundlich exponent. The plots of Langmuir and Freundlich adsorption isotherm models for ARS and PBVF are shows in Fig. 10 and 11 at 30 0C. Langmuir and Freundlich parameters were calculated from the slop and intercept of their respective plots (1/x/m Vs 1/c and ln1/x/m Vs ln c) and the values are listed in the Table 1.
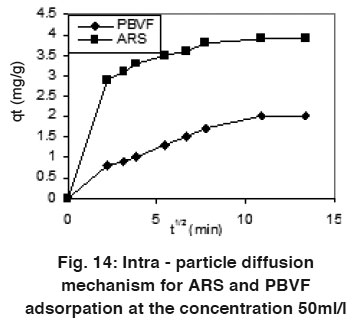 |
Figure 14: Intra - particle diffusion mechanism for ARS and PBVF adsorpation at the concentration 50ml/l Click here to view figure |
Adsorption Thermodynamics
Thermodynamic parameters such as change in free energy ( G0), enthalpy ( H0), and entropy ( S0) were determined using the following eqn.
1nGx/m=1n/K0RTln fKc+ 1/n ln c ...(4)
Where T is temperature in kelvin and R is gas constant. H0, and S0 were calculated from following eq. ln
Kc = S0/ R-DH0/ RT ...(5)
The values of (ÄH0), and (ÄS0) were calculated from the slope and intercept of plots between ln Kc versus 1/T. The calculated values of (ÄG0), (ÄH0), and (ÄS0) are listed in Table (2 & 3). The positive value of enthalpy indicated the endothermic nature of the adsorption interaction and negative values of ÄG0 shows the feasibility of adsorption of ARS and PBVF onto mentha waste.
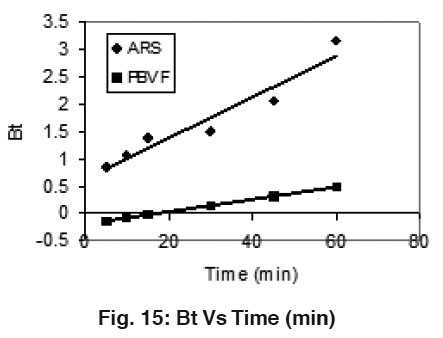 |
Figure 15: Bt Vs Time (min) Click here to view figure |
Adsorption kinetics
Feasibility and efficiency of adsorption process can be determined by the kinetic study. Kinetics data of ARS and PBVF was evaluated by the pseudo first and pseudo second order kinetic models. Pseudo first order20 (eq. 6) and pseudo second order21 (eq. 7) equations are shown as:
log (qe - qt) = log qe - k1 t/2.303 ...(6)
Where qe and qt are the amount adsorbed at equilibrium and time t, respectively. Where k1 and k2 are pseudo first and pseudo second order rate constant. Fig. 12 and 13 shows linear plots of pseudo first and pseudo second order kinetic models for ARS and PBVF adsorption. The values of all the parameters are given in Table 4. The result shows good agreement of experimental data with pseudo second order model. As can be seen from Table 4, the calculated value of qe has close agreement with the experimental data and good correlation coefficient for pseudo second order. It can be said that both dyes adsorption system followed pseudo second order kinetic model.
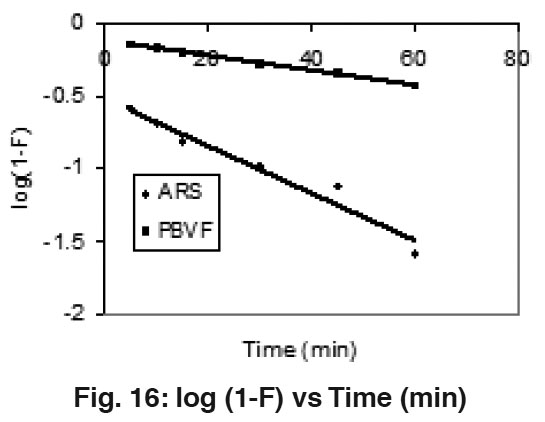 |
Figure 16: log (1-F) vs Time (min) Click here to view figure |
Sorption Mechanism
The intra-particle diffusion parameter, ki (mg/g min0.5) is defined by the following eq.
Where qt is the amount of dyes adsorbed (mg/g) at time t, ki is intra-particle diffusion constant (mg/g min0.5), and c is the intercept. The plots of qt Vs t0.5 are linear (Fig. 14). If the value of c is zero, then the rate of adsorption is controlled by intra-particle diffusion for the entire adsorption period, but the values of the c are not zero so the adsorption process was controlled by film diffusion for ARS and PBVF. ARS has the ki = 0.268 mg/g min0.5 and c = 1.88 while PBVF has the ki value 0.143 with c = 0.391 at the concentration 50 mg/L.
The film-diffusion model of Boyd is expressed as:
Where F is the fractional attainment of equilibrium, at different times, t, and Bt is a function of F (vice versa)
Where qt and qe are the dye uptake (mg/g) at time t and at equilibrium, respectively. The Boyd plots of ARS and PBVF shown in Fig. 15. The plot Bt Vs Time shows linearity with straight lines without passing through the origin in case of both dyes adsorption. This suggests film diffusion as rate determining process.22
To reconfirm the above observations Mckay’s plots log (1"F) Vs Time (Fig. 16) were plotted at 50 mg/l concentration of both dyes and straight lines deviating from origin were obtained. These observations support the rate of adsorption of ARS and PBVF over mentha waste undergo via internal transport mechanism.23
Conclusion
Mentha waste is a locally available and low-cost material that can be used as an alternative adsorbent for removal the acidic dyes Alizarin Red S and Patent Blue VF from aqueous solutions, without any laborious pre-treatment. The adsorption of ARS and PBVF depended on initial dye concentration, temperature and pH. Quantitative adsorption of ARS and PBVF were obtained within a very short time. The equilibrium was stabilized less than 120 min. In the presence of external electrolyte, there is electrostatic interaction between ARS and mentha. Adsorption obeys both Freundlich and Langmuir isotherms. The positive value of “H0 indicates the endothermic nature of dyes adsorption.
References
-
Crini G., Bioresour. Technol., (2006) 97: 1061.
-
Robinson, T., McMullan G., Marchant R. and Nigam P., Bioresour. Technol., (2001) 77: 247.
-
Banat I.M., Nigam P., Singh D. and Marchant R., Bioresour. Technol., (1996) 58: 217.
-
Mishra G. and Tripathy M., Colourage, (1993) 40, 35.
-
Fu Y. and Viraraghavan T., Bioresour. Technol., (2001) 79: 251.
-
Zollinger H., Azo dyes and pigments, Colour Chemistry-Synthesis, Properties and Applications of Organic Dyes and Pigments, VCH, New York (1987) 92-100.
-
Wong Y. C., Szeto Y. S., Cheung W. H., McKay G., Langmuir, (2003)19: 7888.
-
Jyun T. K., Chulhwan P., Eung B. S., Sangyong K,. Desalination, (2004) 49: 161.
-
Jyun T. K., Chulhwan P., Jeongmok Y., Sangyong K., J. Hazard. Mater., B (2004) 112: 95.
-
Bell J., Buckley C. A., Water SA, (2003) 29, 129.
-
Herrera F., Lopez A., Mascolo G., Albers P., Kiwi J., Water Res., (2001) 35: 750.
-
Ozcan A., Ozcan A. S., J. Hazard. Mater., B (2005) 125: 252.
-
Oliveira L. C. A., Rios R. V. R. A., Fabris J. D., Garg V., Sapag K., Lago R. M., Carbon, (2002) 40: 2177.
-
Gupta V.K., Mittal A., Krishnan L. and Gajbe V., Sep. Purif. Technol., (2004) 40: 87.
-
Ho, Y. S., McKay G., Chem. Eng. J., (1998) 70: 115.
-
Yermiyahu, Z., Lapides I. and Yariv S., Clay Miner., (2003) 38: 483.
-
Namasivayam C., Muniasamy N., Gayatri K., Rani M. and Ranganathan K., Bioresour. Technol. (1996) 57: 37.
-
Muhammad J.Iqbal, Muhammad N Ashiq., J. Hazard. Mate., B (2007) 139: 57.
-
Zu mriye Aksu, AyesIÿdil Tatlý, Ozlem Tunc¸ Chemical Engineering Journal doi:10.1016/ j.cej.2007.11.005 (2007).
-
Periasamy K., Namasivayam C., Ind. Eng. Chem. Res., (1994) 33: 317.
-
Ho Y.S., McKay G., Process Biochem., (2003) 38: 1047.
-
Hameed B.H., El-khariary M.I., J.Hazard. Mate. (2007),doi:10.1016/j.jhazmat. 2007.10.017.
-
Alok Mittal, J. Hazard. Mate., B (2006) 128 233.


