Physico-chemical characteristics of ground water of Surat city
Viral H. Raval1 and G.M. Malik1 *
http://dx.doi.org/10.12944/CWE.3.1.09
Ground water samples were collected from different locations in the radius of 25 km. of Surat city, Gujarat(India). These samples of ground water from 12 sampling point of Surat for their physico-chemical studies were tested. Laboratory tests were performed for the analysis of samples for pH, Colour, Odour, Hardness, Chloride, Alkalinity, COD, Sulfate, TDS, SS, Fe, Cu, Boron and Chromium. On comparing the results against drinking water quality standards laid by Indian Council of Medical Research (ICMR) and World Health Organization (WHO), it is found that most of the water samples are non-potable for human being due to high concentration of one or the other parameter. Most of the samples have Total Alkalinity, Hardness, Chloride and TDS values much higher than the permissible level stipulated by ICMR and WHO. The high values of these parameters may have health implications and therefore these need attention.
Copy the following to cite this article:
Raval V.H, Malik G.M. Physico-chemical characteristics of ground water of Surat city. Curr World Environ 2008;3(1):67-74 DOI:http://dx.doi.org/10.12944/CWE.3.1.09
Copy the following to cite this URL:
Raval V.H, Malik G.M. Physico-chemical characteristics of ground water of Surat city. Curr World Environ 2008;3(1):67-74. Available from: http://www.cwejournal.org/?p=744
Download article (pdf)
Citation Manager
Publish History
Introduction
Increasing industrial activities result in deterioration of quality of natural water. Surface water has its own water purification capacity but if ground water once contaminated it can not restore itself again as natural water. The problems of groundwater quality are more acute in the areas, which are densely populated, thickly industrialized and have shallow ground water table. The rapid growth of urbanization further affected the ground water quality due to over exploitation of resources and improper waste disposal practices. Therefore, it is essential for protection and management of ground water quality.
Surat is one of the major cities of Gujarat. The radius under study consists of residential as well as industrial areas. Main aim is to asses the groundwater quality after the flood in Surat city and to compare the result with drinking water standards. After collecting the samples physicochemical parameters of ground water were carried out. These water quality parameters are used to determine the quality of water and compared it with drinking water standards prescribed by WHO (1993) 1,2 and ICMR (1986).1,2
Study Area
Topography
The city lies at a bend of the River Tapi, where its course swerves suddenly from the North-East to SouthWest. With the walled city at its centre, the city forms an arc of a circle, the bends enclosed by its walls stretching for about a mile and a quarter along the bank. From the right bank of the river, the ground rises slightly towards the north, but the height above mean sea level is only 13 metres. The topography is controlled by the river and the general slope is from North-East to South-West.
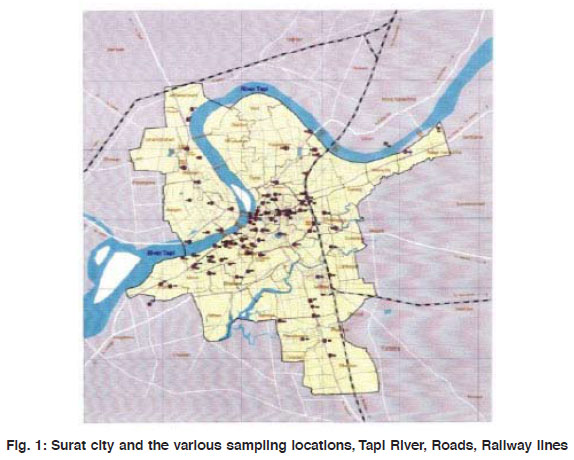 |
Figure 1: Surat city and the various sampling locations, Tapi River, Roads, Railway lines Click here to view figure |
Temperature and Rainfall
The summers are quite hot with temperatures ranging from 37.7°C to 44.4°C. The climate is pleasant during the monsoon while autumn is temperate. The winters are not very cold but the temperatures in January range from 10°C to 15.5°C. The average annual rainfall of the city has been 1143 mm.
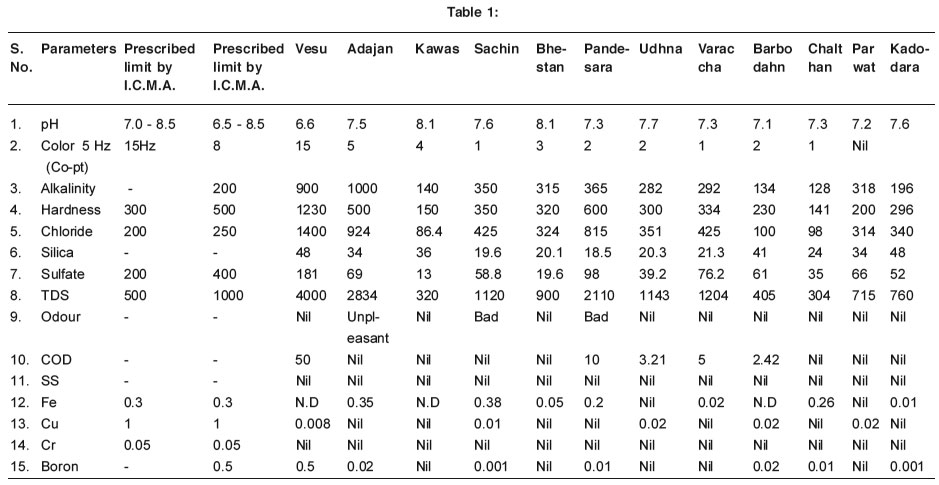 |
Table 1: Click here to view table |
Fig. 1 depicts the Surat city and the various sampling locations, Tapi River, Roads, Railway lines.
Experimental
The present study deals with ground water quality monitoring over the distance of 25 km radius of Surat city. Different samples of groundwater were collected from Barbodhan, Sachin, Uttran, Udhna, Varaccha, Adajan, Pandesara, Vesu, Parvat, Chalthan, Kadodara and Kawas. The results of respective places are given in table 2 and compared all results with the standards values given by WHO(1993)1,2 and ICMR(1986)1,2 in table 1. The ground water samples were collected in pre-cleaned new bottles of 2 lt. capacity and stored in ice-box. AnalaR grade chemicals were used without further purification. The physicochemical analysis were done according to APHA(1989)4 standards method for examination of water and waste water. The various parameters were analyzed viz. pH, Color, Odour, Hardness, Chloride, Total Alkalinity, COD, Sulfate, TDS, SS, Fe, Cu, Boron, Chromium. Some parameters like pH, Colour, Odour were checked within 6 hrs. The obtained results were reproducible within ± 3 % error limit.
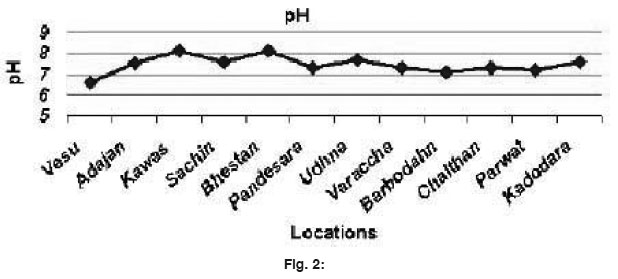 |
Figure 2: Click here to view figure |
Results and Discussion
Drinking water standards by ICMR(1986)1,2 and WHO(1993)1,2 are summarized in table 1. Average values of Physico-chemical parameters of ground water from different locations are presented in table 1. It was observed from the pH values that water samples were slightly alkaline varying from 7.0 - 8.32 and this values are within the prescribed by WHO(1993)1,2 and ICMR(1986)1,2. Only slight less pH in Vesu sample was found which may change the taste and color. pH trend is plotted in fig 1.
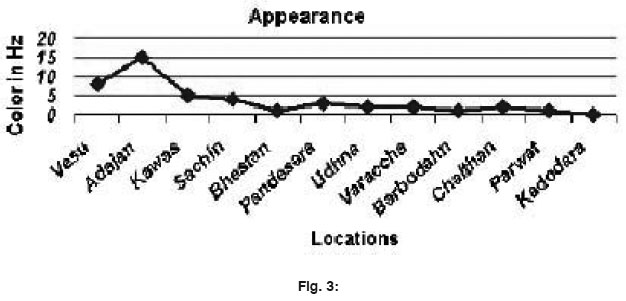 |
Figure 3: Click here to view figure |
In all the ground water samples color was checked in Hazen unit1,4. From the analysis it seems that all water samples having acceptable color except Vesu and Adajan. Colour is not adversely affecting the water quality but color is aesthetically not acceptable. Trend of appearance plotted in fig. 2.
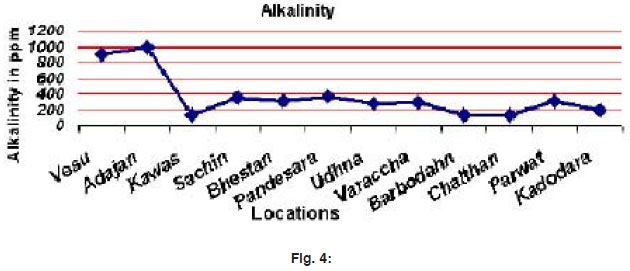 |
Figure 4: Click here to view figure |
Determination of alkalinity varied from 140-1000 ppm from which most of the samples containing higher alkalinity than the standards5,8. More alkalinity needs more water softening during treatment of raw water1. Fig 3 shows total alkalinity trend in samples. Determination of hardness varied from 155 to 1230 ppm. Here except 3-4 location every sample contained more hardness than prescribed limit. So the adverse effects of such water samples are1,(1) soap consumption by hard water causes economic loss to water (2) precipitation by hard water adhere to surface of tubes, sinks etc. and may stain clothing, dishes and other items. (3) MgSO4 precipitates have laxative effect in persons unaccustomed to it. So all these samples fall into category of hard water. Trend of hardness is plotted in fig. 4.
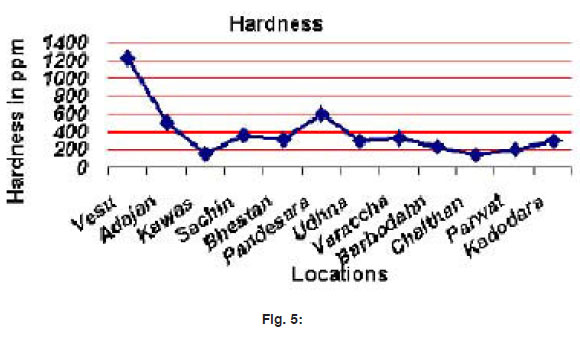 |
Figure 5: Click here to view figure |
It was found that the amount of chloride present in analyzed samples were beyond the limit except Kawas and Chalthan. High chloride reacts with sodium and makes water salty in taste, which is unacceptable for human consumption. It also increases the TDS values there by affecting the quality of water. Trend of chloride is plotted in fig 5. Same were the results with TDS, while increasing Chloride and other salt content TDS increases accordingly. From the analysis of most of the samples except Kawas, Barbodhan and Chalthan all ground water samples contains more TDS than the prescribed limit given by WHO1,2 and ICMR1,2. TDS concentration beyond 500 ppm decreases potability and may cause gastrointestinal irritation. Trend of TDS is plotted in fig 6.
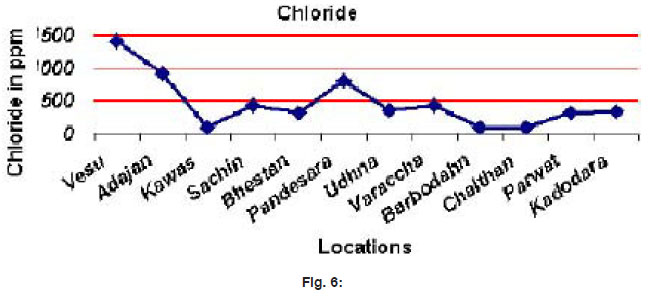 |
Figure 6: Click here to view figure |
In all the samples sulfate were with in the limit. The range of sulfate found was 13 to 181 ppm which was within the limit and therefore no more attention to be given for sulfate values. Trend of sulfates is plotted in fig. 7.
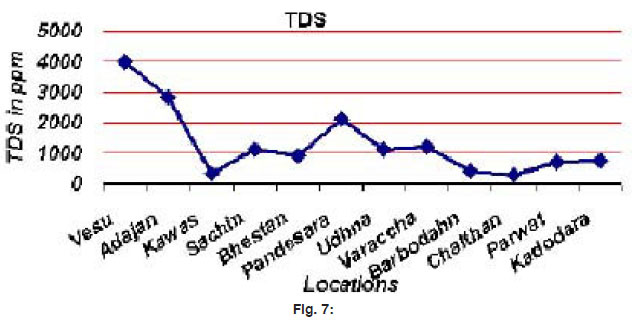 |
Figure 7: Click here to view figure |
In all the samples silica was within the limits. The results vary from 18.5 to 48 ppm. All samples contained acceptable silica content so there was no problem of potability where silica is concerned. Trend of Silica is plotted in fig 8. Odour is physical property of water and from the results it was found out that the samples from Adajan, Sachin and Pandesara were having slight unpleasant odour, which is undesirable for drinking purpose. So such ground water needs more purification to remove odour from the water. Except these three samples all are having no odour so those water samples are acceptable for drinking purpose.
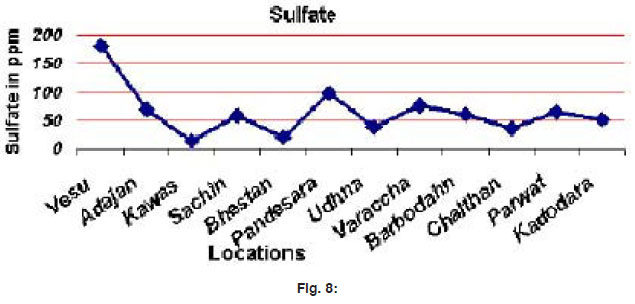 |
Figure 8: Click here to view figure |
COD is the main parameter to asses the quality of wastewater. In water there is no standard mentioned it means all the water source should be COD free but during the analysis we found that sample from Vesu contained more COD i.e. 50 ppm which is too high and indicate that water quality is very bad. Rest of all ground water samples contained negligible COD which can not harmful to human health. There is no limit for S.S in WHO1,2 and ICMA1,2 standards. It is a physical property of water and more S.S is not acceptable as it is aesthetical asset of water. All the ground water samples having negligible S.S so there is no problem of S.S to the public for drinking purpose.
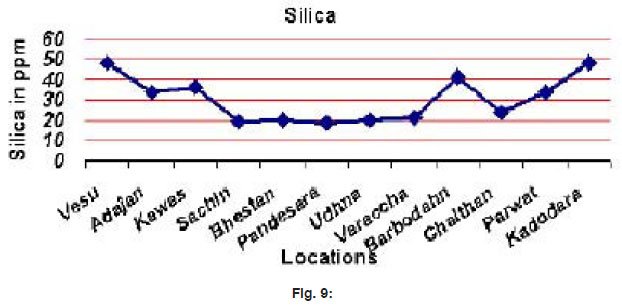 |
Figure 9: Click here to view figure |
Amount of Iron in all the samples were within the prescribed limit except Adajan and Sachin. Iron found very less in surface water while ground water contains more Iron than the surface water. Water containing Iron>2 ppm causes staining on clothes and sanitary wares and imparts bitter astringent taste. Taste and odour are problems that may be caused by filamentous organisms that prey on iron compounds (Frenothrix, Galionella). So such problem may arise in case of these two samples.
There were no evidence of Chromium from the obtained samples of the ground water. Chromium is toxic to human heath, animals and aquatic life. It can produce lung tumor when inhaled and readily induces skin sensitization. But here there was no chromium found so there was no such problem arose from the collected samples. Copper salts are used in water supply system to control biological growth in reservoir and distribution pipes and also to catalyze oxidation of Manganese. But here from all the ground water samples, copper is in trace amount which is negligible and there by in water treatment copper salt to be added.
Also all water samples contained negligible Boron content. The results obtained are with in the limit given by WHO (0.5 ppm).
Conclusion
It can be concluded from the results that the groundwater in radius of 25 km in Surat city posses high value of Total Alkalinity, Total Hardness, Chloride and TDS etc. through all of these factors may pose health hazard (on long term), yet these degrade quality of drinking water and therefore require to be treated before directly using for drinking purpose.
Acknowledgements
The authors are thankful to Mr. Dharmesh Rathod for sample collection from different locations and to Mr. Bhavesh Tandel-Clean Environment consultancy (Valsad) for evaluation of samples.
References
- Maiti, S.K., Handbook of Methods Environmental studies Volume-1, Water and Wastewater analysis.
- WHO’s Guidline for Drinking Water Quality, set up in Geneva, are the International reference point for Standard Setting and Drinking Water Safety (1993).
- Surat city Development Plan (2006-2011).
- APHA, Standard Method for the Examination of Water and Wastewater American Public Health Association, American Water Works Association and Water Pollution Control federation, 19th, Washington, DC, (1995).
- Davis, S. N., Dewiest, R., Hydrogeology, John Wiley and sons, New York (1996)
- Clesceri, L.S., et al., Standard Methods for the examination of Water and Wastewater (17th Ed.), (1989).
- U.S.E.PA, National Primary Drinking Water Regulations, Technical Fact Sheets Washington, D.C.: office of water, office of ground water and drinking water
- Indian Standard, IS-3025 (Part-43), (1992)
- Jain, C.K., Bhatia, K.K.S and Kumar, Vijay, “Ground Water quality in sagar district Madhya Pradesh”, Indian J. Env Health, (2000) 42: 4,151-158.
- Patil P. R, Patil N. B and Chavan V. G., Bullet Env Sci., (2001) IXI 2000, 9.


