A comparative study of ground water quality and water quality index of certain selected areas situated around Tumkur city, Karnataka
C. Vijaya Bhaskar 1 and G. Nagendrappa1 *
http://dx.doi.org/10.12944/CWE.3.1.10
Ground water is believed to be comparatively clean and free from pollution than surface water. Prolonged discharge of domestic sewage and solid waste causes the ground water to become polluted and create health hazards, but the National Water Policy (2002) states, "adequate clean water should be provided to the entire population both in urban and rural areas". Therefore the ground water samples from 15 locations of 5 selected areas namely, Kadaba, Kallambella, Honnudike, Hebbur and Kunigal of situated around Tumkur city have been collected from August to December, 2007 and analyzed for physico-chemical parameters. The values obtained were compared with standards prescribed by ISI and WHO. The data have revealed that certain water samples from Kallambella, Kadaba and Honnudike area have high nitrate level and are of immediate health concern. The water samples of Kallambella area were found to be too hard. The Canadian Council of Ministers of The Environment (CCEM) water quality index (WQI) values were calculated fro a few samples of selected areas and compared with the approved values. The results so obtained would account for the fact that the water samples from Hebbur (S1) and Kunigal (S2) area are of excellent quality; samples (S2) of Kadada area are of good quality, samples (S1) of Honnudike area are of fair quality whereas samples (S2) of Kallambella area are of marginal quality.
Copy the following to cite this article:
Bhaskar C.V, Nagendrappa G. A comparative study of ground water quality and water quality index of certain selected areas situated around Tumkur city, Karnataka. Curr World Environ 2008;3(1):75-82 DOI:http://dx.doi.org/10.12944/CWE.3.1.10
Copy the following to cite this URL:
Bhaskar C.V, Nagendrappa G. A comparative study of ground water quality and water quality index of certain selected areas situated around Tumkur city, Karnataka. Curr World Environ 2008;3(1):75-82. http://www.cwejournal.org?p=96/
Download article (pdf)
Citation Manager
Publish History
Introduction
Ground water is considered to be safe when compared to surface water and accounts for maximum share of drinking water supply. Ground water is also an important source for agriculture and industry. It is less prone to contamination but normally having high mineral content, still an important water resource compared to surface water. However, excessive uses of chemicals and fertilizers have increases the risk of ground water contamination¹ that wound affect ecosystem.² There are reports showing ground water is not only contaminated but also deteriorated.³
As ground water is an important and integral part of hydrological cycle, its availability depends on the rainfall and recharge conditions. Improper management and environmental degradation are making such valuable water resources depleting and creating a fresh water crisis, that may account for an estimate that puts 30% of mortality and 50% of mobidity to water borne infections diseases.4 Therefore, there is a need for monitoring and understanding water quality. Its quality index values reflect the over all and ongoing condition of the water in a chosen area. As a consequence, innumerable methods are developed to evaluate quality index including the British Columbia (BC) Ministry of Environment, Lands and Parks,5 which is based on a combination of three factors.
- The number of variable whose objectives are not met, F1(Scope).
- The frequency with which the objectives are not met, F2(frequency) and
- The amount by which the objectives are not met, F3 (Amplitude).
These are combined to produce a single value (between 0 and 100) that describes water quality. The CCME WQI6 relies on BC and Alberta indices with little modifications. In the CCME WQI, a value of 100 is the best possible index score and a value of 0 is the worst possible. The water body, time period, variables index score and a objectives need to be defined to calculate the index. The calculation requires that at least four variables, sampled a minimum of four times, be used. However, a maximum number of variables of samples are not specified. The selection of appropriate water quality variables for a particular region is necessary for the index of yield meaningful results. All these1-5 have prompted the word presented here.
Material and Methods
Study Area
The areas, namely Kadaba, Kallambella, Honnudike, Hebbur and Kunigal that are situated around Tumkur city have been selected to study their water qualities. Three localities from each area totaling to 15 were chosen for the collection of water samples from bore wells and hand pumps with care to avoid accidental contamination. Water quality parameters such as pH, EC, TH, nitrate, fluoride, calcium, magnesium, iron and lead were analyzed through standard methods given in APHA7 and chemical and biological methods for water pollution studies.8 The pH was determined using a digital pH meter. DO was determined by Winkler's iodometric method. Nitrate was determined by Brucine method. Fluoride was analyzed spectrohotometically by SPANDS method. While chloride and alkalinity were analyzed by titrimetric method. Total hardness and calcium hardness were determined by EDTA complexometric method. The concentration of sodium and potassium were determined by flame photometric method. However heavy metals were analyzed at the Mines and Geology department, Bangalore following AAS method. The data obtained are given in Table 1. The CCME water quality index values were also calculated for a few selected samples as representative of the selected areas through the equation.

where F1, F2 and F3 are as described under introduction.
The divisor 1.732 normalizes the resultant values to a range between 0 and 100, where 0 represents the 'worst' water quality and 100 represents the 'best' water quality. In calculating the index values five months data for six variables have been used.
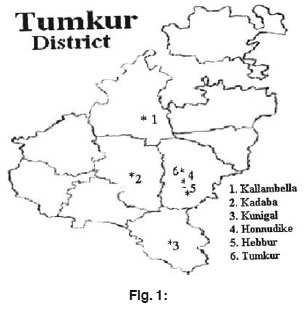 |
Figure 1: Click here to view figure |
Results and Discussion
pH
The pH values of water samples of the study areas were ranged from 7.4 to 8.2 that are in the desirable range set by WHO.9 However, the pH values of the samples of Kadaba, Kallambella and Kunigal are accounting for a slight alkalinity and non-corrosive nature. The pH values as such have no adverse effect on health, but higher pH values reduce the germicidal potentiality of chlorine and induce the formation of toxic trihalomethanes.
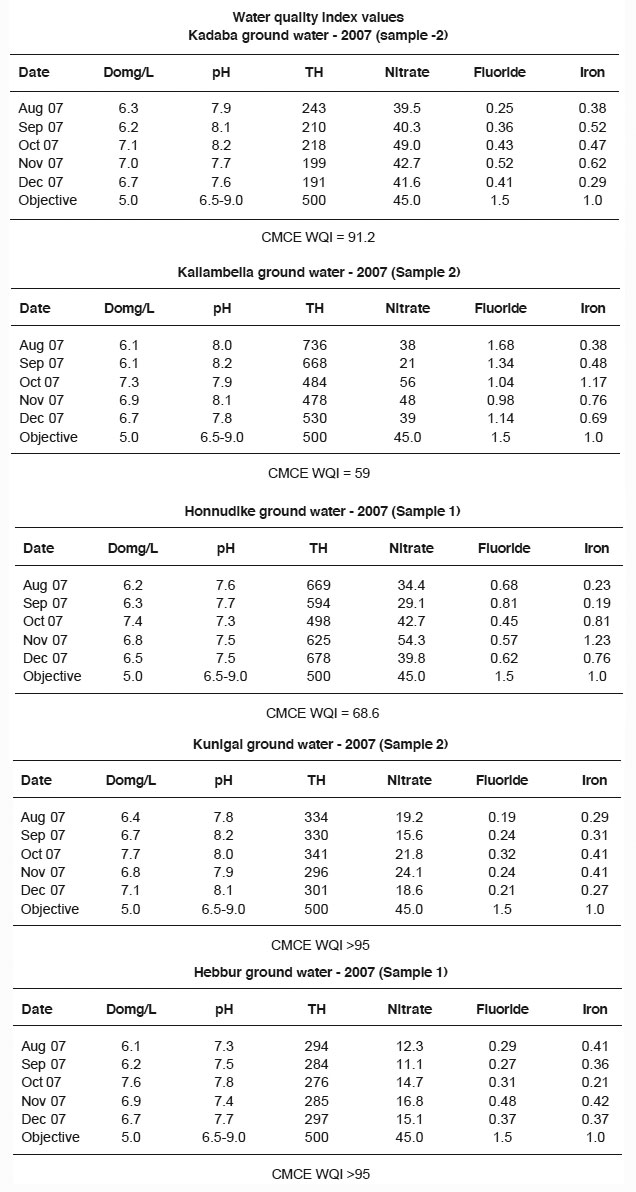 |
Water quality index values Click here to view table |
Dissolved Oxygen
DO level wil depend on the physico-chemical and biological activities of the water body. Good potable water is expected to have the DO in the range of 7.0 to 0.9 mg/L at 20-30°C². The samples of the present study having DO in range, 6.5-8.2 mg/L and accounting for the observed absence undesirable odors and tastes of the water bodies.
 |
Table 1: Water quality parameters Click here to view table |
Nitrates
Nitrates are the most frequently occurred water pollutants in rural areas. Nitrates generally found in traces in surface waters, but may attain high values in ground water. The permissible limit of nitrate in drinking water is 45 mg/l. High concentration of nitrate (>45mg/l) in drinking water causes a child disease known as "methemoglobenimia" or "blue baby syndrome". It is characterized by reduced ability of the blood to carry oxygen because of reduced levels of hemoglobin. In the human body nitrates are converted into nitrites which then oxidize hemoglobin to methaemoglobin, an autocatalytic reaction.10
Hb (O2)4+ 4NO2- + 4H+ → Met Hb + 4NO3- + 2H2O+O2
Thus the oxidation of iron from the ferrous state in hemoglobin to the ferric state yields methaemoglobin, which imparts a chocolate he to the blood¹¹. For individuals who suffer from anemia, cardiac failure or pulmonary disease the symptoms of hypoxia may appear at lower percentage levels of methaemoglobin. Also there are certain possible links between high nitrate consumption and certain type of cancers¹². Nitrate contamination of the ground water through out the world is a source of rising concern. In the present observation the nitrate values of the samples were found to be in the range, 3.0-87 mg/L indicating that some of the samples namely S3 of Honnudike area (87mg/l) and samples S2 of both Kadaba and Kallambella areas (60mg/l and 56 mg/l) have higher nitrate level than the permissible limit (Table 1) making them to be unsuitable for drinking.
Flouridies
The permissible value of fluoride in drinking water is 1.5 mg/L (WHO). Fluoride is more common in ground water than in surface water. The sources of fluorides in ground water are fluoride-bearing rocks. In ground water, fluoride concentrations vary with the type of rock the water flows through but do not usually exceed 10mg/litre. The excess of fluoride in water causes flourosis, which depends on the climatic conditions of the area. In warmer areas, dental flourosis occurs even at lower concentrations in the drinking water. It is chiefly characterized by mottling of teeth. Long term ingestion of large amounts can also lead to skeletal flourosis, like stiffness and pain in the joints. Drinking water with level 2 ppm fluoride can disturb the functions of kidney and liver in children. Several animal studies have already shown the evidence of fluoride related kidney damage at levels as low as 1 ppm in rats and 5 ppm in monkeys.¹³ It is known that persons suffering from certain forms of renal impairment have a lower margin of safety for the effects of fluoride than the average person. Fluoride along with perchlorate has been considered as an "emerging neurotoxic substance" due to its link to lower IQs in children and brain damage in animals.14 The fluoride in water samples of the present study are in the range, 018-1.61 mg/L indicating that all samples of the study area are having the fluoride level less than the permissible limit except the samples S3 of Kallambella area (1.67mg/L) where it has exceeded the limit (Table 1).
Chlorides
The surface and ground waters are always found to contain dissolved and suspended substances of organic and mineral origin. When disinfectants such as chlorine are added for drinking water to protect from pathogenic microorganisms, they react with naturally occurring organic matter and have been reported to form trihalomethanes (THMs), suspected carcinogens.15 Chloride concentration above 100 mg/L give salty taste to water. A high level of chloride is excepted to affect plants and animals.16 In the present study, the chloride values of all the samples are in the range, 20-448 mg/L and within the permissible limit of WHO (Table 1).
Total Hardness
In general, ground waters are harder than surface waters, the magnitude depends on geological conditions. The hardness of water is mainly due to calcium and magnesium. Though the maximum permissible value of total hardness in drinking water is 600mg/L, beyond 300 mg/L it produces gastrointestinal irritation.17 The total hardness of the samples under study are ranged from 136 ,g/L to 668mg/L. The samples S1 and S2 of Kallambella area and samples S3 of Honnudike area have crossed the permissible limit whereas all other samples have hardness within the acceptable range. The highest hardness is with the samples S2 of Kallambella area (668 mg/L) and the lowest being in samples S1 (136mg/L) of both Kadaba and Kunigal areas (Table 1).
Cationic Constituents
Iron causes staining of clothes and utensils. Some metalloids of iron, sodium, cadmium and silica in water are extermely toxic to life. Sodium and potassium both have good solubility and mobility and do not precipitate at any pH.18 The concentration of iron was maximum (1.17 mg/L) in sample S1 of Kallambella area have high sodium concentration that may create sodium hazard in the soil.
Total Dissolved Solids
In natural waters, the dissolved solids mainly consist of bicabonates, carbonates, sulfates, chloride, nitrates and phosphates of calcium, magnesium, sodium and potassium with traces of iron, manganese and other minerals. The amount of dissolved solid is an important consideration in determining suitability of water for irrigation, drinking and industrial uses. In general, waters with a total dissolved solids <500 mg/l are most suitable for drinking. Higher dissolved solids may lead to impairment in physiological processes in the human body. Dissolved solids are undesirable in industrial water due to formation of scalling, accelerate, corrosion, interfere with color and tastes of many finished products. In the present study, TDS is in the range, 300-1610 mg/L. All the samples except S2 of Kallambella area have TDS within permissible limits set by WHO making tem acceptable for drinking and irrigation. But the S1 and S3 samples of Kallambella area; S1 and S3 samples of Honnudike area have hardness close to maximum permissible limit.
Water Quality Index
The quality index sample (S1) of Hebbur and (S2) of Kunigal area has excellent quality indicating virtual absence of threat of impairment to its quality. The quality of sample (S2) of Kadaba area is good, implying that water quality is protected with only a minor degree of threat of impairment; conditions rarely depart from natural or desirable levels. The sample (S2) of Kallambella area is marginal and implies that water quality is usually protected but occasionally threatened or impaired. The sample (S1) of Honnudike area is fair, implying that water quality is frequently threatened or impaired.
Conclusion
The CCME WQI indicates that water quality of sample (S1) of Hebbur and (S2) of Kunigal areas is excellent, that of the sample (S1) of Kadaba area is good, that of the sample (S2) of Kallambella area is marginal and that of the sample (S3) of Honnudike area is fair, in 2007. In some of the samples of Kallambella and Honnudike area are having very high nitrate concentrations indicating the excess use of fertilizers, and depletion of ground water level. The waters of Kallambella area area also having more hardness making them to considered as unsuitable for many purpose.
Acknowledgements
Authors are thankful to the Department of Mines and Geology, Bangalore and Tumukur for having extended their help. They also thank Dr. M.B. Nadoni and K.S. Kumar for their valuable suggestions and also acknowledge Sr. Mallesh, SSIT, for providing laboratory facilities.
References
1. Dario Sacco, Marco Affi, Marina De Maio and Carlo Grignam, American J of Env. Sciences., (2007) 3(3): 117.
2. Deepshiksha Garg, Singh R.V and Sunita Goyal. Indian J. Environ and Ecoplan, (2007) 14(1-2): 131.
3. Meena Kumari H.R and Hosmani S.P., Indian J. Environ and Ecoplan, (2003)7(1): 79.
4. Naidu, R.P., Environmental Health, Indian J. Public Health., (1998) 32: 70.
5. Rocchini R and Swain L. G., The British Columbia Water Quality Index. Water quality branch, Environmental protection department, British Columbia, Ministry of Environment, Lands and Parks, B.C., 13 (1995).
6. Canadian Council of Ministers of the Environment (2001) and Canadian Environment Quality Guidelines (1999).
7. APHA AWWA WEF: Standard Methods for Examination of Water and Waste water treatment 19th edition, Washington D.C. (1995).
8. Trivedy R.K and Goel P.K., Chemical and Biological Methods for Water Pollution Studies, Environmental publication, Karad, India (1986).
9. WHO, Environmental Health Criteria 3. WHO, Geneva (1977).
10. Akia Tomodia, Akira Tsuji and Yashimasa Yoneyama. Biochem. J., (1981) 193, 169.
11. Alam Finan, Peter Keenan, Fances O'Donovan, Philip Mayne, John Murphy., (1998) BMJ 317: 1138.
12. Gupta, A.K. and Saxena G.C., Poll. Res., (1997) 16(3): 155.
13. Michael Connett, Kidney and Liver damage found in Fluoride-exposed children, (2006) Issue 30.
14. Grandgean P and Landrigan P., The Lancet, (2006) 368: 2167.
15. Imo T S., Oomori R, Toshiko M and Tamaki F., Int. J. Enivron. Sci. Tech., (2007) 4(4): 421.
16. Guru Prasad B., Nature Environment and Pollution Technology, (2005) 4(4): 521.
17. ICMR, Manual of Standards of Quality of Drinking Water Supplies, ICMR, New Delhi (1975).
18. Adnan Siddiqui, Shahid Naseem and Talha Jaleel. Journal of Applied Sciences., (2005) 5(7): 1260.


