Seasonal and Temporal variations in physico-chemical and bacteriological characteristic’s of river Ganga in Varanasi
Archana Mishra1 * and B.D. Tripathi2
1
Pollution Ecology Research Laboratory, Department of Botany,
India
2
Centre of Advance study,
Banaras Hindu University,
Varanasi,
221 005
India
http://dx.doi.org/10.12944/CWE.2.2.08
Various physico- chemical characteristics of the river Ganga in Varanasi were studied in the Oct 2006 to Nov 2007. Ecological parameters like dissolved oxygen(DO), pH, nitrate(NO3-), PO4³- and bacterial population were analyzed and compared with standard permissible limits to asses the best designated use of the river water for various purposes. Study revealed that the water quality at Varanasi was not safe for human use. Result shows that Fecal coliform (20.9×10³/100ml), Fecal streptococci (93/100ml), Total bacterial density (1.43×10³/L), Total coliform (25.4×10³/100ml) Escherichia coli (6.9×10³/100ml) and Clostridium perfringens (396/100ml ) were substantially high and much beyond the permissible limit of ISI and WHO. The river in Varanasi upstream was of better quality whereas the Varanasi downstream stretch was polluted as indicated by very low DO and high bacterial density. Some pathogenic bacteria Actinomyces sp., Aerobacter aerogenes, A. Cloacae, Micrococcus sp., Salmonella sp., Staphylococcus aureus, Bacillus sp. and Shigella sp. that indicate the higher level of fecal contamination in water. These untreated water sources are used for drinking and domestic purposes and pose a serious threat to the health of the consumers and therefore calls for urgent intervention by government.
Copy the following to cite this article:
Mishra A, tripathi B.D. Seasonal and Temporal variations in physico-chemical and bacteriological characteristic’s of river Ganga in Varanasi. Curr World Environ 2007;2(2):149-154 DOI:http://dx.doi.org/10.12944/CWE.2.2.08
Copy the following to cite this URL:
Mishra A, tripathi B.D. Seasonal and Temporal variations in physico-chemical and bacteriological characteristic’s of river Ganga in Varanasi. Curr World Environ 2007;2(2):149-154. Available from: http://www.cwejournal.org/?p=667
Download article (pdf) Citation Manager Publish History
Introduction
Rivers have been used by man since the dawn of civilization as a source of water, for food, for transport, as a defensive barrier, as a source of power to drive machinery, and as a means of disposing of waste. Rivers water finds multiple uses in every sector of development like agricultural, industry, transportation, aquaculture, public water supply etc. The growing problem of degradation of our river ecosystem has necessitated the monitoring of water quality of various rivers all over the country to evaluate their production capacity, utility potential and to plan restorative measures.(Datar et al., 1992, Das et al., 1993) The Ganga River is one of the most sacred river in India is being polluted by many sources. The main sources of pollution of river Ganga at Varanasi are industrial effluents, domestic sewage and cremation of dead bodies (Tripathi et al., 1986). At Varanasi 190 MLD of domestic sewage and 80 MLD untreated sewage and industrial effluent along with excreta by human being and various warm blooded animal are directly or indirectly discharged into the river ganga which have adversely affects the physicochemical and biological quality of river. Approximately 60,000 human dead bodies and about 15,000 incomplete burnt dead human and animal bodies annually dumped in the river. In addition to this variety of other human activities also contributes significantly increase the bacterial concentration in the river. Many of these bacteria are pathogenic and spread the disease like typhoid, paratyphoid, gastroenteritis. Surface waters may play an important role in the transmission of pathogenic agents discharged through feces.
Prevention of river pollution requires effective monitoring of physicochemical and microbiological parameters (Bonde, 1977, Ramteke et al., 1994). DO and BOD is used to state the pollution status of aquatic system. Nevertheless, the concentration of DO in water always is a reliable factor to indicate the pollution state of aquatic system (Voznaya, 1983). Redox potential (Eh) and Oxidation Reduction Index (rH2) is one of the important indicators of pollution state of river. Redox potential is considerably influenced by the ambient temperature and hydrogen ion concentration. A positive Eh value results from a state tending towards oxidation, while a negative Eh indicates a system causing reduction (Sinha, 1995). The Eh considered as useful physical parameters that governs several microbial processes (Lynch et al., 1988). Water with an Eh lower than the 0.1 to 0.2 V is generally called reducing (Mortimer, 1942). In natural water and mud, the apparent potential difference is usually between -0.1V (oxygen free) and +0.5V (oxygen saturated). Water saturated with oxygen should have a value of about 0.8V. (Golterman, et al .,1978) The oxidation-reduction index (rH2) used to assess the pollution status in aquatic system. Negative correlation between the rH2 and the BOD (Gautam et al., 1989) showed the higher pollution state in the river.
Oxidation-reduction index (rH2) is calculated by computing the Eh and pH of the water bodies following the equation
rH2 = Eh /0.029 + 2pH
The neutral point of rH2 is assumed 28.00(Voznaya, 1983). Low than 28.00 indicate a pollution state. In aquatic body, low values of Eh and rH2 values increase the growth and multiplication of aerobic microorganism. Detection and enumeration of indicator organism are of primary importance for the monitoring of sanitary and microbiological quality of water (Gunnison, 1999: Kataria et al., 1997).
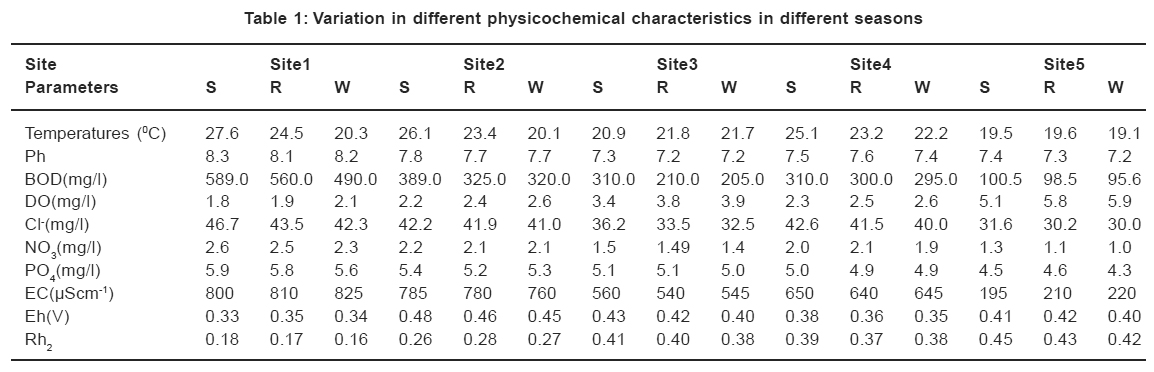 |
Table 1: Variation in different physicochemical characteristics in different seasons Click here to view table |
The bacterial growth also regulated by physico-chemical quality of water. The elevated turbidities are often associated with the possibility of microbiological contamination as high turbidity makes it difficult to disinfect water properly (Van Loon, 1982; Quality of Domestic Water Supplies, 1998). Coliforms are the major microbial indicator of monitoring water quality (Brenner et al, 1993, Grant, 1997). Total Coliform (TC) and fecal coliform (FC) counts are the most widely used bacteriological procedures for assessment of the quality of drinking and surface waters (Mcdaniels. et al, 1985).The TC bacteria test is a primary indicator of potability, suitability for consumption of drinking water. It measures the concentration of TC bacteria associated with the possible presence of disease causing organisms(Craun,1978) FC are selected members of the coli form group of bacteria are fairly specific for the feces of warm blooded animals and are commonly used as indicators of feacal pollution in waters such as waste water effluents, rivers and raw sources of drinking water supplies (Geldraich,1978) Variety of human activities contributes significantly to raising the bacterial concentration in the river. Many of these bacteria are pathogenic and agents of diseases like typhoid, paratyphoid, gastroenteritis, dysentery, diarrhea, etc (LeChevellier and Mc Feters, 1985, Kumar, 1992). In the present study, an attempt has been made to assess the impact of seasonal changes on concentration of pathogenic and nonpathogenic bacteria and impact of the different pollutants discharged into river water, as well as to explore the relative pollution states of the river Ganga.
Material and Methods
Sampling Area
Study area covered in the urban fringe area of Varanasi city, situated in the Eastern Gangetic plain (82° 15’E to 84° 30’E and 24° 35 ’N to 25° 30’N) of Northern India. Total five sites, namely Raj Ghat (site1), Assi ghat (site2), Harischandra Ghat (site3), Shiwala Ghat (site4) and Samne Ghat ( site5) were selected for river quality monitoring. Each site was reasonably representing the water quality of the river system. The first site is most polluted and receives much of the sewage of the town. Site 2, 3, and 4 are fall in midstream region. Site 5 is located in the area of relatively low river pollution and upstream of the Varanasi city.
Sampling
Water samples were collected in Jan, March, May, July, Sept, Nov across in the river width at all the 5 sites with a view to monitor changes caused by anthropogenic sources. Sampling, preservation and transportation of the water samples to the laboratory were as per standard methods (APHA, 1998). All samples were transported in cold packs to the laboratory and were analyzed within 7h of collection. The pH was determined by a portable pH meter at a collection site immediately after sampling since the biological and chemical reactions between the atmosphere and the sample could readily alter the pH (Hutton, 1983). The Eh was determined through the following equation.
Eh = E0 –0.058 pH + 0.0145 logpo2 where E0 is the standard electrode potential and a function of pH; PO2 is the partial pressure of the oxygen dissolved in water (Voznaya, 1983).
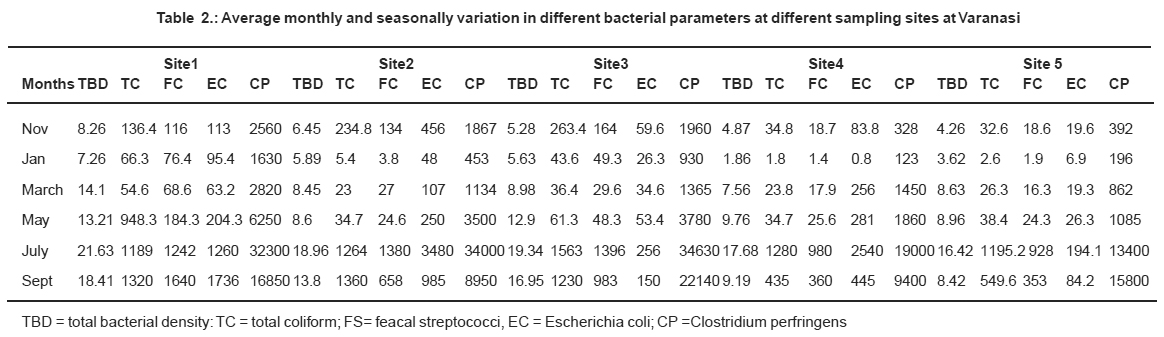 |
Table 2: Average monthly and seasonally variation in different bacterial parameters at different sampling sites at Varanasi Click here to view table |
Enumerations and Isolation of Bacterial Species
For bacterial analysis samples were collected in sterile bottles at each site and were kept cold ice packed cooler boxes in the field where, possible, being returned to laboratory for analysis as soon as possible. In bacterial analysis, Hi media were used. Qualitative analysis was carried by multiple tube fermentation technique (APHA, 1998) for members of the coliform group. Coliform were detected by presumptive inoculation into tubes of MacConkey broth and their incubation at 37±20C for 48h Gram characters were also observed by gram staining. MPN of coliform were found in terms of index/100 ml by using standards tubes. For confirmation of indicator bacterial species other test tubes like IMVic, fermentation, VP, nitrate, reductase, oxidase, catalase, citrate, H2S tests etc were performed by using specific media and indicators( Sirockin and Cullimore, 1969, WHO 1985, APHA, 1998).
Results and Discussion
The physico-chemical analysis carried out from the different site during different season has been presented in Table 1. Temperature is the most important factor, which influences chemical, physical and biological characteristics of water bodies. A study revealed that temperature varied from 20.3 to 27.6 where maximum at Site 1 and minimum at Site 5. Similar pattern were observed for Electric Conductivity. The pH values did not show remarkable differences between sampling sites and ranged 7.1 to 8.3. The value of DO is remarkable in determine the water quality criteria of an aquatic system. In the system where the rates of respiration and organic decomposition are high, the DO values usually remain lower than those of the system, where the rate of photosynthesis is high. The mean value of the dissolved oxygen ranged between 1.8 to 5.9 mg/L. Highest DO at the Site 5 where minimum discharge of effluent and human activities. Lowest DO at the Site 1 where maximum discharge of sewage effluent from the town. In opposite BOD is minimum at Site 5 and maximum at Site 1 followed by Site 2, 4 and 3. The nitrate concentration were high ranging from 1.0 to 2.6 mg/L. Highest mean concentration were observed at sampling Site 1 and Site2 ( 2.6 and 1.58 mg/L respectively). Plotting the monthly values of nitrate concentration verses time, maxima at the end of winter and during the summer are obtained (Vega et al, 1998). The highest concentration was probably partially a result of rainfall, washing out nitrate from fertilizers. Same pattern were also observed for phosphate. PO4 values in river Ganga ranged between 3.56 to 5.79 mg/L where maximum value in sampling site 1 followed by Site2 and 4. Average concentration of PO4 is 3.9, which is considered as the lower limit for river waters to pose a risk of Eutrophication (Mourkidas etal, 1990). Table 1 showed the value of Eh and rH2 at different Sites. In natural water might have a range from -0.1 V (oxygen free) to + 0.8V (oxygen saturated). The neutral point of Eh in natural water might be taken as +0.35V [0.5(0.8V-0.1V)] the value below this would indicate a pollution state. Present study revealed that Ganga water in a reducing state (Eh always remained above +0.2V). The rH2 is an objective characteristic of the process occurring in a given body of water (Voznaya, 1983). At almost Site values of rH2 in river Ganga, have lower than 28, which point the pollution in river. The addition of organic matter in it increased the concentration of the reduced from and lowered the ambient Eh and rH2 values. Bacteria are the chief decomposer and indicator of organic pollution. Table2. Showed the bacterial concentration (TBD, FC, EC, TC, and CP) at different Sites and season. Total bacterial density (TBD) where maximum at Site 1. Bacterial population had affected by seasonal variations. Maximum concentration of (TBD, TC, FC, EC, and CP) was found in July due to favorable temperature, high turbidity and addition of more sewage and feacal matter through surface runoff. Low bacterial concentration during January because of lowest water temperature and comparatively low input of organic matter. The irregular variation in the coliform bacteria due to seasonal change also corroborated the finding of (Legendra et al., 1984, Barcina, 1986 and Ramanibai, 1996).
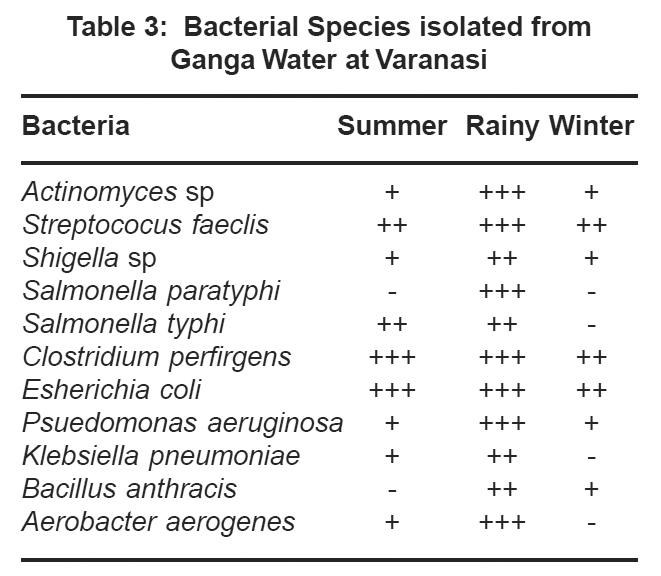 |
Table 3: Bacterial Species isolated from Ganga Water at Varanasi Click here to view table |
Total bacterial count can be a reliable indicator of water quality since the number of bacteria present depends upon the degree of contamination (Bilgrammi, 1998). The quantitative values of bacteria were invariable highest at Site 1 followed by 2, 4, 3 and 5 due to the discharge of sewage along with human and animal excreta and hospital refuge, open defecation near bank, allowing of cattle and other human activities. Bacterial population concentration has been noted to be directly related with the outbreaks of water borne diseases (Muller et al, 1977).
Coliform bacteria are reliable indicator of organic pollution because they are unable to survive in clean water beyond a limited time (Rai and Hill 1978, Hiraishi et al., 1987) Table 2 showed the different concentration range of coliform, FC, E.coli and CP at different months. FC group is supposed to be more reliable indicator of feacal pollution of water than E. coli (Kennar, 1978) because they are unable to multiply outside the body of human and other warm blooded animals(Mathur and Ramanathan 1966) and also because their survival is more prolonged in surface water than other coliform types (WHO, 1991). Clostridium perfringens is an important bacterial species, which sporulate in nature and survive in water for a comparatively longer period as compared to other feacal bacteria. Their presence in river water is an indicator of feacal contamination of remote time (Droop and Jannash, 1977, Sinha and Banerjee, 1987). Table 3. Showed the qualitatively 11 bacterial species were identified from the Ganga River at Varanasi. Maximum bacterial species were prominent in rainy season because organic matters enhance the bacterial growth and multiplication. E.coli is prevalent in every season. The existence of other members of FC group (Klebesiella, Enterobacter) has been reported for the nonfeacal origin (Alonso et al, 1998). Presence of pathogenic bacteria like Actinomyces, Proteus vulgaris, Pseudomonas aerogenosa, Salmonella typhi, S. paratyphi, Staphylococcus in water may cause acute to severe disease on getting suitable host and condition.
Conclusion
The river Ganga which is holiest river of India is frequently used for different purposes. Present study revealed the high level of bacterial population and Eh and rH2 indicate pollution state of river Ganga. The concentration of different physico chemical and bacterial parameters is much beyond the permissible limit prescribed by WHO. Hence, direct consumption of untreated Ganga water and bathing in the Varanasi reason is at high risk for human health
References
-
Alonso, J. L., Soriano, A., Amoros, I., and Ferre, M.A., ‘Quantitative determination of Escherichia coli and fecal coliforms in water using a chromogenic medium’, J. Envir. Sci. Health., (1998) A33(6): 1229 1248.
-
American Public Health Association (APHA), Standard Methods for the Examination of Water and Wastewater, 19th ed., Washington, DC (1998).
-
Barcina, I., ‘Factors affecting the survival of Escherichia coli in a river’, Hydrobiologia., (1986) 141: 249-253.
-
Bilgrami, K. S., and Kumar, S. Bacterial contamination in water of the River Ganga and its risk to human health. International J. Envir. Health Res., (1998) 8: 5-13.
-
Bonde, G. J., ‘Bacterial indication of water pollution advances in aquatic microbiology’, in: M. R. Droop and H. W. Januasch (eds), Academic Press, London and New York, (1977) pp. 273-364.
-
Brenner, K. P., Rankin, C. C., Roybal, Y. R., Jr. Stelma, G. N., Scarpino, P. V. and Dufour, A. P. ‘New medium for the simultaneous detection of total coliforms and Escherichia coli in water’, Appl. Environ. Microbiol., (1993) 59: 3534–3544.
- Craun, G. F., ‘Impact of the coliform standard on the transmission of disease’, in: C. W (1977).
- Datar, M.O. and Vashistha, R.P. Indian J. Envir. Protec., (1992) 12: 577.
-
Das, N.K and Sinha, R.K. India Environmental and Ecology., (1993) 11: 829
-
Droop, M.R. and Jannasch, H.W. Advances in aquatic Microbiology. London: Academic Press.
-
G. Sirockin and S. Cullimore, Practical Microbiology, McGraw-Hill, London (1969).
-
Gautam, A. Singh, H.R. and Sati, O.P. Seasonally variation of certain oxidation-reduction characteristics of river Bhagirathi (India) Proc. Ind. Natn. Sci. Acad., (1989) 55, 111-114
-
Geldreich, E. E., ‘Bacterial population and indicator concepts in feces, sewage, storm water and solid wastes’, in: G. Berg (ed), Indicators of Viruses in Water and Food, Ann Arbor Science, Ann Arbor, Mich. (1978) pp. 51-97.
-
Golterman, C.H, Clyma, R.S. and Ohnstad, M.A.M., Methods for Physical and Chemical Analysis of Fresh Waters. IBP Handbook 8. Blackwell Scientific Publication, Oxford, 213p (1978).
-
Grant, M. A., ‘A new membrane filtration medium for simultaneous detection and enumeration of Escherichia coli and total coliform’, Appl. Envir. Microbio., (1997) 63: 3526–3530.
-
Gunnison, D., ‘Evaluating Microbial Pathogens in Reservoirs. Water Quality Technical Notes Collection (WQTN PD-03)’, US Army Engineer Research and Development Center, Vicksburg (1999).
-
Hendricks (ed), Evaluation of the Microbiology Standards for Drinking Water, U.S. Environmental Protection Agency, Washington, DC, (1978) pp. 21–35.
-
Hiraishi,A., Saheki, K. and Horie, S. Relationship of total coliform, faecal coliform and organic pollution levels in Tamagawa river. Bulletin of Japanese Society of Scientific Fisheries. (1984) 50(6): 991-997.
-
Hutton, L.G; Field testing of water in developing countries,( Water Research Center, Medmenham laboratory, England (1983)
-
ISI. Indian Standard Methods of Sampling and Microbiological Examination of Water. New Delhi: Indian Standard Institution (1982).
-
Kataria, H. C., Iqbal, S. A. and Shandilya, A. K, ‘MPN of total coliform as pollution indicator in halali river water of Madhya Pradesh India’, Pollut. Res. (1997) 16(4): 255–257.
-
Kennaer,B.A. Faecal strptococoi indicators. In indicators of virus in water and food (G.Berg. eds), Ann Arbor, MI: Ann Arbor Source (1978).
-
Kumar, S. Heavy Metal pollution in Ganga River sediment U. P.: A preliminary report. In I. B. Singh (Ed.), Gangetic Plain: Terra Incognita. Lucknow: Geology Department, University of Lucknow. (1992) 59–66
-
Le Chevellier, M.W and Mc Feters, G.A. Interaction between heterotrophic plate count bacteria and coliform organism. Appl. Envir. Microbio., (1985) 49: 1338-41.
-
Legendre, P., Baleux, B. andTroussellier, M., ‘Dynamics of pollution indicator and heterotrophic bacteria in sewage treatment lagoons’, Appl. Envir. Microbio., (1984) 48, 586–593.
-
Lynch, J.M and Hobbies, J.E (EDS), Microorganism in action: concepts and application in microbial ecology, Blackwell Scientific Publication, London ( 1978).
-
Mathur, R.P. and Ramanathan, K.N. Significance of enterobacteria as pollution indicator. Envir. Health., (1966) 8(1): 1-5.
-
Mcdaniels, A. E., Bordner, R. H., Gartside, P. S., Haines, J. R., Conner, K. P. and Rankin, C. C., ‘Holding effects on coliform enumeration in drinking water samples’, Appl.Envir. Microbio., (1985) (1999) 50, 755–762.
-
Mortimer, C.H; The exchange of dissolved substances between mud and water in lakes. J. Ecol, (1942) 30: 147-201
-
Muller, G., Grimmer, G. and Bohnke, H. Sedimentary record of heavy metals and polycyclic aromatic hydrocarbon in Lake constance, Naturwissenschaften. (1977) 64: 427-31.
-
N.F. Voznaya, Chemistry of Water and Microbiology, Mir Publishers, Moscow Quality of Domestic Water Supplies, Assessment Guide 1, 2nd ed., Department of Water Affairs and Forestry, Department of Health and Water Research Commission (1983)
-
Ramanibai, R. ‘Seasonal and spatial abundance of pollution indicator bacteria in Buckingham canal madras’, Indian J. Environ. Prot., (1996) 17(2): 110–114.
-
Ramteke, P. W., Pathak, S. P., Bhattacherjee, J. W., Gopal, K. and Mathur, N., ‘Evaluation of the presence-absence (P-A) test. A simplified bacteriological test for detecting coliform in rural drinking water of India’, Environ. Monit. Assess. (1994) 33: 53-59.
-
Singh,K.P; Amrita Malik and Sarita Sinha, Water quality assessment and apportionment of pollution sources of Gomti river(India) using multivariate statistical techniques- a case study, Analytica Chemica Acta., (2005) 538: 355-374.
-
Sinha, S. N., and Banerjee, R. D., Pollution indicators and impact assessment of pollutants discharged into the River Ganga. Inter. J. Envir. Studies, (1995) 48: 231–244.
-
Tripathi, B.D., Sikandar M. Shukla and Suresh C; Physico chemical characterization of city sewage discharged into river Ganga at Varanasi, India. Envir. Inter., (1999) 17.
-
Van Loon, J. C., Chemical Analysis of Inorganic Constituent of Eater, CRC Press, Boca Raton (1982).


