Carbon Footprint Comparative Analysis in a Slum and a Gated Community in Chennai, India
J S Sindhu
*
 and D Abhirami
1
Department of Economics,
Agurchand Manmull Jain College,
Chennai,
Tamil Nadu
India
http://dx.doi.org/10.12944/CWE.20.3.13
Copy the following to cite this article:
Sindhu J, Abhirami D. Carbon Footprint Comparative Analysis in a Slum and a Gated Community in Chennai, India. Curr World Environ 2025;20(3). DOI:http://dx.doi.org/10.12944/CWE.20.3.13
Copy the following to cite this URL:
Sindhu J, Abhirami D. Carbon Footprint Comparative Analysis in a Slum and a Gated Community in Chennai, India. Curr World Environ 2025;20(3).
Download article (pdf)
Citation Manager
Publish History

Introduction
The escalating impacts of climate change have intensified global concerns about carbon emissions, particularly in urban areas where population density and consumption rates are high.12,14
In the Indian context, the state of Tamil Nadu—and particularly the city of Chennai—has undergone rapid urbanization, leading to a surge in energy demand, vehicular traffic, and solid waste generation.5 These changes have created stark contrasts in living conditions, infrastructure availability, and consumption behaviour across different socio-economic groups within the same city. Despite these developments, research examining micro-level, income-based variations in household carbon emissions within urban India remains limited.27
Most existing studies focus on national or regional aggregates, often overlooking intra-urban disparities between low-income settlements and high-income residential enclaves. As a result, there is insufficient empirical evidence on how income, infrastructure, and lifestyle jointly influence household carbon footprints in Indian cities. This study seeks to bridge that gap by comparing the household carbon footprints of two socio-economically distinct communities in Chennai: Saidapet Slum, representing a low-income group, and Olympia Gated Community in Pallavaram, representing a high-income enclave. By analysing differences in energy consumption, transportation patterns, waste management practices, and environmental awareness, the study provides a comparative perspective on how socio-economic status shapes household-level emissions.
The findings aim to contribute to urban sustainability discourse by highlighting the need for climate policies that go beyond income-based classifications and instead address infrastructural constraints, behavioural dimensions, and equity considerations in urban climate action.²?
Study Objectives and Research Questions
The primary objective of this study is to estimate the average household carbon footprint in both communities by analysing key areas of consumption, namely energy use, transportation, and waste management. Additionally, the research aims to understand how income levels influence carbon emissions and to assess the awareness and willingness of households to adopt environmentally friendly practices.
To achieve these objectives, the study seeks to answer the following research questions: What is the estimated carbon footprint of households in the two selected communities? How does income level correlate with variations in household emissions? What is the degree of awareness among residents about carbon emissions and sustainable practices? Finally, are households in higher- or lower-income groups more inclined to adopt eco-friendly behaviours?
Literature Review
Household carbon footprints have emerged as a critical area of study, particularly in the context of rising urbanization and socio-economic disparities. Global literature highlights a strong correlation between income levels and household emissions. Sager25 and Chancel6 found that affluent households, especially in high-income nations, emit significantly more due to increased energy consumption and private vehicle use. These findings are supported by input-output and life-cycle assessment models that attribute a large share of residential emissions to heating, cooling, and transport behaviours of wealthier populations.
In the Indian context, studies by Owen and Barrett21 and Arora et al.² reaffirm that higher-income households, particularly in urban areas, exhibit larger carbon footprints due to lifestyle choices involving energy-intensive appliances and private transportation. Research by the Centre for Sustainable Systems³ also emphasizes the contribution of food and solid waste to emissions, calling for composting and decentralized waste management. Regional studies in Tamil Nadu reinforce these findings. Reports by the Confederation of Indian Industry7 and the Institute for Social and Economic Change10 reveal that urban energy use and vehicular emissions, particularly in affluent neighbourhoods, are major contributors to household carbon output.
Existing literature also underscores the role of energy, transport, and waste in shaping household emissions. Adnan et al.¹, Wang et al.31, and Liu and Lin18 highlight the environmental impact of inefficient waste disposal, reliance on fossil fuels, and lack of clean energy adoption. These studies advocate energy-efficient technologies, public transport systems, and localized waste treatment as key mitigation strategies. Similarly, Sharma et al.26and Singh and Patel29 point to behavioural shifts and urban planning interventions as effective levers for emission reduction.
Awareness and willingness to adopt eco-friendly practices are crucial in this context. Lee et al.17 and Khan et al.15 demonstrate that education and public awareness campaigns positively influence sustainable behaviours. Johnson et al.13 and Miller and Carter19 suggest that policy instruments, such as financial incentives and public engagement initiatives, can enhance green behaviour adoption. Studies by Park et al.22 and Roberts et al.24 further stress that infrastructure and cultural context significantly shape environmental choices at the household level.
Finally, the relationship between income and emissions is central to many studies. Smith et al.30Green et al.9, and Kim and Roberts16 emphasize that carbon footprints escalate with wealth, driven by higher consumption and mobility. These studies advocate progressive taxation, targeted subsidies, and stricter regulation of carbon-intensive goods to promote equity in climate action.
Overall, the literature establishes a clear pattern: household emissions are closely linked to income, infrastructure, and behaviour, while minimum material requirements for achieving decent living standards also play a crucial role in shaping household consumption patterns.²³ However, limited studies exist comparing carbon footprints across intra-urban socio-economic categories using household-level consumption-based approaches, particularly between high-income gated communities and low-income slum areas.³²
Materials and Methods
This study was conducted in two socio-economically contrasting residential areas of Chennai, India: Saidapet Slum, representing low-income households, and the Olympia Grande Gated Community in Pallavaram, representing a high-income group. A total of 100 households were surveyed, comprising 50 households from each area. Stratified random sampling was employed to ensure representation across different income levels within each community, thereby improving the comparability of the two study areas.
Primary data were collected using structured questionnaires administered through face-to-face interviews. The questionnaire captured information across three key domains contributing to household carbon emissions: energy consumption, transportation patterns, and waste management practices. Energy consumption included electricity usage and cooking fuel consumption. It is important to note that households in Saidapet Slum primarily relied on subsidized Liquefied Petroleum Gas (LPG) supplied under the Government of Tamil Nadu’s Public Distribution and welfare schemes, while the use of alternative fuels such as firewood or kerosene was minimal. In contrast, households in the gated community reported higher LPG consumption along with electricity-intensive appliances. Transportation data included modes of transport (public transport, two-wheelers, and shared vehicles) and frequency of travel. Fuel use in the study refers exclusively to transport-related fuels (petrol and diesel) and not to cooking fuels, thereby clarifying the distinction between “fuel” and “LPG” as shown in Table 1 and Figure 1. Waste management practices covered segregation, recycling, composting, and rainwater harvesting. While formal recycling infrastructure is limited in slum areas, informal recycling and household-level composting practices were observed and documented based on respondent reporting. A reduction factor of up to 50% in waste-related emissions was applied only to households that reported active composting or recycling practices, irrespective of settlement type. Participation was voluntary, and informed consent was obtained from all respondents prior to data collection.
Household carbon footprints were estimated using standard emission factors drawn from published literature and government sources. Emissions were calculated on a monthly basis to ensure uniformity across households and to facilitate comparison between the two study areas. To examine differences in mean carbon footprints between the two communities, Welch’s t-test was employed. This test was selected instead of the conventional independent samples t-test because it does not assume equal variances between groups and is more appropriate for samples with unequal variance and heterogeneous socio-economic characteristics. In addition, Pearson’s correlation analysis was used to assess the relationship between household income and carbon footprint within each study area. Pearson’s correlation coefficient was considered suitable as both variables are continuous and the analysis aims to measure the strength and direction of their linear relationship.
Secondary data from government reports, peer-reviewed journals, and environmental databases were also consulted to provide contextual support and to validate the emission factors used in the analysis. All statistical analyses were carried out using standard analytical tools, and results were interpreted at conventional levels of statistical significance.
Carbon Footprint Calculation Methodology
The carbon footprint of each household was calculated using a widely recognized formula:
![]()
Here, activity data represent the quantity of resources consumed, such as electricity in kilowatt-hours (kWh), fuel in litres, food in kilograms, waste in kilograms, and water in litres. Emission factors correspond to the standard CO2 emissions associated with each unit of consumption. These factors were sourced from reputable institutions, including the Intergovernmental Panel on Climate Change10, the Central Electricity Authority 4, the Food and Agriculture Organization 7, and the World Resources Institute 33.
Emissions were estimated across five key sectors
Energy Consumption
Electricity emissions were calculated using a factor of 0.82 kg CO2/kWh 4. Cooking-related emissions were estimated using an LPG emission factor of 2.98 kg CO2 per kg11. Kerosene use, where reported, was accounted for using standard fuel-specific emission factors.
Transportation
Emissions from private vehicles were calculated using fuel-specific emission factors—2.31 kg CO2/litre for petrol and 2.68 kg CO2/litre for diesel33. Shared and public transport emissions were adjusted on a per-passenger basis.
Food Consumption
Emissions related to dietary intake were calculated using the following factors: 27 kg CO2/kg for red meat, 6.9 kg CO2/kg for poultry, and 1.2 kg CO2/kg for rice8. These food categories were selected based on reported household consumption patterns.
Waste Generation
Emissions from landfill waste were estimated at 1.5 kg CO2/kg. While a theoretical reduction of up to 50% is reported in the literature for households practicing recycling and composting33, this reduction was applied only to households that explicitly reported such practices. In slum areas, where formal recycling and composting were limited, no blanket reduction was assumed.
Water Usage
Water-related emissions were estimated using a factor of 0.001 kg CO2 per litre, accounting for the energy required for pumping and treatment 20.
This multi-sectoral model offers a comprehensive and adaptable framework for quantifying household carbon emissions within urban environments.
Statistical Analysis
Descriptive statistics were employed to summarize the emission levels across different categories. To compare the average carbon footprints between the two communities, Welch’s t-test was used, given its suitability for datasets with unequal variances. Additionally, Pearson’s correlation coefficient was calculated to explore the relationship between household income and carbon footprint levels.
This methodological approach provides a robust basis for understanding the interplay between socio-economic factors and household carbon emissions in an urban Indian context.
Results and Analysis
Estimation of Household Carbon Footprint
This study estimated the average monthly carbon footprint of households in two contrasting socio-economic communities of Chennai: Saidapet Slum and Olympia Grande Gated Community. Emissions were calculated across five consumption sectors: electricity, cooking fuels (LPG and kerosene), water usage, transportation, and meat consumption. The calculations adhered to the IPCC guidelines, applying sector-specific emission factors to household-level consumption data.
The total household emissions (expressed in kg CO2e) were calculated using the formula:
![]()
Where each term corresponds to emissions from respective sources, such as electricity, fuel, LPG, water, and meat consumption. Data on electricity usage was captured in kilowatt-hours, LPG in kilograms, and water and meat consumption in litres and kilograms, respectively.
Table 1 summarises the average monthly carbon footprint per household in each community, along with its primary emission contributors.
Table. 1: Estimated Monthly Carbon Footprint per Household (Kg CO2e).
Community | Average Monthly Carbon Footprint (kg CO2e) | Primary Emission Contributors |
Saidapet Slum | 267.15 | Electricity and meat consumption |
Olympia Grande | 398.35 | Electricity, fuel, and meat consumption |
Source: Field Survey
The analysis reveals clear differences in household carbon footprints between the two study areas. The average monthly carbon footprint of households in Olympia Grande Gated Community was estimated at 398.35 kg CO2e, while households in Saidapet Slum recorded a lower average of 267.15 kg CO2e. This variation reflects differences in income levels, consumption patterns, and access to infrastructure.
Comparative Analysis of Carbon Emissions by Category
To explore emissions by resource category, Figure 1 presents a comparative visualisation of total emissions across electricity, fuel, LPG, water, and meat.
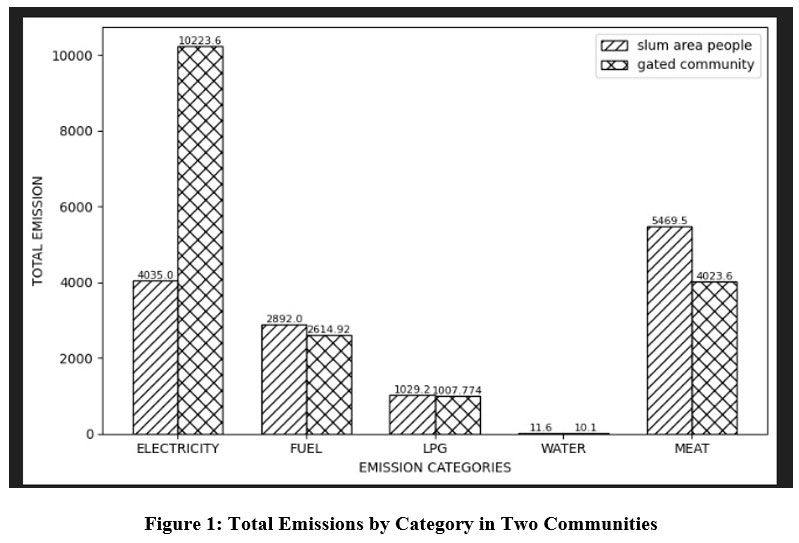 | Figure 1: Total Emissions by Category in Two Communities
|
Figure 1 illustrates that Olympia Grande households generated notably higher emissions from electricity consumption (10,223.6 kg CO2e) compared to Saidapet Slum (4,035 kg CO2e), indicative of energy-intensive lifestyles. Conversely, meat consumption-related emissions were surprisingly higher in Saidapet Slum (5,469.5 kg CO2e) than in the gated community (4,023.6 kg CO2e), potentially reflecting dietary preferences and affordability. LPG and water-related emissions were similar across both groups, while fuel emissions were slightly higher in the slum area, possibly due to reliance on less efficient or informal transport options.
These findings highlight that household carbon footprints are shaped not just by income levels but by complex interactions of lifestyle choices, infrastructure availability, and cultural practices. While gated communities contribute higher emissions through electricity and energy consumption, lower-income households also show notable footprints due to factors like meat consumption and transport inefficiencies. This analysis sets a comprehensive baseline for understanding the environmental impacts of urban household behaviours, paving the way for further exploration of socio-economic and behavioural dimensions in the following sections.
Income and Carbon Footprint Correlation
This section examines the relationship between household income and carbon footprint levels in both the Saidapet Slum and the Olympia Grande Gated Community. By analysing monthly household income alongside carbon emissions, the study offers insights into whether income disparities influence household carbon outputs.
Table 2: Pearson’s Correlation Coefficients between Income and Carbon Emissions
Area | Pearson's r | p-value | Interpretation |
Saidapet Slum | 0.437 | 0.002 | Moderate Positive Correlation |
Olympia Grande | 0.189 | 0.314 | Weak Positive Correlation |
Source: Field survey
As shown in Table 2, the relationship between household income and carbon footprint was further examined using Pearson’s correlation analysis. In Saidapet Slum, a moderate positive correlation (r = 0.437) was observed, indicating that higher-income households within the slum tend to generate higher carbon emissions. This can be attributed to increased access to electricity, motorized transport, and consumption of energy-intensive goods as income rises.
In contrast, Olympia Grande exhibited a weak positive correlation between income and carbon footprint (r = 0.189). This weak association suggests that households in the gated community display relatively uniform consumption patterns, regardless of income differences. The presence of similar housing designs, common amenities, and standardized infrastructure appears to limit variability in household emissions.
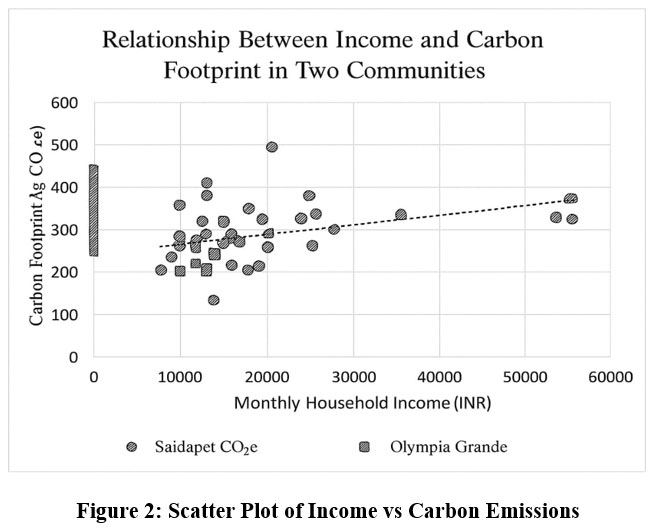 | Figure 2: Scatter Plot of Income vs Carbon Emissions
|
Figure 2 visualises the relationship between household income and carbon emissions (kg CO2e) for both communities. The data points for the Saidapet Slum exhibit a broader distribution, supporting the moderate positive correlation observed. This suggests that rising incomes in slum areas correlate with increased emissions, reflecting changes in consumption habits as income levels improve.
Conversely, data points for Olympia Grande are tightly clustered at higher income levels with uniformly high emissions, indicating that income variability does not significantly affect carbon outputs within this affluent group. The trendline for Saidapet shows an upward slope, while that of Olympia remains relatively flat, reaffirming the differential role of income in influencing emissions across socio-economic groups.
Statistical Comparison of Group Differences: Welch’s t-test
To determine whether there is a statistically significant difference in carbon emissions between the two communities, Welch’s t-test was applied. This test is particularly suitable given the unequal variances and sample characteristics of the two groups.
The test hypotheses were:
Null Hypothesis (H0): There is no significant difference in mean carbon footprints between the Saidapet Slum and Olympia Grande Gated Community.
Alternative Hypothesis (H1): There is a significant difference in mean carbon footprints between the two groups.
Table 3: Descriptive Statistics of Carbon Footprint by Community
Group | Mean (x) | Standard Deviation (S) | Sample Size (n) |
Saidapet Slum | 267.154 | 1867.274 | 50 |
Olympia Gated Community | 398.353 | 2788.474 | 50 |
Source: Field Survey.
Despite the higher mean emissions observed in the gated community, Welch’s t-test indicated that the difference in average carbon footprints between the two areas was not statistically significant (t = -0.2764, p > 0.05). This finding suggests that income alone does not fully explain variations in household carbon emissions.
Policy Implications
These insights have important implications for urban sustainability planning:
Cross-Income Sustainability Programs: Energy-efficient practices should be promoted across all income groups, ensuring that both affluent and low-income households adopt sustainable habits.
Behaviour-Focused Interventions: Instead of targeting income categories alone, policies should address household consumption behaviours that drive emissions.
Context-Specific Strategies: Tailored interventions considering infrastructural disparities and lifestyle variations can effectively address the unique challenges within different socio-economic settings.
Awareness and Adoption of Eco-Friendly Practices
The third objective of this study was to explore the extent of awareness and the adoption of eco-friendly practices among households in the Saidapet Slum and the Olympia Grande Gated Community. The investigation centred on four key sustainability practices: waste segregation, recycling, composting of organic waste, and rainwater harvesting.
As part of the study, households were asked about their awareness of and participation in eco-friendly practices. The focus was on four key sustainability measures: waste segregation, recycling, composting of organic waste, and rainwater harvesting. The responses from both the Saidapet Slum and the Olympia Grande Gated Community are presented below.
Table 4: Adoption of Eco-Friendly Practices by Households
Practice | Saidapet Slum | Gated Community | Overall |
Waste Segregation | 16 | 15 | 31 |
Recycling | 12 | 14 | 26 |
Composting | 14 | 9 | 23 |
Rainwater Harvesting | 0 | 50 | 50 |
Source: Field Survey.
Insights from the Data
The findings reveal both similarities and disparities between the two communities. Waste segregation is practiced almost equally in both areas, suggesting a basic level of awareness about proper waste management. Recycling is slightly more common in the gated community, potentially due to better access to facilities. Composting is more prevalent in the slum, reflecting traditional practices. The most notable difference is in rainwater harvesting, which is absent in the slum but significantly adopted in the gated community.
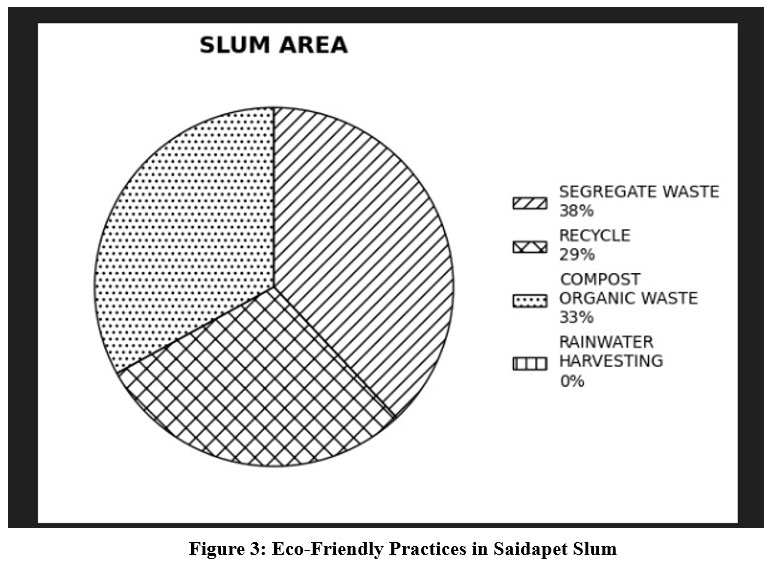 | Figure 3: Eco-Friendly Practices in Saidapet Slum
|
The pie chart in Figure 3 depicts the distribution of eco-friendly practices adopted by households in the Saidapet Slum. The data reveal that waste segregation is the most commonly practiced method, with 38% of households engaging in the separation of waste. This reflects a moderate level of awareness regarding basic waste management, even in economically constrained environments.
Recycling is practiced by 29% of households, indicating a marginal but present effort to reuse materials despite the limited availability of formal recycling facilities in the area. Composting of organic waste is slightly more prevalent, with 33% of households adopting this method. This trend can be attributed to the community’s reliance on traditional and low-cost methods of managing household waste.
Notably, rainwater harvesting is entirely absent (0%) in the slum. This absence underscores the significant infrastructural and financial barriers faced by low-income communities when it comes to implementing resource-intensive sustainability measures.
Overall, the chart highlights that the adoption of eco-friendly practices in the Saidapet Slum remains minimal and is largely shaped by socio-economic constraints and the lack of supportive infrastructure. These findings point to the need for targeted policy interventions that not only raise awareness but also provide the necessary infrastructure and support to enable the adoption of sustainable practices in low-income urban areas.
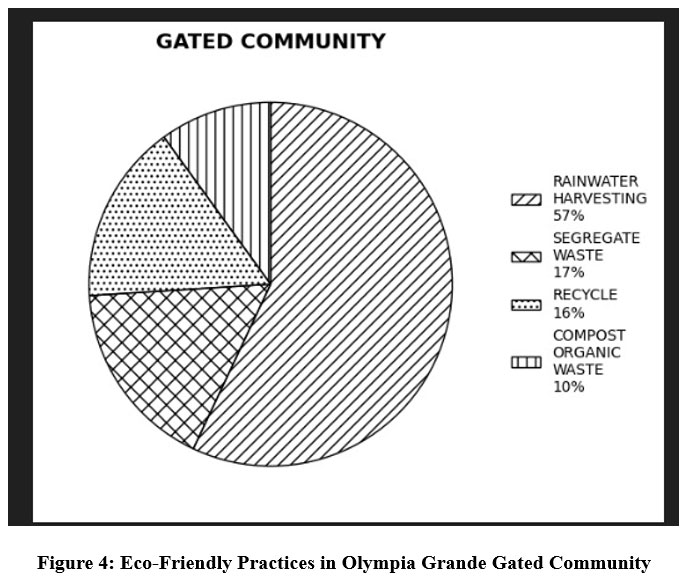 | Figure 4: Eco-Friendly Practices in Olympia Grande Gated Community
|
The pie chart presented in Figure 4 illustrates the adoption percentages of various eco-friendly practices within the Olympia Grande Gated Community. Waste segregation accounts for 15%, a figure comparable to that of the slum area, suggesting a consistent emphasis on basic waste management across different socio-economic contexts. Recycling is adopted by 14% of households, slightly higher than in the slum, reflecting better access to recycling facilities within the gated community. Composting of organic waste, however, is practiced by only 9%, indicating a relatively lower inclination towards home-based composting, possibly due to a reliance on organized waste management services. Notably, 50% of the households engage in rainwater harvesting, representing the most widely adopted practice in the community. This prevalence can be attributed to the infrastructural advantages and higher environmental awareness typically associated with gated communities. Overall, the data highlights the community’s enhanced capacity to embrace advanced sustainability measures, particularly those supported by infrastructural resources.
Infrastructure-related constraints also play a crucial role in influencing sustainable behaviour. Although slum households exhibit lower average emissions, inadequate access to waste segregation facilities, clean cooking alternatives, and energy-efficient appliances restrict their ability to adopt environmentally friendly practices. Conversely, gated communities benefit from better infrastructure but may exhibit higher absolute emissions due to lifestyle choices.
Overall, the findings highlight that urban household carbon emissions are shaped by a complex interaction of income, infrastructure, and behaviour. Policies aimed at reducing emissions should therefore move beyond income-based approaches and focus on improving infrastructure, promoting behavioural change, and implementing targeted sustainability interventions across diverse urban settings.
Discussion
The findings of this study highlight clear differences and overlaps in household carbon emission patterns across socio-economic groups in Chennai. While households in the Olympia Grande Gated Community exhibit higher average carbon footprints, primarily driven by electricity consumption and transport fuel use, the results demonstrate that income alone does not fully explain emission variability. This aligns with earlier studies suggesting that lifestyle choices, infrastructural access, and behavioural patterns play a crucial role in shaping household emissions.
Interestingly, meat-related emissions were relatively higher in the Saidapet Slum, indicating that dietary practices can significantly influence carbon footprints even in low-income settings. Similar observations have been reported in studies emphasizing the role of food consumption in household emissions. The moderate positive correlation between income and emissions within the slum further suggests that as income improves, consumption patterns shift toward more carbon-intensive activities.
The weak income- emission relationship observed in the gated community indicates relatively homogeneous lifestyles and standardized infrastructure, limiting emission variability across income brackets. These findings reinforce the argument that effective climate mitigation strategies must address behavioural and infrastructural dimensions alongside economic factors.
Policy Implications
The findings highlight the need for context-sensitive and income-responsive policy interventions to promote sustainability across socio-economic strata. In high-income gated communities, policies should incentivize the adoption of energy-efficient appliances, green building technologies, and sustainable transportation options such as electric vehicles. Financial tools like tax benefits and subsidies can drive behavioural shifts toward reducing carbon footprints.
Conversely, low-income areas such as the Saidapet Slum require robust infrastructure development, including organized waste management systems, accessible public transportation, and facilities for rainwater harvesting and recycling. These communities also benefit from financial assistance and capacity-building programs to adopt eco-friendly technologies and practices.
Additionally, targeted awareness campaigns tailored to the specific needs and capacities of each income group are essential. Community-based sustainability initiatives can further empower residents to manage resources efficiently and adopt environmentally responsible behaviours. Overall, urban planning and climate policy in Indian cities must incorporate these socio-economic considerations to build inclusive and effective pathways toward sustainability.
Conclusion
This study provides a comparative assessment of household carbon footprints in two socio-economically distinct urban settings in Chennai - a low-income slum and a high-income gated community- and highlights the nuanced relationship between income, consumption behaviour, and environmental outcomes. Although households in the gated community exhibit higher average carbon emissions due to greater energy use and consumption intensity, the findings indicate that income alone does not fully explain variations in household carbon footprints.
Importantly, the study reveals that low-income households, despite generating lower emissions, face significant infrastructural and institutional constraints that limit their ability to adopt sustainable practices. Inadequate access to reliable energy, waste management facilities, and affordable eco-friendly alternatives restrict behavioural change, even where environmental awareness exists.
These findings underscore the need for inclusive and differentiated urban climate policies that go beyond income-based targeting. Policy interventions should focus on improving basic infrastructure in low-income areas, promoting energy-efficient technologies, and strengthening awareness programmes across all income groups. By integrating infrastructural development with behavioural and policy measures, cities such as Chennai can move towards more equitable and sustainable urban development pathways. Overall, the study reinforces the importance of creating enabling conditions that allow households across socio-economic strata to participate meaningfully in climate mitigation efforts.
Acknowledgement
The authors gratefully acknowledge the Department of Economics, Agurchand Manmull Jain College, Meenambakkam, Chennai, for providing the academic environment and institutional facilities necessary to carry out this research work.
Funding Sources
The author(s) received no financial support for the research, authorship, and/or publication of this article.
Conflict of Interest
The authors do not have any conflict of interest.
Data Availability Statement
The manuscript incorporates all datasets produced or examined throughout this research study.
Ethics Statement
This research did not involve human participants, animal subjects, or any material that requires ethical approval.
Informed Consent Statement
This study involved the collection of primary data from households through a field survey. Informed consent was obtained from all participants prior to data collection. Participation in the survey was entirely voluntary, and respondents were informed about the purpose of the study. No personal identifiers were collected, and the privacy, confidentiality, and anonymity of all respondents were strictly maintained in accordance with ethical research standards applicable in India.
Permission to reproduce material from other sources
Not Applicable
Author Contributions
J.S. Sindhu – Conceptualization, Methodology, Writing – Original Draft.
D. Abhirami - Data Collection, Analysis, Writing – Review & Editing
References
- Adnan N, Nordin SM, Rahman I. Adoption of green waste management practices among households: the role of socio-economic factors. J Clean Prod. 2018;196:615-632. doi:10.1016/j.jclepro.2018.06.112
CrossRef - Arora A, Rajendran S, Kumar S. Urban household carbon footprints in India: a socio-economic analysis. Sustain Cities Soc. 2023;93:104509. doi:10.1016/j.scs.2023.104509
CrossRef - Centre for Sustainable Systems. Household Carbon Footprint in India: A Comprehensive Report. University of Michigan; 2021.
- Central Electricity Authority (CEA). CO2 Baseline Database for the Indian Power Sector, Version 20. Ministry of Power, Government of India, New Delhi, 2023.
- Chakrabarti B, Dhar S. Urban energy consumption patterns in Indian cities: policy implications for climate-resilient development. Energy Policy. 2021;156:112438. doi:10.1016/j.enpol.2021.112438
CrossRef - Chancel, L. (2022). Global carbon inequality, 2019–2020. World Inequality Lab Working Paper No. 2022/08, Paris School of Economics. https://wid.world
CrossRef - Confederation of Indian Industry. Carbon Footprint in Indian Households: Regional Assessments and Policy Implications. CII; 2012.
CrossRef - Food and Agriculture Organization of the United Nations. Greenhouse Gas Emissions from Food Systems. FAO; 2022. Accessed Month Day, Year. https://www.fao.org
CrossRef - Green J, Patel R, Thomas L. Income inequality and carbon emissions: global patterns and policy responses. Environ Policy Gov. 2022;32(1):45-58. doi:10.1002/eet.1943
CrossRef - Institute for Social and Economic Change. Urban Energy Consumption and Emissions in Tamil Nadu. ISEC; 2023.
- Intergovernmental Panel on Climate Change. 2006 IPCC Guidelines for National Greenhouse Gas Inventories. IPCC; 2006. https://www.ipcc-nggip.iges.or.jp/public/2006gl/
- Intergovernmental Panel on Climate Change. Climate Change 2022: Mitigation of Climate Change. Working Group III Contribution to the Sixth Assessment Report. IPCC; 2022. https://www.ipcc.ch/report/ar6/wg3
CrossRef - Johnson D, Smith R, Gupta P. Financial incentives and sustainable household behaviours: a policy perspective. Ecol Econ. 2021;180:106874. doi:10.1016/j.ecolecon.2020.106874
CrossRef - Kennedy C, Ibrahim N, Hoornweg D. Low-carbon infrastructure strategies for cities. Nat Clim Chang. 2015;5(9):749-751. doi:10.1038/nclimate2640
CrossRef - Khan S, Rana IA, Lee K. Environmental awareness and pro-environmental behaviour: the moderating role of socio-demographics. Sustainability. 2019;11(13):3605. doi:10.3390/su11133605
CrossRef - Kim Y, Roberts JT. Household wealth and carbon footprints: understanding global disparities. Glob Environ Change. 2020;63:102090. doi:10.1016/j.gloenvcha.2020.102090
- Lee YJ, Park SY, Han H. The impact of education on eco-friendly behaviour: a cross-sectional analysis. J Environ Educ. 2021;52(2):98-110. doi:10.1080/00958964.2020.1864938
- Liu X, Lin B. Inefficient waste management and carbon emissions: challenges for China’s cities. Waste Manag. 2019;87:761-770. doi:10.1016/j.wasman.2019.02.025
CrossRef - Miller T, Carter R. Community engagement for sustainability: best practices and policy frameworks. J Environ Policy Plan. 2018;20(5):623-637. doi:10.1080/1523908X.2018.1429330
- Ministry of New and Renewable Energy. Annual Report 2022–2023. Government of India; 2023. https://mnre.gov.in
- Owen A, Barrett J. Urban consumption and carbon footprints in India: an economic perspective. J Clean Prod. 2023;386:135652. doi:10.1016/j.jclepro.2022.135652
CrossRef - Park H, Kim J, Lee K. Infrastructure and cultural determinants of household sustainability practices. Sustain Sci. 2022;17(2):451-465. doi:10.1007/s11625-021-00977-4
- Rao ND, Min J. Decent living standards: material prerequisites for human well-being. Soc Indic Res. 2018;138(1):225-244. doi:10.1007/s11205-017-1650-0
CrossRef - Roberts J, Green J, Thomas L. Cultural and infrastructural drivers of environmental behaviour. Environ Sociol. 2019;5(4):387-399. doi:10.1080/23251042.2019.1635900
- Sager, L. (2017). Income inequality and carbon consumption: Evidence from environmental Engel curves. Energy Economics, 84, 124–136.
https://doi.org/10.1016/j.eneco.2019.03.015
CrossRef - Sharma N, Verma R, Yadav P. Urban planning and its role in reducing household carbon emissions. Habitat Int. 2022;119:102502. doi:10.1016/j.habitatint.2022.102502
- Sharma U, Jain A, Tripathi R. Household energy consumption and carbon emissions in India: regional and income group analysis. Energy Policy. 2020;144:111624. doi:10.1016/j.enpol.2020.111624
- Sharma P, Singh R. Household energy use and carbon emissions in Indian cities. Energy Policy. 2022;162:112772. doi:10.1016/j.enpol.2022.112772
- Singh S, Patel P. Behavioural interventions for low-carbon households in India. Energy Policy. 2018;120:684-693. doi:10.1016/j.enpol.2018.05.038
CrossRef - Smith R, Gupta P, Wang H. Wealth and the global carbon footprint: policy implications for equity. World Dev. 2020;131:104963. doi:10.1016/j.worlddev.2020.104963
CrossRef - Wang Y, Wang J, Li S. Waste disposal and carbon emissions: urban policy interventions in developing economies. J Environ Manag. 2020;263:110395. doi:10.1016/j.jenvman.2020.110395
CrossRef - Wiedenhofer D, Lenzen M, Owen A, et al. Household consumption and carbon footprints: reconciling perspectives from input–output and life-cycle assessment. Nat Clim Chang. 2018;8(6):519-525. doi:10.1038/s41558-018-0173-0
- World Resources Institute. Household Consumption and Emissions in Urban Areas. WRI; 2021. https://www.wri.org


