Assessment of ground-water quality for physico-chemical, heavy metals & bacteriological (Coliform) contamination in and around Raigarh city
Brajesh K1 * and Masood Alam1
http://dx.doi.org/10.12944/CWE.1.2.05
Ground-water quality of Raigarh city in Chattisgarh state was assessed for drinking water purpose based on physico-chemicals, heavy metals & bacteriological (Coliform) parameters. The samples were analysed as per methods specified by Bureau of Indian Standards/standard methods. Physico-chemical analysis reveals that fluoride,nitrate and iron are higher than BIS specified limit at some sampling sites . The samples with high Iron content & other heavy metals pollution was found in groundwater located near sponge iron plant indicating possible metal leaching into groundwater. Bacteriological analysis reveals that coliform organisms were found absent at 5 locations while at 13 sampling locations, they were found in less than BIS specified limit. Four sampling stations were found heavily contaminated by coliform organisms with maximum coliform organisms were found 86/100ml of water sample.
Copy the following to cite this article:
Shrivastava B.K, Alam M. Assessment of ground-water quality for physico-chemical, heavy metals & bacteriological (Coliform) contamination in and around Raigarh city. Curr World Environ 2006;1(2):125-132 DOI:http://dx.doi.org/10.12944/CWE.1.2.05
Copy the following to cite this URL:
Shrivastava B.K, Alam M. Assessment of ground-water quality for physico-chemical, heavy metals & bacteriological (Coliform) contamination in and around Raigarh city. Curr World Environ 2006;1(2):125-132. Available from: http://www.cwejournal.org/?p=601
Download article (pdf)
Citation Manager
Publish History
Introduction
Groundwater serves as a major resource for drinking,irrigation and industrial use .It is generally considered to be cleaner than surface water.However, several factors like discharge of industrial,agricultural and domestic wastes,land use practices,geological formations,rainfall patterns and infiltration rate affect the quality of ground water in an area and once contamination of groundwater aquifers occurs,it persists for hundreds of years because of very slow movement of water in them.1 The quantity of uncontaminated ground water is deteriorating at an alarming rate in India.2 As per WHO report,in developing countries,pollution of water has been reported to cause 80% of human diseases and 30% of infant mortality. Only after ascertaining the physical, chemical and bacteriological qualities of the samples,the suitability of any water can be determined for different purposes.3 In the recent years, there have been many studies on groundwater pollution of various states in India.4,5,6,7 However,there is paucity of information regarding the status of underground water quality for the state of Chattisgarh where there has been rapid industrial growth in past decades.
Study Area
Raigarh district is located in the eastern part of Chattisgarh. It stretches between 21°20’ to 22°49’ N longitude and 82°55’ to 83°45’ E longitude.The district covers an area of 6392 sq km..The district occupies 6836 sq km area and as per census 2001, has 12,65,084 population with literacy rate 70.5 %. Raigarh is situated on the plateau of Archean rock consisting of Granites. The plains of the district represent “Lower Cuddapah” formations consisting of shales interbedded with limestone.
Material and Methods
Physico-Chemical Analysis
Samples were collected from 23 sampling stations (Map 1) in year April 2005 to March 2006. The samples were analyzed as per BIS /Standard method guidelines within stipulated time. pH and TDS were determined using pH and TDS meter (Toshniwal make).Turbidity was measured by Nephelometer (Elico make).Alkalinity, chloride,calcium and magnesium were determined titrimetrically. Iron, manganese, nitrate, nitrite, sulphate and aluminium were determined using digital spectrophotometer (model 304-EI make). Fluoride was analysed as per SPANDS method.
Metal Testing
Metal Ion concentration was determined by flame atomic absorption spectrometer using Perkin-Elmer Atomic Absorption Spectrophotometer (Model 3110) using Air-Acetylin flame. Quantification of metals was based upon calibration curves of standard solutions of respective metal.8-9
Bacteriological (Coliform) Testing
Presumptive Test:
For presumptive test, Mackonkey broth from Himedia was used. Both, single strength as well as double strength media was prepared dissolving appropriate quantity of media in distilled water and pH of the media was checked with digital pH meter. Bromothymol blue indicator was also added in media. The media was then distributed in 4 sets of 5 test tubes containing durham tubes (Size:10 cm x 2 cm) as per WHO guidelines 5th set of test tube was used as blank.Test tubes were incubated in incubator at 370C for 48 hours.The presence of coliform was indicated by acid formation / colour change of media..The standard MPN table was used for enumeration of coliform organisms.
Confirmatory Test
MacKonkey Agar from Himedia was used as a confirmatory media for enumeration of coliform counting.Appropriate quantity of the media was dissolved in distilled water and pH of the media was checked with digital pH meter. The media was sterilized in autoclave at 1210C at 15min and transferred on Petri-plates. All experiments were carried out in Laminar flow chamber. Using nichrome loop, one loopful of the sample (which indicated lactose fermentation/acid formation) was streaked on these petri dishes.The stabing of the culture was done as per standard procedure.After incubating petri dishes in incubator for 48 hours at 370C, petri dishes were observed for coliform colonies. Dark red colonies with diameter 0.5 mm or more were counted and recorded.
Table -1: Sampling point location in and around raigarh city
|
S. No.
|
Location
|
Sampling point
|
|
1
|
Housing Board Colony
|
SP1
|
|
2
|
Beladula
|
SP2
|
|
3
|
Kaserpara
|
SP3
|
|
4
|
Sindhi Colony
|
SP4
|
|
5
|
Subhas- Nagar
|
SP5
|
|
6
|
Vinoba Nagar
|
SP6
|
|
7
|
Chakradhar Nagar
|
SP7
|
|
8
|
Kelo Vihar
|
SP8
|
|
9
|
SECL colony
|
SP9
|
|
10
|
Atarmuda
|
SP10
|
|
11
|
RajivGandhi Nagar
|
SP11
|
|
12
|
Mithumuda
|
SP12
|
|
13
|
Railwaybangla Para
|
SP13
|
|
14
|
Darogapara
|
SP14
|
|
15
|
VikasNagar
|
SP15
|
|
16
|
Kirodimal Colony
|
SP16
|
|
17
|
Baikunthpur
|
SP17
|
|
18
|
Rambhata
|
SP18
|
|
19
|
Dhangardeepa
|
SP19
|
|
20
|
Urdana
|
SP20
|
|
21
|
Madhubanpara
|
SP21
|
|
22
|
Kewtapara
|
SP22
|
|
23
|
Bohidarpara
|
SP23
|
Results and Discussion
The Physico-chemical, Heavy-metal and Microbiological(Coliform) results of groundwater samples are given in Table 2, 3, 4, 5 and 6.These results have been compared with the guideline prescribed by Bureau of Indian Standards.10 Physico-chemical and Heavy metal Parameters: BIS has prescribed two types of standards for drinking water:Maximum desirable limits and maximum permissible limits.After comparing the result with these specifications, it is evident that fluoride , nitrate and iron are major worrying factors in this region.Other physico-chemical parameters meet the BIS specified limit for either maximum desirable limit or for maximum permissible limit at most of the locations or show exceeding values only as isolated pockets in some locations.Hence other analyzed parameters are not significant in discussion.Groundwater quality of Urdana (SP 20) was found most suitable as all parameters meet BIS specification while the quality of Darogapara (SP 14) and Railwaybangla para (SP13) was found worst affected.
Table - 2: Physico-chemical analysis (pre monsoon)
| S. No. | Location | pH | TDS (mg/l) | Turbidity (NTU) | Colour | Ca2+ (mg/l) | Mg2+ (mg/l) | Cl- (mg/l) | Al3+ (mg/l) | Alk. (mg/l) | NO3- (mg/l) | NO2- (mg/l) | SO4 2- (mg/l) | F- (mg/l) | Zn2+ (mg/l) |
| 1 | Housing Board Colony | 7.6 | 1230 | 0.2 | <2 | 60 | 42 | 358 | BDL | 224 | 18 | BDL | 48 | 0.8 | 0.22 |
| 2 | Beladula | 7.46 | 910 | 0.2 | <2 | 48 | 38 | 302 | BDL | 210 | 40.0. | 0.002 | 34.6 | 1.8 | BDL |
| 3 | Kaserpara | 7.2 | 1080 | 0.4 | <2 | 48 | 44 | 320 | BDL | 240 | 25.2 | BDL | 38 | 1.4 | 0.14 |
| 4 | Sindhi Colony | 7.08 | 1020 | 0.4 | <2 | 42 | 44 | 316 | BDL | 214 | 8 | BDL | 18.4 | 0.6 | 0.2 |
| 5 | Subhas Nagar | 7.12 | 1240 | 0.4 | <2 | 69 | 50 | 356 | BDL | 230 | 15 | BDL | 12.6 | 0.8 | 0.14 |
| 6 | Vinoba Nagar | 6.98 | 1020 | 0.4 | <2 | 52 | 38 | 310 | BDL | 208 | 20 | BDL | 44.2 | 2.2 | 0.18 |
| 7 | Chakradhar Nagar | 7.44 | 1236 | 0.6 | 3 | 60 | 44 | 288 | BDL | 230 | 10.4 | BDL | 30.8 | 1.2 | 0.14 |
| 8 | Kelo Vihar | 7.5 | 860 | 0.3 | <2 | 48 | 34 | 284 | BDL | 194 | 25 | BDL | 26 | 0.8 | BDL |
| 9 | SECL Colony | 7.16 | 1080 | 0.3 | <2 | 45 | 47 | 320 | BDL | 220 | 42 | 0.001 | 32 | 2.4 | BDL |
| 10 | Atarmuda | 7.12 | 960 | 0.3 | <2 | 42 | 40 | 298 | BDL | 212 | 40 | 0.001 | 28 | 3.2 | BDL |
| 11 | Rajiv Gandhi Nagar | 7.58 | 1204 | 0.6 | <2 | 62 | 42 | 312 | BDL | 245 | 36 | 0.002 | 36 | 1 | 0.4 |
| 12 | Mithumura | 7.45 | 1270 | 1 | <2 | 65 | 42 | 329 | 0.002 | 288 | 45 | 0.001 | 44 | 1.8 | 0.32 |
| 13 | Railway Bangla Para | 7.32 | 1294 | 4.2 | 12 | 102 | 66 | 304 | 0.01 | 304 | 12.5 | BDL | 45 | 0.4 | 4 |
| 14 | Daroga Para | 7.5 | 1310 | 4 | 10 | 104 | 70 | 440 | 0.04 | 308 | 18 | BDL | 70 | 0.4 | 2.8 |
| 15 | Vikas Nagar | 7.32 | 1240 | 0.8 | <2 | 80 | 60 | 388 | BDL | 275 | 16.2 | BDL | 40 | 0.2 | 0.5 |
| 16 | Kirodimal Colony | 7.4 | 1290 | 0.5 | <2 | 88 | 63 | 324 | BDL | 266 | 9.4 | BDL | 28.5 | 0.5 | 0.42 |
| 17 | Baikunth Pur | 7.6 | 1235 | 0.4 | <2 | 85 | 58 | 260 | 0.002 | 228 | 14.8 | BDL | 52 | 1.2 | 0.28 |
| 18 | Rambhata | 7.2 | 1040 | 0.8 | 4 | 80 | 54 | 306 | 0.001 | 290 | 12 | BDL | 46 | 2.5 | 0.35 |
| 19 | Dhangardeepa | 7.28 | 994 | 0.6 | <2 | 74 | 45 | 296 | BDL | 240 | 25.6 | BDL | 30.5 | 0.9 | 0.5 |
| 20 | Urdana | 6.88 | 360 | 0.2 | <2 | 24 | 26 | 136 | BDL | 129 | 8 | BDL | 18 | 0.2 | BDL |
| 21 | Madhuban Para | 7.4 | 1379 | 0.4 | <2 | 112 | 80 | 486 | BDL | 264 | 22.6 | 0.001 | 84 | 0.4 | 0.2 |
| 22 | Kewta Para | 7.54 | 1320 | 0.4 | <2 | 108 | 72 | 428 | BDL | 255 | 18.5 | BDL | 56.2 | 0.8 | 0.12 |
| 23 | Bohidar Para | 7.42 | 1360 | 0.4 | <2 | 100 | 72 | 460 | BDL | 240 | 14 | BDL | 74 | 1.4 | 0.22 |
Fluoride
Fluoride was found above BIS specified maximum permissible limit of 1.5 mg/L at 5 locations in pre monsoon season and 6 locations in post monsoon season. It was found as 1.8 mg/L in Beladula, 2.2 mg/L in Vinoba Nagar ,2.4 mg/L in SECL colony, 3.2 mg/L in Atarmuda ,1.8 mg/L in Mithumura and 2.5 mg/L in Rambhata in pre monsoon season . In post monsoon season ,its concentration was 1.6mg/L in Beladula,1.8 mg/L in Vinoba nagar, 1.8 mg/L SECL colony,3.6 mg/L in Atarmuda, 1.6 mg/L in Baikunthpur,2.8 mg/L in Rambhata .Fluoride occurrence in ground water is a natural phenomenon, influenced by the local and regional geological setting and hydro-geological conditions of the region. In low concentration (<0.6 mg/Litre) it is recommended for preventive treatment of the dental carries, however higher concentration (>1.5 mg/Litre) lead to dental fluorosis or mottled enamel.Excessively high concentration (> 3.0 mg/Litre) may lead to skeletal fluorosis11 .The severity of fluorosis depends on the concentration of fluoride in drinking water, daily intake, continuity and duration of exposure and climatic conditions. The fluoride concentration in the groundwater of study area is not uniform possibly due to variations in the presence and accessibility of fluoride bearing minerals to water and the weathering and leaching processes.
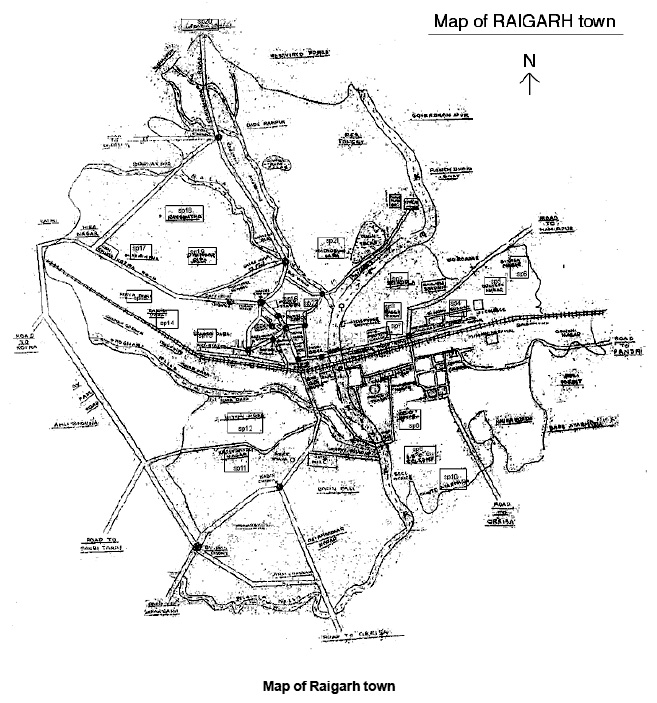 |
Map of Raigarh town Click here to view map |
Table - 3: Physico-chemical analysis (post monsoon)
| S. No. | Location | pH | TDS (mg/l) | Turbidity (NTU) | Colour | Ca2+ (mg/l) | Mg2+ (mg/l) | Cl- (mg/l) | Al3+ (mg/l) | Alk. (mg/l) | NO3- (mg/l) | NO2- (mg/l) | SO4 2- (mg/l) | F- (mg/l) | Zn2+ (mg/l) |
| 1 | Housing Board Colony | 7.72 | 1260 | 0.3 | <2 | 68 | 40 | 364 | BDL | 234 | 22 | BDL | 40 | 0.6 | 0.16 |
| 2 | Beladula | 7.5 | 980 | 0.3 | <2 | 58 | 39 | 340 | BDL | 216 | 46.0. | 0.006 | 38 | 1.6 | 0.1 |
| 3 | Kaserpara | 7.22 | 1100 | 0.4 | <2 | 60 | 36 | 322 | BDL | 242 | 28.2 | BDL | 35 | 1.2 | 0.18 |
| 4 | Sindhi Colony | 7.18 | 1080 | 0.4 | <2 | 55 | 35 | 330 | BDL | 220 | 8.6 | BDL | 20.5 | 0.8 | 0.28 |
| 5 | Subhas Nagar | 7.1 | 982 | 0.4 | <2 | 58 | 42 | 330 | BDL | 202 | 18.5 | BDL | 20 | 0.5 | 0.2 |
| 6 | Vinoba Nagar | 6.88 | 1060 | 0.5 | <2 | 60 | 38 | 332 | BDL | 199 | 24 | BDL | 48 | 1.8 | 0.26 |
| 7 | Chakradhar Nagar | 7.52 | 1280 | 0.6 | 4 | 62 | 41 | 332 | BDL | 234 | 16.4 | BDL | 42 | 1 | 0.2 |
| 8 | Kelo Vihar | 7.68 | 890 | 0.3 | <2 | 46 | 38 | 298 | BDL | 188 | 25 | BDL | 32.2 | 1 | BDL |
| 9 | SECL Colony | 7.22 | 1110 | 0.3 | <2 | 45 | 38 | 340 | BDL | 223 | 45.8 | 0.004 | 28.8 | 1.8 | 0.2 |
| 10 | Atarmuda | 7.2 | 1020 | 0.2 | <2 | 46 | 38 | 318 | BDL | 218 | 47 | 0.002 | 35 | 3.6 | 0.18 |
| 11 | Rajiv Gandhi Nagar | 7.58 | 1220 | 0.6 | 3 | 62 | 38 | 329 | BDL | 244 | 48 | 0.001 | 34 | 1.4 | 0.4 |
| 12 | Mithumura | 7.48 | 1240 | 1.6 | <2 | 62 | 39 | 320 | BDL | 265 | 45.2 | 0.001 | 55 | 1.5 | 0.5 |
| 13 | Railway Bangla Para | 7.5 | 1280 | 5 | 14 | 98 | 60 | 410 | 0.02 | 285 | 12.6 | BDL | 50 | 0.5 | 5.2 |
| 14 | Daroga Para | 7.48 | 1350 | 5 | 16 | 106 | 72 | 460 | 0.04 | 300 | 18 | BDL | 80 | 0.4 | 3 |
| 15 | Vikas Nagar | 7.48 | 1250 | 0.6 | <2 | 78 | 52 | 380 | BDL | 276 | 16 | 0.001 | 40 | 0.2 | 0.5 |
| 16 | Kirodimal Colony | 7.5 | 1260 | 0.5 | <2 | 86 | 55 | 324 | BDL | 258 | 12 | BDL | 28 | 0.4 | 0.4 |
| 17 | Baikunth Pur | 7.52 | 1260 | 0.5 | 4 | 82 | 50 | 310 | 0.001 | 232 | 14.8 | BDL | 60 | 1.6 | 0.3 |
| 18 | Rambhata | 7.4 | 1220 | 1 | 5 | 84 | 54 | 340 | 0.001 | 304 | 12.2 | BDL | 50 | 2.8 | 0.3 |
| 19 | Dhangardeepa | 7.38 | 1040 | 1 | <2 | 76 | 40 | 324 | BDL | 252 | 28.6 | BDL | 40 | 0.6 | 0.65 |
| 20 | Urdana | 6.9 | 390 | 0.2 | <2 | 30 | 22 | 145 | BDL | 135 | 8.2 | BDL | 20 | 0.2 | BDL |
| 21 | Madhuban Para | 7.62 | 1360 | 0.6 | 3 | 108 | 76 | 478 | BDL | 258 | 20.2 | 0.001 | 85 | 0.4 | 0.3 |
| 22 | Kewta Para | 7.5 | 1300 | 0.6 | <2 | 105 | 71 | 410 | BDL | 248 | 18.8 | BDL | 50 | 0.5 | 0.18 |
| 23 | Bohidar Para | 7.48 | 1340 | 0.5 | 3 | 94 | 70 | 438 | BDL | 239 | 14.6 | BDL | 65 | 1.4 | 0.3 |
Nitrate
The excessive content of nitrate (NO3-) in ground and surface water represents an important problem in most region with intensive agricultural activity12. High nitrate levels at some locations seem to have resulted from point source pollution, being located near drains/canals.Infiltration of irrigation water /surface run-off water from the surrounding farm lands alongwith nitrate fertilizer led to higher value of nitrate at some locations.Nitrate concentration was found exceeding maximum permissible limit at few locations .The maximum value of Nitrate was recorded at Rajiv Gandhi Nagar (48.0 mg/L) in post monsoon and minimum nitrate value was recorded at Urdana (8.2 mg/L) in pre monsoon. There was not much variations in the value of nitrate content in groundwater in Raigarh in pre monsoon and post monsoon season. It was found exceeding maximum BIS limit at 5 locations.High Levels of nitrate in groundwater vary spatially due to different degrees of evaporation/ recharge,amount of fertilizer applied, anthroprogenic activity and adsorption/dispersions/ denitrification processes in the soil zone.
Table - 4: Heavy metal concentration in and around Raigarh city (Pre monsoon season)
| S.No. | Location | PbMg/l | CoMg/l | CdMg/l | CrMg/l | NiMg/l | HgMg/l | AsMg/l | FeMg/l | MnMg/l |
| 1 | Housing Board Colony | BDL | BDL | BDL | 0.01 | BDL | BDL | BDL | BDL | BDL |
| 2 | Beladula | BDL | 0.01 | BDL | 0.01 | BDL | BDL | BDL | BDL | BDL |
| 3 | Kaserpara | BDL | BDL | BDL | BDL | BDL | BDL | BDL | BDL | BDL |
| 4 | Sindhi Colony | BDL | BDL | BDL | BDL | BDL | BDL | BDL | BDL | BDL |
| 5 | Subhas Nagar | BDL | BDL | BDL | BDL | BDL | BDL | BDL | BDL | BDL |
| 6 | Vinoba Nagar | BDL | BDL | BDL | BDL | BDL | BDL | BDL | BDL | BDL |
| 7 | Chakradhar Nagar | 0.01 | BDL | BDL | 0.02 | 0.01 | BDL | BDL | 0.02 | 0.02 |
| 8 | Kelo Vihar | BDL | BDL | BDL | BDL | BDL | BDL | BDL | 0.02 | BDL |
| 9 | SECL Colony | BDL | BDL | BDL | BDL | BDL | BDL | BDL | BDL | BDL |
| 10 | Atarmuda | BDL | BDL | BDL | BDL | BDL | BDL | BDL | BDL | BDL |
| 11 | Rajiv Gandhi Nagar | 0.01 | BDL | BDL | BDL | 0.012 | BDL | BDL | 0.05 | 0.05 |
| 12 | Mithumura | BDL | BDL | BDL | 0.02 | 0.022 | BDL | BDL | 0.08 | 0.04 |
| 13 | Railway Bangla Para | 0.02 | 0.04 | 0.001 | 0.05 | 0.03 | BDL | BDL | 1 | 0.6 |
| 14 | Daroga Para | 0.04 | 0.02 | 0.001 | 0.03 | 0.048 | BDL | BDL | 1.2 | 1 |
| 15 | Vikas Nagar | BDL | 0.01 | BDL | 0.01 | 0.02 | BDL | BDL | 0.2 | 0.4 |
| 16 | Kirodimal Colony | BDL | BDL | BDL | BDL | BDL | BDL | BDL | 0.02 | BDL |
| 17 | Baikunth Pur | BDL | 0.01 | BDL | BDL | BDL | BDL | BDL | 0.2 | 0.02 |
| 18 | Rambhata | 0.02 | 0.01 | BDL | BDL | 0.012 | BDL | BDL | 0.02 | BDL |
| 19 | Dhangardeepa | 0.05 | 0.02 | BDL | 0.01 | BDL | BDL | BDL | 0.05 | 0.1 |
| 20 | Urdana | BDL | BDL | BDL | BDL | BDL | BDL | BDL | BDL | BDL |
| 21 | Madhuban Para | BDL | BDL | BDL | BDl | BDL | BDL | BDL | 0.04 | 0.03 |
| 22 | Kewta Para | BDL | BDL | BDL | BDL | BDL | BDL | BDL | BDL | BDL |
| 23 | Bohidar Para | BDL | BDL | BDL | BDL | 0.01 | BDL | BDL | BDL | BDL |
Table - 5: Heavy metal concentration in and around Raigarh city (Post monsoon season)
| S.No. | Location | PbMg/l | CoMg/l | CdMg/l | CrMg/l | NiMg/l | HgMg/l | AsMg/l | FeMg/l | MnMg/l |
| 1 | Housing Board Colony | BDL | BDL | BDL | BDL | BDL | BDL | BDL | BDL | BDL |
| 2 | Beladula | 0.01 | BDL | BDL | 0.01 | 0.02 | BDL | BDL | BDL | BDL |
| 3 | Kaserpara | BDL | BDL | BDL | BDL | BDL | BDL | BDL | BDL | BDL |
| 4 | Sindhi Colony | BDL | BDL | BDL | BDL | BDL | BDL | BDL | BDL | BDL |
| 5 | Subhas Nagar | BDL | BDL | BDL | BDL | BDL | BDL | BDL | 0.02 | BDL |
| 6 | Vinoba Nagar | BDL | BDL | BDL | BDL | BDL | BDL | BDL | 0.04 | BDL |
| 7 | Chakradhar Nagar | 0.02 | BDL | BDL | BDL | BDL | BDL | BDL | 0.6 | BDL |
| 8 | Kelo Vihar | BDL | BDL | BDL | BDL | BDL | BDL | BDL | BDL | BDL |
| 9 | SECL Colony | BDL | BDL | BDL | BDL | BDL | BDL | BDL | BDL | BDL |
| 10 | Atarmuda | BDL | BDL | BDL | BDL | BDL | BDL | BDL | BDL | BDL |
| 11 | Rajiv Gandhi Nagar | 0.02 | 0.01 | 0.001 | 0.04 | 0.02 | BDL | BDL | 0.02 | 0.1 |
| 12 | Mithumura | 0.02 | 0.02 | BDL | 0.01 | 0.044 | BDL | BDL | 0.4 | 0.84 |
| 13 | Railway Bangla Para | 0.05 | 0.04 | 0.004 | 0.06 | 0.05 | BDL | BDL | 1.5 | 0.6 |
| 14 | Daroga Para | 0.04 | 0.04 | 0.001 | 0.06 | 0.12 | BDL | BDL | 1.6 | 1.24 |
| 15 | Vikas Nagar | BDL | 0.02 | BDL | 0.02 | 0.064 | BDL | BDL | 1.2 | 0.2 |
| 16 | Kirodimal Colony | BDL | BDL | BDL | BDL | 0.068 | BDL | BDL | 0.4 | BDL |
| 17 | Baikunth Pur | 0.04 | 0.05 | 0.001 | 0.06 | BDL | BDL | BDL | 0.6 | BDL |
| 18 | Rambhata | 0.02 | 0.02 | BDL | 0.01 | BDL | BDL | BDL | 0.4 | 0.2 |
| 19 | Dhangardeepa | 0.05 | 0.04 | BDL | BDL | BDL | BDL | BDL | 1 | 0.1 |
| 20 | Urdana | BDL | BDL | BDL | BDL | BDL | BDL | BDL | BDL | BDL |
| 21 | Madhuban Para | BDL | BDL | BDL | BDL | 0.014 | BDL | BDL | 0.08 | BDL |
| 22 | Kewta Para | BDL | BDl | BDL | BDL | BDL | BDL | BDL | 0.05 | BDL |
| 23 | Bohidar Para | BDL | BDL | BDL | BDL | BDL | BDL | BDL | BDL | BDL |
Coliform contamination
Total coliform indicates degree of pollution and higher densities of this portrays the difference between clean and polluted waters13.It was found that out of 23 sampling stations, only 5 stations have coliform count more than permissible limit.(>10 coliform colony /100 ml)in both season. However, coliform organism were detected in 18 sites out of 23 sampling sites but the number of coliforms are below BIS permissible limit.As per Bureau of Indian Standards specification for drinking water, coliform count was found highest in sampling station No. 12 ( Mithumuda) following sampling station 11 and 19. (Rajiv Gandhi Nagar and Dhangardeepa respectively). The minimum and maximum coliform count found in these heavily contaminated areas was 18 -86 /100ml.
Table - 6: Coliform count in groundwater in pre and post monsoon season
| S. No. | S.P. | CFU/100ML (pre monsson) | CFU/100ML (post monsoon) |
| 1 | SP1 | 0 | 0 |
| 2 | SP2 | 2 | 7 |
| 3 | SP3 | 4 | 6 |
| 4 | SP4 | 2 | 8 |
| 5 | SP5 | 4 | 9 |
| 6 | SP6 | 5 | 8 |
| 7 | SP7 | 2 | 6 |
| 8 | SP8 | 0 | 0 |
| 9 | SP9 | 0 | 0 |
| 10 | SP10 | 2 | 8 |
| 11 | SP11 | 26 | 45 |
| 12 | SP12 | 38 | 86 |
| 13 | SP13 | 10 | 6 |
| 14 | SP14 | 0 | 0 |
| 15 | SP15 | 8 | 7 |
| 16 | SP16 | 6 | 10 |
| 17 | SP17 | 2 | 2 |
| 18 | SP18 | 16 | 22 |
| 19 | SP19 | 18 | 44 |
| 20 | SP20 | 0 | 0 |
| 21 | SP21 | 14 | 22 |
| 22 | SP22 | 4 | 10 |
| 23 | SP23 | 2 | 8 |
Heavy Metals
Among heavy metals, iron was found exceeding maximum permissible limits at 2 locations –Darogapara and Railway Bangla Para. BIS has recommended 0.3mg/ litre as the desirable limit and 1.0 mg/ l as the maximum permissible limit in the absence of alternate sources.The value of iron content was found more than 1.0 ppm in these locations in both season.The highest value of iron (1.6 ppm) was found in Darogapara in post monsoon season. Although iron has got little concern as a health hazard,it is still considered as a nuisance in excessive quantities. Consumption of drinking water with a high concentration of iron can lead to liver disease over a long period of time.Iron in excess of 0.3 mg/L causes staining of laundry and ceramic ware.Dissolved iron in drinking water is difficult to remove when present in concentration more than 1.0 mg/L. Two reasons can be attributed for high iron content in groundwater in Raigarh district-first, the bedrock of Raigarh district is limestone which also contains iron and the second - possible leaching from sponge iron plants- as the result indicates that areas nearby sponge iron plant has high iron content.Maximum iron content was found in Darogapara (1.6 mg/L) followed by Railway Bangla para (1.5 mg/L), VikasNagar (1.2mg/L) & Dhangardeepa (1.0mg/L).
Conclusions
The groundwater in Raigarh city has varied nature of quality which was found influenced to a great extent by regional geomorphological ,hydrogeological ,industrial and social pattern. The groundwater quality at Urdana ( SP 20 ) was found most suitable for drinking purpose.All analysed parameters are within maximum desirable limits as per Bureau of Indian Standards Specifications-IS 10500-1991.Other sampling locations show different behaviour with reference to various physico-chemical parameters and Coliform organisms . Iron content was found above BIS maximum permissible limit in Darogapara (SP 14) and Railway Bangla Para (SP 13) in both season. Fluoride content was found exceeding BIS limit in Beladula (SP 2) ,Vinoba Nagar (SP 6) , SECL Colony (SP 9) and Atarmuda (SP 10) in both season while nitrate content was found exceeding of 45 mg/L as per IS 10500:1991 at many locations in post monsoon season.Coliform organisms were found exceeding maximum permissible limit (>10 coliform colony /100 ml) in 5 sampling sites out of 23 sampling locations.
References
- Kaushik, A.,. Kumar K., Kanchan ,Taruna., and Sharma H. R. Water quality index and suitability assessment of urban ground water of Hisar and Panipat in Haryana, Journal of Environmental Biology., (2002) 23, 325.
- Shrihari S.,and Raghavendra Kiran S., Adsorption of dissolved iron on laterite., Pollution research., (2003) 22(4), 507.
- Reghunath, Rajesh., Murthy, Sreedharan., Raghavan T. R. Spatial distribution of pH, electrical conductivity and total dissolved solids of groundwater of Nethervathi river basin, Karnataka state, India. Pollution Research, (2001) 20(3), 413.
- Singh, Omkar., Rai, S. P., Kumar, Vijay. Ground water Quality Assessment for Irrigation in Jammu and Kathua districts, J and K . Journal of Applied Hydrology., (2002) 15(2 and 3), 9.
- Jain, C. K. and Sharma, M. K. Fluoride contamination in groundwater of Jodhpur district , Rajasthan. Journal of Indian Association for Environmental Management., (2002) 16(2),11.
- Govil, P. K., Rao, Ganeshwar., Krishna A. K.Arsenic contamination in Patancheru industrial area,Medak district, Andhra Pradesh. Environmental Geochemistry., (1998) 1(1), 5.
- Narain Rai, J.P. and. Sharma, H.C.Bacterial contamination of Groundwater in rural Areas of North West Uttar Pradesh. Indian Jounal of Environmental Health., (1995) 37(1), 37.
- Nafde, A.S., Kondawar, V.K., Hasan M.Z. Precision and accuracy control in the determination of heavy metals in sediment and water by Atomic Absorption Spectrophotometry. Journal of Indian Association for Environmental Management., (1998) 25(2), 83.
- Dhopte S. M.,Muthal P.L., Pandya G.H., Kondawar V.K. Development of simple hydride generation technique for the atomic absorption determination of arsenic in environmental samples. Journal of IAEM, (1999) 26(3),150.
- Bureau of Indian Standards Specifications (1991).Indian Standard for drinking water specification IS 10500:1991
- Tarafdar, B.,Bhattacharya R. N. Bacterio-logical analysis of a pond water from Gobardanga,West Bengal. Journal of Environmental Biology, (2002) 23(3), 271.
- Namasivayam C and Sangupta D. Removal and recovery of nitrate from water by ZnCl2 activated carbon from coconut coir pith,an agricultural solid waste.Indian Journal of Chemical Technology. (2005) 12, 513.
- Pathak, M.D., Badve, Ranjana. Occurrence of fluoride in groundwater of Maharashtra. Journal of IAEM, (1999) 26, 168.


