A study on the ground water quality around Dhalai Beel area adjacent of Dhaka export processing zone
R.K. Biswas1 * and R.A. Banu2
1
Department of Applied Chemistry and Chemical Technology,
Rajshahi University,
Rajshahi,
6205
Bangladesh
2
Department of Chemistry,
Rajshahi College,
Rajshahi,
6205
Bangladesh
http://dx.doi.org/10.12944/CWE.1.2.06
The paper present the physiochemical characteristics and suitability of the ground water body as potable water sources accurring around Dhalai beel area adjacent to Dhaka Export Processing Zone (DEPZ), Savar, Bangladesh. Several parameters including Temperature, pH, Electrical Conductivity, Dissolved Oxygen, Total Hardness, Total Dissolved Solids, Total Alkalinity and quantity of dissolved anions Hardness, Total Dissolved Solids, Total Alkalinity of Dissolved Solids, Total Alkalinity and quantity of dissolved anions viz, CI, PO4, SO4 and cations viz. K, Na, Ca, Mg, Fe, Cu, Zn, Mn, As, Pb, Cd are studied. The study reveals that the concentration of PO4, K, Na, Fe and Pb exceed the standard permissible limit prescribed by WHO and USPHS. The deterioration of the ground water can be attributed to the excess use of fertilizer and pesticies by the local people and DEPZ effluents, which are gushing out from various industries and directly pouring into the Dhalai beel. It is hoped that the results of the present investigation might be in use in assessing the ground water quality of the area and in the management procedures of DEPZ industrial waste disposal systems.
Copy the following to cite this article:
Biswas R.K, Banu R.A. A study on the ground water quality around Dhalai Beel area adjacent of Dhaka export processing zone. Curr World Environ 2006;1(1):133-138 DOI:http://dx.doi.org/10.12944/CWE.1.2.06
Copy the following to cite this URL:
Biswas R.K, Banu R.A. A study on the ground water quality around Dhalai Beel area adjacent of Dhaka export processing zone. Curr World Environ 2006;1(1):133-138. Available from: http://www.cwejournal.org/?p=603
Download article (pdf)
Citation Manager
Publish History
Introduction
Ground water is still the most preferred water source in the third world countries. Once believed to be safe from contamination as it resides many strata below the surface, has now been proved to be prone to pollution by several researches across the world. The contamination of groundwater may be due to improper disposal of domestic and industrial wastewaters. In urban centers the ground water is exposed to more threat than in rural areas. The main source of drinking water around Dhalai Beel area adjacent to Dhaka Export Processing Zone (DEPZ) is hand pump, tubes wells and is supplied directly to customers with out any pre-treatment. Two EPZ’s have been operating for years in the area; huge amount of effluents are gushing out everyday from the industrial establishment of EPZ and the materials are directly poured into the Dhalai Beel (low lying fresh water body) situated on the western side of DEPZ. Local people use the well water for drinking as well as for other domestic purpose. So it is an urgent need to monitor the ground water quality around Dhalai Beel area and compare it to the guideline standards for drinking water quality parameters. The main objective of the present investigation was to assess the quality of tube well water in the adjacent villages of Dhalai Beel area where the effluents from DEPZ is directly pouring in. Similar works1-7 have been reported from different parts of the world.
Material and Methods
Study Area
The study area under Dhamsona Union of Savar thana (23° 51/ North and 90° 15/ East) is situated 32 km north of Dhaka, the capital city of Bangladesh. The area is burned with numerous industrial establishments. Two export processing zones (Old and New) are operating with in this belt. Between the two EPZ’s, the national highway from northern Bangladesh to Dhaka is running.
Sample collection and preservation
The ground water samples were collected through hand pump tube wells form selected locations of north-west side of Dhalai Beel. Sample No. DBA-1 (Dhalai Beel Area-1) was collected form nearby the effluent discharging point (DP). DBA-2 and DBA-3 were from 0.5 km and 1.25 km away respectively, form the DP. Sample No. AEC (from deep tube well) was from the Atomic Energy Commission (AEC) residential area eastward to old EPZ. EPZP-5 and EPZP-6 (ground water samples form new Export Processing Zone deep tube well Pumps) data were taken form literature. The samples were collected in plastic container during running conditions of the wells following the instructions outlined by APHA.8 The plastic containers were previously treated with a mixture of distilled waster, 2% HNO3 and 0.5% H2O2 for about 16 hours. Afterwards the containers were washed well with distilled water and air-dried. The containers were then ready for sample collection. A part of collected water samples were acidified immediately with the addition of 2ml. HNO3 per litre of water sample, shaken well and preserved in a cool and dark place before laboratory analysis.
Analysis of collected ground water samples
The pH and EC values were determined electrometrically using a portable digital pH meter (Model KRK, KP-5Z, Japan) and a digital multi range conductivity meter (Model Hanna HI 9033, Singapore). Total dissolved solids (TDS) were determined with the help of the following relationship.9
TDS (mg L-1) = EC (µs cm-1) × 0.7 ...(1)
Water temperature were measured by a mercury thermometer. Hardness was determined titrimetrically (EDTA complexometric titration method). The hardness values were also calculated from the Ca and Mg contents using the equation.10 Hardness (mg equiv. CaCO3/L) = 2.5 × CA
(mg L-1) + 4.1 × mg (L-1) ...(2)
Dissolved oxygen was measured by D.O meter (Model KRK, DO-5Z Japan) as well as by Winkler’s method10. Total alkalinity in mg L-1 as CaCO3 was determined titrimetrically10. Chloride was measured by chloride ion meter (Model KRK, Cl-5Z Japan). Phosphate (Molybdophosphoric blue colour method in H2SO4 system) and Sulphate (turbidity method) were estimated using a visible spectrophotometer in the laboratory of SRDI (Soil Resource Development Institute), Sympur, Rajshahi. The concentration of arsenic was determined directly by air-acetylene flame AAS (Shimadzu Model AA-6800) coupled with HVG, and auto sampler (Model ASC-6100) and a Cannon laser printer (Model LBP-1210) all were from Japan. Concentration of lead and cadmium were determined by graphite furnace Atomic Absorption Spectrophotometer (Shimadzu GF-AAS Model AA-6800) in the Central Science Laboratory of Rajshahi University. K, Na, Ca, Mg, Fe, Cu, Zn and Mn concentration were determined by AAS (Perkin Elmer, Model 3110, USA) in the laboratory of SRDI, Shyampur, Rajshahi.
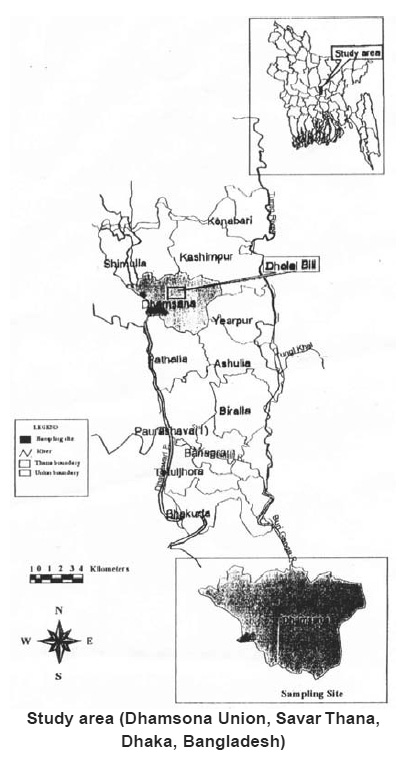 |
Study area (Dhamsona Union, Savar Thana, Dhaka, Bangladesh) Click here to view map |
Results and Discussion
All the water samples show no turbidity and suspended material at the time of collection. The ground water in the area colourless, tasteless and odourless. Field report of the tube wells are shown in Table -1.
Table - 1: Field report of the tube wells
| Well No | Well owner | Date | Time | Temp °C | Depth of well, ft | Using period Over |
| DBA-1 | Government | 5.6.05 | 3:00 PM | 26 | 120 | 4 years |
| DBA-2 | do | 5.6.05 | 4pm | 25 | 135 | 6 years |
| DBA-3 | do | 5.6.05 | 5pm | 25 | 135 | 5 years |
| AEC-4 | AEC | 5.6.05 | 10am | 26 | Deep tube well | - |
| EPZP-5 | DEPZ | Aug.2000 | - | 25 | Deep tube well | - |
| EPZP-6 | do | Aug. 2000 | - | 25 | Deep tube well | - |
Temperature of the ground water sample is in the range of 25-26°C (at the time of collection) which are suitable form drinking purpose. Results on pH, EC and DO are arranged in Table -2. It is evident from the table that pH values of all the samples area found to lie with in the desirable limits.
Table - 2: Results of odour, colour, pH, EC and Do*
| Well No | Odour | Odour | pH | EC (µscm-1) | DOM (mgL-1) | DOW (mgL-1) |
| DBA-1 | Nil | Nil | 7.01 | 326 | 1.76 | 4.2 |
| DBA-2 | Nil | Nil | 7.07 | 435 | 2.1 | 4.3 |
| DBA-3 | Nil | Nil | 7.14 | 500 | 2.17 | 4.4 |
| AEC-4 | Nil | Nil | 7.33 | 370 | 2.03 | 4.05 |
| EPZP-5 | Nil | Nil | 5.9 | 950 | - | 4.1 |
| EPZP-6 | Nil | Nil | 6.7 | 930 | - | 4.7 |
DOM = Dissolved oxygen determined by Do Meter.
DOw = Dissolved oxygen determined by Winkler’s method.10
Electrical conductivity (EC) is a useful tool to evaluate the purity of water. Results indicate that almost all the samples are with in the permissible limits of 1400ms cm-1.
The dissolved oxygen (DO) values water samples were determined by DO meter as well as by Winkler’s method (Table -2). The permissible limits of DO in drinking water as laid down by the United States Public Health Service (USPHS) and Indian Standard Institution (ISI) are cited11 and 4-6 mg L-1 and 3 mg L-1 respectively. Dissolved oxygen of drinking water adds test and it is a highly fluctuating factor. In the present investigation DO values were immediately measured by the DO meters. Winkler’s method was applied in the laboratory afterwards. During collection and transportation of water oxygen might be mixed up with water and thereby increased the DO value to some extent.
Table - 3: Results of total hardness (TH). Total dissolved solids (TDS), Total alkalinity (TA) and dissolved anions in ground water
| Well No | THT (mg L-1) | THC (mg L-1) | TDS (mg L-1) | TA (mg L-1) | CI (mg L-1) | PO4 (mg L-1) | SO4 (mg L-1) |
| DBA-1 | 66 | 163 | 231 | 115 | 10 | 0.43 | 1.7 |
| DBA-2 | 64 | 157 | 308 | 90 | 5 | 0.27 | 1.05 |
| DBA-3 | 70 | 168 | 350 | 190 | 2 | 0.32 | 1.6 |
| AEC-4 | 66 | 145 | 259 | 120 | 2 | 0.34 | 0.85 |
| EPZP-5 | 34 | 127 | 133 | 140 | - | - | - |
| EPZP-6 | 30 | 110 | 169 | 100 | - | - | - |
THT =Total hardness measured by EDTA complexometric titration method
TH = Total hardness calculated form the concentration of Ca2+ and Mg2+ (cf. Table 4)10
Total hardness values measured by complexometric titration using EDTA and also by computing the concentration of Ca2+ and Mg2+ (measured by AAS, cf. Table 4) in equation2. It is to be noted that the computational value (110-168 mg L-1) are higher than those of titrimetic values (from 66-84 mg L-1). However all the samples have total hardness values with in the ISI and WHO limits of 200 and 500 mg L-1 respectively. The TDS (Total Dissolved Solids) of the water samples ranged from 133 mg L-1 to 350 mg L-1 The ISI standard for dissolved solids is up to 500 mg L-1 and the maximum permissible quantity12 is 1500 mg L-1. The Total alkalinity in the water samples was found between 90-120 mg L-1 which were with in the ISI range of total alkalinity is between 50-200 mg L-1. For all the samples alkalinity is greater than the measured (EDTA titration) hardness (cf. Table 3), which might be due to the presence of basic salts of Na and K in addition to Ca and Mg. However, alkalinity itself is not so harmful to human being.13
The chloride conent of different water samples lies between 2 mg L-1 to 10 mg L-¹ (measured through chloride ion meter) which is within permissible limit. The highest desirable limits14 is 200 mg L-1. In the case of sulfate, 0.85 to 1.70 mg L-1 concentration has been recorded. The sulfate concentration are with in the safe limits of 250 mg L-1 as suggested by WHO12. Phosphorus occues in natural water and in waste water almost solely as phosphates. Present results record phosphate concentration from 0.27 to 0.43 mg L-1 which are indicative of phosphate pollution in the ground water of villages around Dhalai Beel area. The standard values for phosphate in water is 0.1 mg L-1 (WHO, 1993). The highest values of phosphate might be due to excess use of fertilizers and pesticides by the people residing in the area. However phosphate content at different sites indicates that there is little form agricultural run-off but a significant impact due to industrial effluents form the Dhaka Export Processing Zone.
Table - 4: Quantity of dissolved cation in ground water
| Well | Na | Ca | Fe | Cu | Mn | As | Cd |
| 1 | 188 | 26 | 1 | 0.05 | 0.02 | 0.004 | 0.003 |
| 2 | 189 | 26 | 0.8 | 0.01 | 0.01 | 0.006 | 0.002 |
| 3 | 185 | 28 | 1 | 0.01 | 0.02 | 0.003 | 0.002 |
| 4 | 161 | 25 | 0.7 | 0.01 | 0.01 | 0.002 | 0.001 |
| 5 | 56.6 | 20 | 3.11 | 0.19 | - | - | - |
| 6 | 51.1 | 17 | 3.07 | 0.48 | - | - | - |
* The concentrations of all the cations are expressed in mg L-1
Table 4 cites the concentration of Ca, Mg, Cu, Zn, Mn, As and Cd in water samples in the ground water ranged between 17-28, 17-24, 0.01-0.48, 01-1.12, 0.01-0.02, 0.002-0.006 and 0.001-0.0003 mg L-1 respectively. The recommended concentration of those ions in drinking water are 100, 30, 100, 5.5 mg L-1 (USPHS), 0.05, 0.05, 0.01 mg L-1 (WHO) respectively. Hence the tube well water in ht study are safe for drinking purpose in terms of Ca, Mg, Cu, Zn, Mn, As and Cd contents.
In the present study, water from three tube wells have potassium higher than the permissible limit of mg L-1 (Table -4) as prescribed by BIS (Bureau of Indian Standards) and ranges from 44 to 240 mg L-1. Samples 4, 5 and 6, which are deep tube well, waters contain potassium concentration within prescribed limit. However, samples 1-3 show higher concentrations than the prescribed value. Potassium concentration is the highest (240 mg L-1) in tube well no. 1, which is nearest to the discharging point and its concentration decreases with distance viz. 72 mg L-1 and 44 mg L-1 for well no.2 and 3 (0.5 km and 1.25 km away from the discharging point) respectively.
Sodium concentration are also higher is all the ground water samples under study than the prescribed limit of 20 mg L-1 in drinking water recommended by BIS. High sodium content in the form of chloride and sulfate makes the water salty in taste and unfit for human consumption. Lead and its compounds are toxic to all sores of life processes. It tends to deposit in the bones as a cumulative poison; it can also cause chromosome damage. The average lead concentration in the present ground water samples is above 0.15 mg L-1 (ranged between 0.158-0.376 mg L-1), which is higher than drinking water quality standard value15 of 0.05 mg L-1. Iron content in the water samples are ranged between 0.7 mg L-1 and 3.11 mg L-1 which exceed the recommended limit16 of 0.3 mg L-1 It is evident from table 4 that in general, ground water bodies of this area contain a greater quantity of iron. Waters of all wells under investigation are not potable in terms of Pb and Fe concentrations. The tube well water as well as deep tube well water from AEC and DEPZ area also contains high lead concentration. This result is indicative of the fact that the source of higher Pb content may not be the DEPZ industries but some other sources. Presumably, long term accumulation of lead from automobile emissions has been the source of hither Pb content of water in the study area (it is to recalled that the busy national high way runs through this area).
Conclusions
From the results of the present work one can conclude that the ground waters of the area are getting more or less polluted through the effluents of Dhaka Export Processing Zones. Nevertheless, Considering all the criteria, all well water (hand pump and deep) sample in general, are found suitable for drinking purpose; however regarding PO4, K, Na, Fe, and Pb concentration, the water are not that the fit for human consumption. It must be stated here that though heavy metal content in the ground waters of Dhalai Beel are does not pose any immediate threat to the potability but if the present non scientific disposal of sewage and industrial effluents are continued the situation may get critical in the near future. Present results also suggest that effluents should be sent to the treatment plant before it discharging to the Beel area.
Acknowledgements
One of us (RAB) is grateful to Bangladesh UGC for financial assistance in the execution of this research work and thankful to Professor M.R. Zaman of the Department of Applied Chemistry Technology, RU, Bangladesh for helpful suggestion and constructive criticisms.
References
-
Kim, K., Rajmohan. N, Kim, H., Hwang, G.S., Cho, M.J.: Eviron. Geol. Assessment of ground water chemistry in a coastal region (Kunsan, Korea) having complex contaminant sources; A stoichiometric approach. (2004) 46, 763-774.
-
Von der Heyden, C.J. and New, M.G. Sci. Ground water pollution on the Zambian copper belt: Deciphering the source and the risk. Total Environ. (2004) 327, 17-30.
-
Ahmed, A. and Alam, M. Physicochemical and toxicological studies of industrial effluents in and around Delhi and ground water quality of some areas of Delhi city. Chemical Environ. Res. (2003) 12, 5-13.
-
Maity, P.B., Saha, T., Ghosh, P.B., Chatterjee, D., Editor(s): Reed , Brian. Proc. WEDC Conf. Kolkata, India, Sustainable Environmental Sanitation and water Services. Publishers: water, Engineering and Development Center, Loughborough, UK (2003).
-
Galil, M.A., Hereher, M., M., EI Etr, H.A.: The ground water quality of the Aeolian aquifer of northern Sinari, Egypt. J Environ. Sci. (2002) 24, 23-39.
-
Robinson J. Water Resources Investigation Report (US Goel Survery), Ground water quality beneath an urban residential and commercial area, Montgomery, Alabama (2002).
-
Hamlin., S.N., Scote, N., Belitz K. Sarah, D. Dawson, B. ibid. Ground water quality in the santra Ana Watershed, California: Overview and data summary. (1998).
-
Standard Method for the Examination of water and wastewater, 20th ed. American Public Health Association, Washington, D.C. (1998).
-
Metcaff & Eddy. Wastewater Engineering (Treatment and reuse), 4th Ed., Tata McGraw-Hill Publishing Company, New Delhi (2003).
-
Tripathi, B.D. and Govil, S.K., Water Pollution (An experimental approach), CBS Publisher, New Delhi (2001) 24.
-
Dey, A.K.: A text Book of Environmental Chemistry, 4th Ed, p 231 (2000).
-
WHO International Standards for drinking water, Geneva (1984).
-
Pandey, K.S. an Sharma, S.D.: Pollution Res., (1999) 18, 335-338.
-
Park, J.E, and Park, K.: Textbook of Preventative Social Medicine, Messers Banarasidas Bhanot, Jabalpur, India 8th edition, (1980).
-
Tareq, S.M. and Rahman, S.H.: Potable water quality of Jahangirnagar University Campus, Savar, Bangladesh U.J. Sci., (2002) 25, 147-152.
-
Zaman, M.R. Banu R.A., Yousuf, A Comparative study on the determination of iron in ground water by different methods. Pakistan J. Sci. Ind. Res., (2005) 48, 393-396.


