Trends in the Rainfall Pattern Over the Gangetic Plain
Devendra Kumar Tiwari
 and P. Parth Sarthi
*
and P. Parth Sarthi
*
1
Department of Environmental Science,
Central University of South Bihar,
Gaya Panchanpur Road,
Post-Fatehpur, Gaya,
Bihar
India
Copy the following to cite this article:
Tiwari D. K, Sarthi P. P. Trends in the Rainfall Pattern Over the Gangetic Plain. Curr World Environ 2024;19(1).
Copy the following to cite this URL:
Tiwari D. K, Sarthi P. P. Trends in the Rainfall Pattern Over the Gangetic Plain. Curr World Environ 2024;19(1).
Citation Manager Publish History

Introduction
The Gangetic Plain, an enormously productive region in northern India, stands as a testament to the harmonious coexistence of nature and humanity. Home to over 400 million people, this region is not only densely populated but also more than a simple agriculturally significant areas globally48. Its sprawling landscapes are adorned with a rich tapestry of crops, ranging from the golden fields of wheat to the emerald rice paddies, and the towering stalks of sugarcane. Indeed, the Gangetic Plain is the breadbasket of India, sustaining both its populace and its agricultural economy. However, amidst the bucolic beauty and the rhythmic pulse of life in this region, a disquieting trend has emerged in recent years—a noticeable decline in the number of rainy days49. For a region whose agricultural rhythms are intricately attuned to the monsoon, this shift in rainfall patterns is more than just a meteorological curiosity; it's a cause for profound concern.
This paper embarks on a journey to understand the intricacies of this phenomenon—the decrease in rainy days in the Gangetic Plain—within the broader context of climate change. Our path is illuminated by the light of data, specifically meteorological records meticulously gathered through the Indian Meteorological Department (IMD) over several decades48.
These documents offer a wealth of knowledge, allowing us to scrutinize the frequency of rainy days in this region.
Historically, the Gangetic Plain has been a region blessed with a bountiful and well-distributed monsoon rainfall. Studies by Gadgil et al. (2002) and Parthasarathy et al. (1995) have emphasized the significance of the Indian monsoon system in delivering timely and adequate rainfall to support the diverse agricultural practices in the region. The monsoon system, driven by complex atmospheric and oceanic interactions, has, for generations, provided a degree of predictability to the local climate.
Recent research, however, paints a different picture. Studies such as those conducted by Goswami et al. (2006) and Dash et al. (2007) have noted a shift in rainfall patterns in India. There is evidence to suggest a reduction in the number of rainy days, which is particularly alarming in the context of the Gangetic Plain. Global climate change emerges as a pivotal factor. Kumar et al. (2011) and Ghosh and Mujumdar (2018) highlight the influence of climate change on Indian monsoon dynamics48. Elevated sea surface temperatures, changing circulation patterns, and altered moisture material in the environment are believed to be contributing to the observed shifts in regional rainfall patterns. It's worth noting that the decrease in rainy days is not uniform across the entire Gangetic Plain. Studies like that of Rajeevan et al. (2012) have pointed to regional variations, where some areas are experiencing more pronounced declines than others. These variations may be attributed to local geographical and climatic factors. Agriculture, the backbone of the region's economy, is acutely vulnerable to shifts in rainfall patterns. Research by Singh et al. (2015) and Sharma et al. (2019) underscores the detrimental effects on crop yields, planting schedules, and overall agricultural productivity. Reduced rainy days challenge traditional farming practices and necessitate adaptations. The socio-economic implications are profound. Mishra et al. (2020) highlight how the livelihoods of millions of farmers are at stake, potentially leading to increased poverty and rural-to-urban migration. The economic stability of the region is also under threat, given the strong ties between agriculture and the local economy. Addressing the decrease in rainy days necessitates evidence-based policy formulation. Kumar and Jain (2017) discuss the importance of adaptive strategies, including improved water management, crop diversification, and climate-resilient farming practices. Effective policies should be founded on a comprehensive understanding of the changing climate dynamics in the Gangetic Plain.
Goswami, B. N., et al. (2006) states that the increase in49 extreme rainfall events in India due to global warming. Meehl, G. A., et al. (2007) highlights the potential implications of changing climatic conditions, including alterations in precipitation patterns. While not specific to the Gangetic Plain, it underscores the global nature of consequences of environmental degradation on rainfall. While it doesn't focus exclusively on the Gangetic Plain, it provides insights into the broader regional climate change's effects on rainfall. Zhang, X., et al. (2007) provides a comprehensive analysis of trends in global precipitation patterns from 1900 to 200448. It identifies significant alterations in severity on top of how often rainy days across different regions, highlighting the complexity of precipitation trends48. Dai, A. (2011) primarily focusing on drought, has discusses the interplay between increased temperatures, changing precipitation patterns, as well as how frequently rainy days. It offers insights into the potential impact the repercussions of climate change on rainy day trends. Alexander, L. V., et al. (2006) examines changes in daily climate extremes, encompassing the quantity of rainy days, based on observational data from globally. It provides a global perspective on precipitation trends. Trenberth, K. E., et al. (2007) assesses the noted modifications in climate variables, including precipitation. It discusses anomalies in the happenstance of of rainy days in49 different regions. Kumar, K. K., et al. (2011) investigates temperature swings that were observed and precipitation patterns in India48, including the impacts on the monsoon system. While it doesn't specifically address the Gangetic Plain, it contributes to the understanding of the Indian subcontinent's shifting climate. Ghosh, S., & Mujumdar, M. (2018) employs high-resolution climate models to project future precipitation extremes in India. Although it does not narrow down to the Gangetic Plain, it provides valuable insights into regional climate change impacts. Kumar, P. et al. (2023) study the effects of fluctuating precipitation patterns on rice productivity in Bihar, which is situated in the Gangetic Plain. It highlights the agricultural repercussions of decreased rainy days.
Wang, G., et al. (2019) examines changes in severe daily precipitation scenarios, including the frequency of rainy days49. It highlights regional variations in precipitation trends. Peterson, T. C., et al. (2008) discusses changes in precipitation patterns, including the number of rainy days, and the49 importance of data quality in trend analysis. Sun, S., et al. (2019) explores the relationship between changing precipitation patterns, including rainy days, and vegetation productivity in a semi-arid region, offering insights into ecological consequences.
These studies collectively suggest a complex interplay between climate change and precipitation patterns in India48, with potential consequences for the Gangetic Plain's rainfall dynamics. While the reviewed literature provides valuable insights into the broader context of climate change and regional impacts, further research specifically addressing the Gangetic Plain's changing rainy-day trends is warranted to provide a comprehensive understanding of this critical issue.
In summary, changes in rainy day frequency have multifaceted impacts on agriculture, water resources, ecosystems, and human societies. By comprehensively studying these changes, scientists, policymakers, enabling stakeholders to make informed decisions and take proactive measures to tackle the challenges presented by changing precipitation patterns54, ultimately promoting resilience and sustainability with the backdrop of a changing climate.
Study Area, Data and Methodology
Study Area and Data Sources
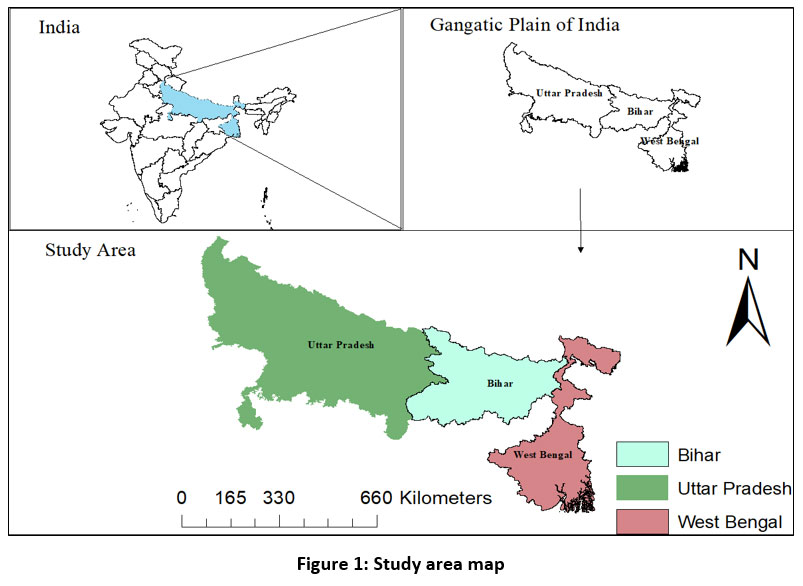 | Figure 1: Study area map
|
The present study area encompasses the Gangetic Plain of India, including West Bengal, Bihar, and Uttar Pradesh states, as depicted in Figure 1. The study area experiences a subtropical climate characterized by hot summers and mild winters. This region is heavily influenced by the Indian summer monsoon48, with the majority of its rainfall occurring during the monsoon season from June to September.
Precipitation data used throughout this probe were obtained from the51 India Meteorological Department (IMD).45 The dataset covers the years 1901 to 2020 for the month of June, July, August and September (JJAS) i.e., summer monsoon season of India (SMSI) and is available at a nominal spatial resolution of 0.25° x 0.25°. For study area purpose the dataset used were obtained from Diva-GIS.
Methodology
The number of rainy days49 count as the IMD criterion i.e. daily rainfall is larger than or close to 2.5mm51. in the month of June, July, August and September for the decadal period 1901-10 to 2011-20. The mean of the data48 is calculated by the formula:
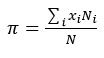
where i vary from 1 to 12 and N = 12.
X define as the amount of precipitation while N is the number of decadal period.
The standard error of the mean (SEM) is a measure of the variability of sample means around the population mean. The calculation entails utilizing both the standard deviation of the sample and the square root of its size. The formula for the standard error of the mean is:

where s = standard deviation for the sample, n = sample size.
The standard deviation (o) can give us an idea of how much individual no. of rainy days values deviate from the average. It is calculated using48 the following formula:
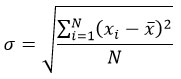
where N = number of data points. = individual data point, = mean (average) of the data set.
Minimum = Smallest worth inside the collection.
Maximum = highest worth inside the collection.
Quartile 1 (Q1): Q1 = Median of first observations.
Quartile 3 (Q3): Q3 = Median of last observations.
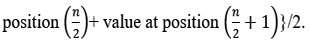
And median of the data set is calculated by
If the data point is odd then median is middle value.
If data point is even then median is calculated by the formula: median = {value at position + value at position }/2.
The climate Data were extracted using CDO and 5-D environment in GrADs software. And data extraction on study area and spatial plot were drawn by using GrADs.Sen's slope estimator is employed to determine the extent of linear trends, commonly utilized within the examination of hydro-meteorological data sequences. Sen’s slope estimator (B)47 is the least square regression and is widely used for calculating the extent of linear trends in large data46.
Where

Here 1
And xi and xj are two data set at the point i and j.
Results
Statistical analysis
From Table-1 the no. of rainy days counted for the month of (a) June, (b) July, (c) August and (d) September56 (JJAS) and their respective statistical analysis considering the mean, median, standard deviation and quartiles’ analysis.
Noteworthy is the fact that the the standard deviation serves as a measure of how much the rainfall values vary from the mean. A higher standard deviation demonstrates that the rainfall values are more spread out57, Nevertheless, a reduced standard deviation suggests that the rainfall values are more concentrated around the mean25. The data also shows that the median rainfall for June, July, August, and September is higher than the mean rainfall for these months. This indicates that there is a slight positive skewness (Positive skewness in a distribution refers to the situation where the right tail (the larger values) of the distribution is longer or fatter than the left tail (the smaller values)51. Stated differently, the distribution has a longer or stretched-out tail on the positive side of the mean.43) in the rainfall distribution, meaning that there are more years with above-average rainfall than there are years with below-average rainfall.
Overall, the data suggests that rainfall during the summer months in India is relatively predictable, with a mean rainfall of around 230-295 mm per month. However, there is also a significant amount of variations in precipitation annually, as demonstrated by the standard deviation values.
Table 1: Number of rainfall days in decadal year in the month of (a) June, (b) July, (c) August and (d) September56
| 1901-10 | 1911-20 | 1921-30 | 1931-40 | 1941-50 | 1951-60 | 1961-70 | 1971-80 | 1981-90 | 1991-2000 | 2001-10 | 2011-20 |
June | 221 | 243 | 227 | 239 | 227 | 235 | 236 | 232 | 226 | 231 | 224 | 226 |
July | 293 | 293 | 303 | 300 | 301 | 297 | 296 | 301 | 298 | 303 | 293 | 295 |
August | 299 | 298 | 304 | 287 | 301 | 302 | 298 | 287 | 289 | 300 | 290 | 285 |
September | 229 | 226 | 240 | 238 | 251 | 240 | 238 | 231 | 240 | 238 | 229 | 226 |
Table 2: Statistical values for the no. of rainfall event.
Variable | N | Mean | SE Mean | StDev | Minimum | Q1 | Median | Q3 | Maximum | Sen’s Slope (at 95% confidence level) | Nature |
June | 12 | 230.58 | 1.90 | 6.60 | 221.00 | 226.00 | 229.00 | 235.75 | 243.00 | -1 | D |
July | 12 | 297.75 | 1.10 | 3.82 | 293.00 | 293.50 | 297.50 | 301.00 | 303.00 | 0 | N |
August | 12 | 295.00 | 1.97 | 6.84 | 285.00 | 287.50 | 298.00 | 300.75 | 304.00 | -1.125 | D |
September | 12 | 235.50 | 2.14 | 7.42 | 226.00 | 229.00 | 238.00 | 240.00 | 251.00 | -0.2792208 | D |
D = Decreasing, N= Neither decreasing nor increasing
Trend Analysis
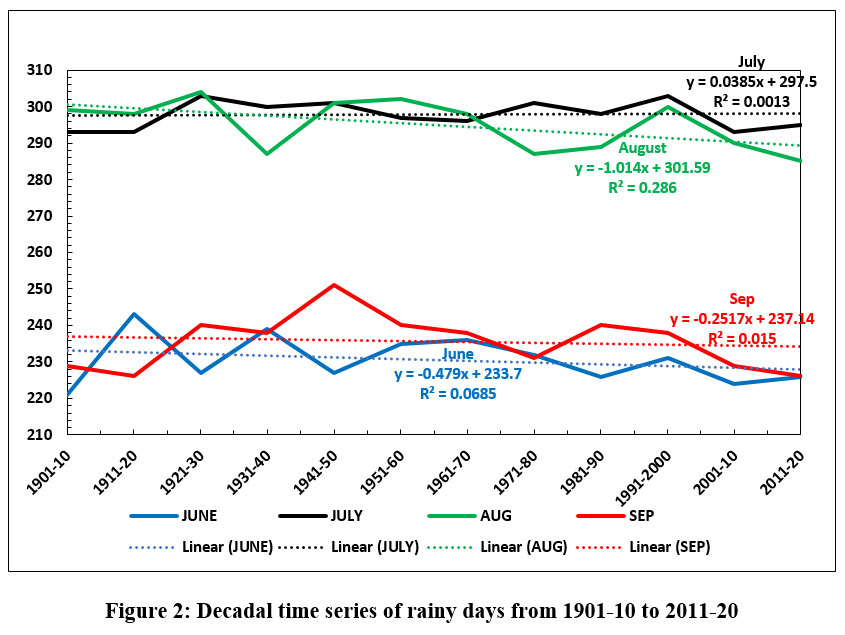 | Figure 2: Decadal time series of rainy days from 1901-10 to 2011-20
|
Trend analysis of the data in my study area was employed to examine the temporal evolution of rainy days in the Gangetic Plain35. We used linear regression to assess patterns in the quantity of rainy days over the specified time period (1901-2022). The analysis focused on quantifying the direction and significance of trends, indicating whether there's been an discernible increase or reduction in the quantity of rainy days. This study, we saw that in longer period (decadal period) the trend of three months i.e. June, August and September are decreasing but the month of August are much more decreasing in terms of rainy days (IMD criteria for rainy days is at least 2.5 mm of daily rainfall)20 while July has no any significant trend. The same is also verified aided by the value of r-square which shows that the corelation in the month of august is high while rest of the other is low. The value of Sen’s slope shows that in the month of June, August and September the trend nature is decreasing while in the month of July it is neutral. Seasonal trends were explored to capture variations in different timeframes.
Spatial and Temporal Scope
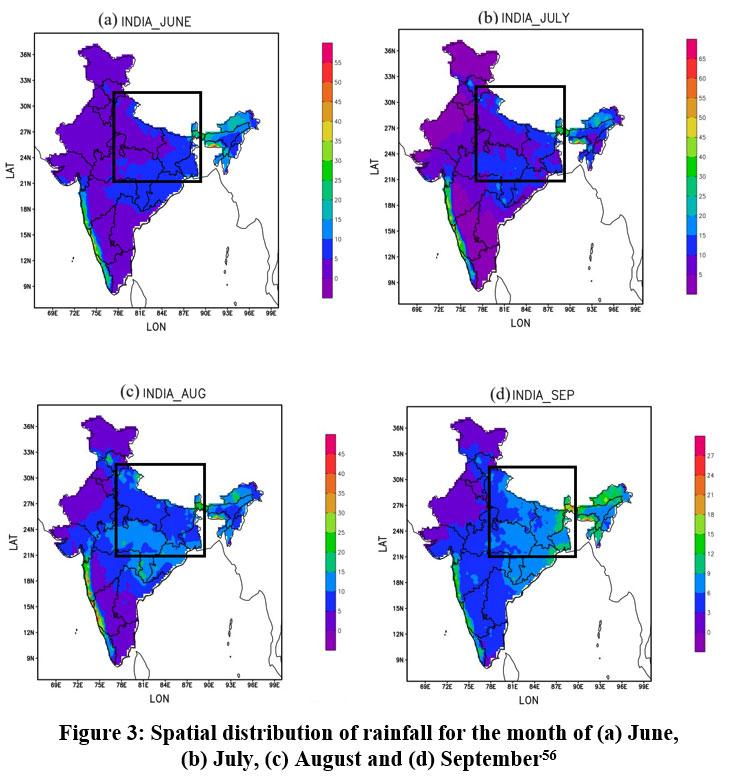 | Figure 3: Spatial distribution of rainfall for the month of (a) June, (b) July, (c) August and (d) September56
|
The spatial scope of this study encompasses the entirety of the Gangetic Plain, encompassing Uttar Pradesh, West Bengal and Bihar. The analysis considers the entire time series from 1901 to 2022 to comprehensively capture long-term precipitation trends. Analysis of the spatial and temporal aspects of rainfall48 (IMD) over the Gangetic Plain of India for the month of JJAS in decadal variation from 1901-10 to 2011-20 can suggest the following:
The Gangetic Plain receives the highest rainfall during the JJAS months, with the heaviest rainfall occurring in the eastern and northeaster parts of the region. There is a general decrease in rainfall from east to west, with the western parts of the Gangetic Plain receiving less rainfall than the eastern and northeastern parts3. The spatial arrangement of rainfall over the Gangetic52 Plain has shown some variability over the past century, with some regions experiencing higher rainfall levels and others experiencing a decrease in rainfall36.
The overall trend in rainfall over48 the Gangetic Plain during the JJAS months has been one of a slight increase. However, There's been an significant interdecadal variability in rainfall, with some decades experiencing above-average rainfall and others experiencing below-average rainfall11.
In recent decades, There's been an trend towards more extreme rainfall events over49 the Gangetic Plain. This means that there are more days with very heavy rainfall, as well as more days with very little or no rainfall28.
Conclusion
The typical quantity of days with rain has decreased48 in three monsoon months (June, August, and September) while July has no trend over the Gangetic Plain, with the decrease being most pronounced in August20. We calculated the rainy days decadal-wise that is 1901-10 to 2011-20 and found the decrease in rainy days. This declination in rainy days is more in the month of August (sen’s slope = -0.125) while June and September have less while July has no such declination type trends(sen’s slope = 0.0). The rainy days are more frequent in July and August while less in June and September which is quite obvious as June is the month in which monsoon starts in that region while September is the withdrawing month of the monsoon season. The standard deviation for July is 3.82 which is small compared to other three months. It indicates that variability in July is less while for the September, it is 7.42 which means variability is high in September. The data also shows that the51 median rainfall for all four months is higher than the mean rainfall, indicating a slight positive skewness in the rainfall distribution. The spatial as well as the chronological trends of rainfall in the49 Gangetic Plain note that the region receives the highest rainfall during the JJAS months, with the heaviest rainfall occurring in the eastern and north-eastern parts3. There is a widespread decline in rainfall from east to west, and the arrangement of the rainfall has shown some variability over the past century. The overall trend in rainfall over48 the Gangetic Plain during the JJAS months has been one of a slight increase, but there has been significant interdecadal variability11. In recent decades, there has been trend towards more extreme rainfall events, with more days of very heavy rainfall and more days of very little or no rainfall.
The decreasing number of rainy days48 throughout the monsoon season can provide valuable insights for devising mitigation and adaptation measures in several ways:Understanding Climate Trends: It is beneficial to comprehend the long-term climate trends and variations, which are essential for designing effective adaptation strategies.Water Resource Management: Knowing about the decrease in rainy days can inform water resource management policies and practices, helping authorities plan for water scarcity and drought conditions throughout the monsoon season.
Agricultural Planning: Farmers can adjust their cropping patterns and irrigation strategies based on the changing rainfall patterns, minimizing the impact of reduced rainy days on agricultural productivity.
Infrastructure Planning: Urban planners and engineers can use this information to create robust infrastructure that can endure extreme weather conditions and addressing potential challenges posed by decreased rainfall.
Disaster Preparedness: It aids in disaster preparedness efforts by allowing communities and emergency responders to anticipate and mitigate the dangers connected with changing precipitation patterns, include flooding and landslides.
Ecosystem Management: Conservation efforts can be tailored to address the impacts of reduced rainfall on ecosystems and biodiversity, preserving critical habitats.
So, the results of this study50 have important implications for water management and55 agriculture, Urban planning, Risk assessment and insurance, awareness and education and last but not least Research and Development in the Gangetic Plain. The dwindling quantity of rainy days49 and the trend towards more extreme rainfall events pose challenges for water managers. Adaptation strategies are needed to address these challenges and protect people and property from flooding and drought.
Acknowledgments
I would like to thank Central University of South Bihar for granting the Ph.D. research work. The Department of Environmental Science, Gaya, is highly appreciated for allowing the GIS and other laboratory work.
Funding source
There is no funding or financial support for this research work.
Conflict of interest
There is no Conflict of interest for this article.
Authors’ Contribution
All work is done by the first author Mr. Devendra Kumar Tiwari under the guidance of the corresponding author Professor P. Parth Sarthi.
Data Availability Statement
The manuscript incorporates all datasets produced or examined throughout this research study.
Ethics Approval Statement
There is no study involving an experiment on humans and animals in the paper.
References
- Alexander, L. V., Zhang, X., Peterson, T. C., Caesar, J., Gleason, B., Tank, A. M. G. K., Haylock, M., Collins, D. J., Trewin, B., Rahimzadeh, F., Tagipour, A., Kumar, K., Revadekar, J. V., Griffiths, G. M., Vincent, L. A., Stephenson, D. B., Burn, J., Aguilar, E., Brunet, M., . . . Vázquez-Aguirre, J. L. (2006). Global observed changes in daily climate extremes of temperature and precipitation. Journal of Geophysical Research, 111(D5). https://doi.org/10.1029/2005jd006290
CrossRef - Ashfaq, M., Shi, Y., Tung, W., Trapp, R. J., Gao, X., Pal, J. S., & Diffenbaugh, N. S. (2009). Suppression of south Asian summer monsoon precipitation in the 21st century. Geophysical Research Letters, 36(1). https://doi.org/10.1029/2008gl036500
CrossRef - Chakraborty, T., & Chakraborti, S. K. (2014). Spatio-temporal variability of rainfall over the Indo-Gangetic Plain during the monsoon season. Theoretical and Applied Climatology, 118(3-4), 561-574.
- Cherchi, A., Alessandri, A., Masina, S., Navarra, A., 2011. Effects of increased CO2 levels on monsoons. Clim. Dyn. http://dx.doi.org/10.1007/s00382-010-0801-7 (online).
CrossRef - Dai, A. (2010). Drought under global warming: a review. WIREs Climate Change, 2(1), 45–65. https://doi.org/10.1002/wcc.81
CrossRef - Das, P.K., 2009. The Monsoon. National Book Trust, India.
- Gadgil, S., Vinayachandran, P. N., Francis, P. A., & Gadgil, S. (2004). Extremes of the Indian summer monsoon rainfall, ENSO and equatorial Indian Ocean oscillation. Geophysical Research Letters, 31(12). https://doi.org/10.1029/2004gl019733
CrossRef - Gadgil, S. (2003). The Indian Monsoon and its variability. Annual Review of Earth and Planetary Sciences, 31(1), 429–467. https://doi.org/10.1146/annurev.earth.31.100901.141251
CrossRef - Gadgil, S., Srinivasan, J., Nanjundiah, R. S., Kumar, K., Munot, A. A., & Kumar, K. (2002). On forecasting the Indian summer monsoon: The intriguing season of 2002. Current Science, 83(4), 394–403. http://www.iisc.ernet.in/~currsci/aug252002/394.pdf
- Goswami, B. N., Venugopal, V., Sengupta, D., Madhusoodanan, M. S., & Xavier, P. K. (2006). Increasing trend of extreme rain events over India in a warming environment. Science, 314(5804), 1442-1445.. http://dx.doi.org/10.1126/science.1132027.
CrossRef - Goswami, B. N., Gaonkar, R. P., Sengupta, D., Mandal, S., Chatterji, A., Panigrahi, J. N., ... & Jayaraman, M. (2010). Decadal variability of JJAS rainfall over India during 1901–2006. Climate Dynamics, 34(3-4), 517-532.
- Goswami, et al., 2006. Increasing trend of extreme rain events over India in a warming environment. Science 314, 1442–1445. http://dx.doi.org/10.1126/science.1132027.
CrossRef - Guhathakurta, P., & Rajeevan, M. (2007). Trends in the rainfall pattern over India. International Journal of Climatology, 28(11), 1453–1469. https://doi.org/10.1002/joc.1640
CrossRef - Solomon, S. L. (2007). Climate change 2007: the physical science basis: contribution of Working Group I to the Fourth Assessment Report of the Intergovernmental Panel on Climate Change. https://boris.unibe.ch/71452/
- Jadhav, S. K., & Munot, A. A. (2009). Spatio-temporal variation of southwest monsoon rainfall and its influence on agricultural productivity over Gujarat, India. Theoretical and Applied Climatology, 96(3-4), 283-297.
CrossRef - Kitoh, A., Endo, H., Krishna Kumar, K., Cavalcanti, I.F.A., Goswami, P., Zhou, T., 2013. Monsoons in a changing world: a regional perspective in a global context. J. Geophys. Res. 118, 3053–3065. http://dx.doi.org/10.1002/jgrd.50258.
CrossRef - Kripalani, R., Kulkarni, A., Sabade, S., Khandekar, M., 2003. Indian monsoon variability in a global warming scenario. Nat. Hazards 29, 189–206.
CrossRef - Kucharski, F., Scaife, A. A., Yoo, J. H., Folland, C. K., Kinter, J., Knight, J., ... & Zhou, T. (2009). The CLIVAR C20C project: skill of simulating Indian monsoon rainfall on interannual to decadal timescales. Does GHG forcing play a role. Climate dynamics, 33, 615-627. http://dx.doi.org/10.1007/s00382-008-0462-y.
CrossRef - Kumar, K., Pant, G. B., Parthasarathy, B., & Sontakke, N. A. (1992). Spatial and subseasonal patterns of the longterm trends of Indian summer monsoon rainfall. International Journal of Climatology, 12(3), 257–268. https://doi.org/10.1002/joc.3370120303
CrossRef - Kumar, P., Kumar, S., & Kumar, A. (2023). Changing pattern of precipitation and its impact on rice productivity in Bihar, India. MDPI. Retrieved November 11, 2023, from https://www.mdpi.com/2071-1050/12/17/7023
- Rupa Kumar, K., Krishna Kumar, K., Ashrit, R. G., Patwardhan, S. K., & Pant, G. B. (2002). Climate change in India: Observations and model projections. Climate Change and India: Issues, Concerns and Opportunities. Tata McGraw-Hill Publishing Company Limited, New Delhi.
- Lal, M., Cubasch, U., Voss, R., Waszkewitz, J., 1995. Effect of transient increase in greenhouse gases and sulphate aerosols on monsoon climate. Curr. Sci. 69, 752–763.
- Lal, M., Nozawa, T., Emori, S., Harasawa, H., Takahashi, K., Kimoto, M., Abe-Ouchi, A., Nakajima, T., Takemura, T., Numaguti, A., 2001. Future climate change: Implications for Indian summer monsoon and its variability. Curr. Sci. 81, 1196–1207.
- Menon, A., Levermann, A., Schewe, J., 2013a. Enhanced future variability during India0s rainy season. Geophys. Res. Lett. 40 (12), 3242–3247. http://dx.doi.org/10.1002/grl. 50583.
CrossRef - Montgomery, D. C., & Runger, G. C. (2010). Applied statistics and probability for engineers. John Wiley & Sons.
CrossRef - Mooley, D., Parthasarathy, B., 1984. Fluctuations in All-India summer monsoon rainfall during 1871–1978. Clim. Chang. 6, 287–301.
CrossRef - Pant, G. B., & Kumar, K. R. (1997). Climates of south Asia. Wiley.
- Pant, R., & Kumar, S. (2023). Will warming climate affect the characteristics of summer monsoon rainfall and associated extremes over the Gangetic Plains in India? Earth and Space Science, 10(2), e2022EA002741.
CrossRef - Parthasarathy, B. (1995). Monthly and seasonal rainfall series for all India homogeneous regions and meteorological subdivisions: 1871-1994. Indian Institute of Tropical Meteorology Research Report, RR-65.
- Parth-Sarthi, P., Dash, S.K., Ashu, Mamgain, 2012. Possible changes in the characteristics of Indian Summer Monsoon under warmer climate. Glob. Planet. Chang. 92–93, 17–29. http://dx.doi.org/10.1016/j.gloplacha.2012.03.006 (2012).
CrossRef - Peterson, T. C., Easterling, D. R., Karl, T. R., Groisman, P., Nicholls, N., Plummer, N., Torok, S., Auer, I., Boehm, R., Gullett, D., Vincent, L., Heino, R., Tuomenvirta, H., Mestre, O., Szentimrey, T., Salinger, J., Førland, E. J., Hanssen-Bauer, I., Alexandersson, H., Jones, P., & Parker, D. (1998). Homogeneity adjustments of in situ atmospheric climate data: a review. International Journal of Climatology, 18(13), 1493-1517.
CrossRef - Rai, A., Bhaskaran, B., & Kumar, S. (2020). Increasing trend of extreme precipitation events over the Gangetic Plains of India. International Journal of Climatology, 40(13), 5049-5062.
- Sengupta, D., Goswami, B. N., Chattopadhyay, R., & Sahany, S. (2013). Century-scale changes in trends and extremes of monsoon rainfall in India. Scientific Reports, 3, 2196.
- Shashikanth, K., Ghosh, S., & Karmakar, S. (2018). Future projections of Indian summer monsoon rainfall extremes over India with statistical downscaling and its consistency with observed characteristics. Climate Dynamics, 51, 1-15.
CrossRef - Singh, S., & Sontakke, N. (2002). Long-term rainfall variability in the eastern Gangetic Plain in relation to global temperature change. International Journal of Climatology, 22(6), 775-787.
- Sontakke, N., Singh, H., & Singh, N. (2008). Long-term rainfall variability in the eastern Gangetic Plain in relation to global temperature change. International Journal of Climatology, 22(6), 775-787.
- Sun, S., Li, Z., Liu, Y., Zhang, T., & Liu, C. (2019). Changing precipitation and its impacts on vegetation productivity in a semi-arid region in Inner Mongolia, China. Remote Sensing of Environment, 224, 242-254.
- Trenberth, K. E., Jones, P. D., Ambenje, P., Bojariu, R., Easterling, D., Klein Tank, A., Parker, D., Rahimzadeh, F., Renwick, J. A., Rusticucci, M., Soden, B., Zhai, P., & Mote, P. W. (2007). Observations: Surface and atmospheric climate change. In S. Solomon, D. Qin, M. Manning, Z. Chen, M. Marquis, K. B. Averyt, M. Tignor, & H. L. Miller (Eds.), Climate Change 2007: The Physical Science Basis. Contribution of Working Group I to the Fourth Assessment Report of the Intergovernmental Panel on Climate Change (pp. 239-337). Cambridge University Press.
- Turner, A., Annamalai, H., 2012. Climate change and the South Asian summer monsoon. Nat. Clim. Chang. 2, 587–595.
CrossRef - Van-Vuuren, D., den-Elzen, M., Lucas, P., Eickhout, B., Strengers, B., van-Ruijven, B., Wonink, S., van-Houdt, R., 2007. Stabilizing greenhouse gas concentrations at low levels: an assessment of reduction strategies and costs. Clim. Chang. 81 (2), 119
CrossRef - Van-Vuuren, D.P., Edmonds, J., Kainuma, M.L.T., Riahi, K., Thomson, A., Matsui, T., Hurtt, G., Lamarque, J.F., Meinshausen, M., Smith, S., Grainer, C., Rose, S., Hibbard, K.A., Nakicenovic, N., Krey, V., Kram, T., 2011a. Representative concentration pathways: An overview. Clim. Chang. 109, 5–31. http://dx.doi.org/10.1007/ s10584-011-0148-z (in this issue).
CrossRef - Wang, G., Zhai, P., Zhang, X., & Ren, G. (2019). Changes in daily precipitation extremes over China from 1961 to 2016 based on three high-quality daily observational datasets. Atmospheric and Oceanic Science Letters, 12(2), 149-157.
- Westfall, P. H. (2014). Kurtosis and skewness: Statistical measures of shape. In Encyclopedia of Statistics in Behavioral Science (Vol. 1, pp. 646-651). Elsevier.
- Zhang, X., Zwiers, F. W., Hegerl, G. C., Jones, P. D., Hulme, M., & Stephenson, D. B. (2007). Trends in global precipitation patterns: 1901-2002. Journal of Climate, 20(12), 2510-2524.
- Pai, D. S., Sridhar, L., Rajeevan, M., Sreejith, O. P., Satbhai, N. S., & Mukhopadhyay, B. (2014). Development of a new high spatial resolution (0.25° × 0.25°) long period (1901-2010) daily gridded rainfall data set over India and its comparison with existing data sets over the region. Mausam, 65(1), 1–18. https://doi.org/10.54302/mausam.v65i1.851
CrossRef - Kumar, S., Sarthi, P. P., Barat, A., & Sinha, A. (2022). Variability in meteorological droughts as pivotal mechanism for rice production over the middle gangetic plains. Paddy and Water Environment, 20(4), 499–516. https://doi.org/10.1007/s10333-022-00907-5
CrossRef - Sen, P. K. (1968). Estimates of the regression coefficient based on Kendall’s TAU. Journal of the American Statistical Association, 63(324), 1379–1389. https://doi.org/10.1080/01621459.1968.10480934
CrossRef - Praveen, B., Talukdar, S., Shahfahad, Mahato, S., Mondal, J., Sharma, P., Islam, A. R. M. T., & Rahman, A. (2020). Analyzing trend and forecasting of rainfall changes in India using non-parametrical and machine learning approaches. Scientific Reports, 10(1). https://doi.org/10.1038/s41598-020-67228-7
CrossRef - Pohl, B., Macron, C., & Monerie, P. (2017). Fewer rainy days and more extreme rainfall by the end of the century in Southern Africa. Scientific Reports (Nature Publishing Group), 7(1). https://doi.org/10.1038/srep46466
CrossRef - Bilalova, S., Newig, J., Tremblay-Lévesque, L., Roux, J., Herron, C., & Crane, S. W. (2023). Pathways to water sustainability? A global study assessing the benefits of integrated water resources management. Journal of Environmental Management, 343, 118179. https://doi.org/10.1016/j.jenvman.2023.118179
CrossRef - McErlich, C., McDonald, A. J., Schuddeboom, A., Vishwanathan, G., Renwick, J., & Rana, S. (2023). Positive correlation between wet-day frequency and intensity linked to universal precipitation drivers. Nature Geoscience, 16(5), 410–415. https://doi.org/10.1038/s41561-023-01177-4
CrossRef - Athira, K. S., Roxy, M. K., Dasgupta, P., Saranya, J. S., Singh, V. K., & Attada, R. (2023). Regional and temporal variability of Indian summer monsoon rainfall in relation to El Niño southern oscillation. Scientific Reports, 13(1). https://doi.org/10.1038/s41598-023-38730-5
CrossRef - Thackeray, C. W., Hall, A., Norris, J., & Chen, D. (2022). Constraining the increased frequency of global precipitation extremes under warming. Nature Climate Change, 12(5), 441–448. https://doi.org/10.1038/s41558-022-01329-1
CrossRef - Rahimi, M., Ahmadaali, K., & Goli, A. M. (2023). Revealing Regime Shifts and Their Impact on Social-Ecological Systems: a Case Study on Iran. Water Conservation Science and Engineering, 8(1), 56. http://dx.doi.org/10.1007/s41101-023-00231-x
CrossRef - Pardo-Jaramillo, S., Muñoz-Villamizar, A., & Gómez, J. E. (2023). Unveiling the influence of COVID-19 on the online retail market: A comprehensive exploration. Journal of Retailing and Consumer Services, 75, 103538. https://doi.org/10.1016/j.jretconser.2023.103538
CrossRef - Mikelsons, K., & Wang, M. (2021). Global clear sky near-surface imagery from multiple satellite daily imagery time series. ISPRS Journal of Photogrammetry and Remote Sensing, 180, 238–254. https://doi.org/10.1016/j.isprsjprs.2021.08.013
CrossRef - Gokhale, P. N., Patil, B. R., & Joshi, S. (2023). Image extraction approaches for density count measurement in obstruction renography using Radiotracer 99MTC-DTPA. In Lecture notes in networks and systems (pp. 57–71). https://doi.org/10.1007/978-981-99-7093-3_4
CrossRef


