Groundwater Contamination in Perspective of Different Elements, Water Quality Index and Health Implications
Lovely Sarkar
*

1
Department of Chemistry,
Siliguri College, Siliguri, Darjeeling,
West Bengal
India
Copy the following to cite this article:
Sarkar L. Groundwater Contamination in Perspective of Different Elements, Water Quality Index and Health Implications. Curr World Environ 2024;19(1).
Copy the following to cite this URL:
Sarkar L. Groundwater Contamination in Perspective of Different Elements, Water Quality Index and Health Implications. Curr World Environ 2024;19(1).
Citation Manager Publish History

Introduction
Only around 2.5% of the entire water on earth is considered as a source of fresh water.1 Moreover, utmost fresh water sources occur in the forms of ice that cannot be utilized by human society readily. Ecological as well as social consumers access the surface and also ground water as the chief sources of water. Due to both factors space with time accessibility, virtuous constancy, affluent availability, noble feature, confrontation with contamination and so forth, groundwater has incomparable advantages in context of surface water sources.2 Water contamination may occur when undesirable materials come into the water body resulting in change of water quality resembling physical and chemical characteristics that may cause several health diseases to human and affect the environment as well. As a consequence, socio economic development support primarily for the groundwater resources.3 It has been observed that more than 50% of this entire world populace depend on groundwater resource for diurnal household works and other requirements. On the other hand, hydrochemical quality signifying the presence of NO3-, F-, Mn, Zn etc., is the necessary criterion of ground water application that is vital to vigor of humanoid noteworthy for the entire social progress.4
This is very important to study the chemistry of groundwater and its accompanied dangers to human beings for the civilization and human sustainable development, specifically in the areas those are suffering from paucity of surface water as water effluence endures worldwide predicament and the entire community is on the threshold of worst consequences because of contaminated water. Key aquatic resources toxicity cause emancipation of household and agricultural debris, increasing populace evolution, frequent usage of chemical pesticides, composts etc. In the course of the long habitation period, it takes abundant period to interrelate with the adjacent means of aquifers,5 furthermore different destructive rudiments along with other toxic elements can be miscible too.6 In addition, numerous peripheral rudiments and external toxic components are observed to be raised in groundwater resources in current periods in different areas around the world.7-8 As for example, nitrogen containing elements like ammonia, nitrates, nitrites present in aquifers have got elevated in countryside including urban regions throughout this world.
It is to be noted that not only rural but people of urban areas also defecate in open areas. Urbanization can also cause various infectious diseases. In this context, overpopulation, polluted conditions, precarious drinking water create a major problem regarding health issues specifically in urban regions. The extent of noxious metal components exist in groundwater sources also reveals prompt growth in several locales like landfill, waste water and domesticated water irrigation domains, mining regions and manufacturing sites.9 The day by day deterioration of water excellence are being reported in several aquifers worldwide. Mainly eviction of domiciliary and manufacturing sewage trashes, seepage deriving out of water reservoirs, seafaring disposal, radioactive surplus and atmospheric accumulation are significant sources of aquatic adulteration.
Human beings and animals get affected directly or indirectly by the heavy metals that are disposed of in terms of industrial wastes as they can accumulate in nearby water bodies, lakes and rivers. Infectious diseases as for example cholera, enteric fever10 and like distinct diseases like dysentery, vomiting, gastroenteritis, dermatological difficulties, renal difficulties are increasing by means of contaminated water sources.11 Human well-being is supposed to be in danger because of the agrarian expansion predominantly regarding extreme practice of manures as well as contaminated circumstances.12 Due to anthropogenic activities associated with wide-ranging urbanization, agronomic works, industrial development along with populace growth have resulted in water feature deterioration all concern of the world.13 A large extent of association between pollution and health issues is proved. A number of diseases which are water borne, can spread man to man.14 Also a downpour rainfall, overflows those are allied to utmost weather conditions may cause discrete illnesses for advanced and emergent nations in our world.15 In view of World Health Organization, a total of 10% populace intake the foodstuff, herbages those are produced in polluted water. According to Jabeen et al., mortality rate because of cancer is greater in country side in comparison to urban regions due to use of treated water for drinking by the urban inhabitants whereas rural people can not avail the facility to have treated water and have to use unprocessed water for daily work and other necessities.16 In this context comparatively impoverished individuals are at higher threat of affliction owing to inappropriate immaculateness, asepsis and water supply.
Further, adulterated water devours a large negative impact on the pregnant women who are exposed to chemicals directly or indirectly that ultimately causes the augmenting degree of low natal weight resulting in antenatal physical condition of the new borns.17
Analysis of WQI presents an inclusive representation of surface including ground water excellence especially used for domestic works. WQI is enumerated as a grade which reveals the combined effect of different water eminence factors.18 It is a very imperative tool to judge water excellence of ground water and also review its felicitous for consumption purposes.19-22 A single numerical expression of the water quality index that encapsulates the various physico-chemical features of the tested water that can measure the overall water quality. WQI means that if its value is less deviated from the standard value, the water quality is fairly maintained and can be used for human consumption. In view of the present circumstances regarding water quality, study on water pollution is being selected as a remarkable research area for the researchers and scientists. From different sources of the village, overall 17 samples of groundwater were collected. The results obtained from the present analysis display the amount of various ions present in the samples; Calcium (Ca2+), Sodium (Na+), Potassium (K+), Magnesium (Mg2+), Bicarbonate (HCO3-), Sulphate (SO42-), Chloride (Cl-), Nitrate (NO3-), Fluoride (F-) and elements; Manganese (Mn) and Zinc (Zn) including pH, TH, and TDS values. This paper focuses on the quality index of groundwater, hydrochemical features and groundwater toxicity, potential health risk for the population by pollutants and sources of impurities causing the deterioration of water eminence. For this work, selected 14 parameters were used for determining WQI value for this present study and these parameters were collected from a total of 17 different locations. By determining this WQI values, the variations in water quality at 17 different locations were reviewed and compared.
The chemistry of groundwater and its probable health hazards are of immense importance at the present scenario worldwide. This present study was carried out to ascertain the extent of impurity and accompanying health risks to the local people at Aiho village of Malda district, West Bengal, India. Few ions are observed to exceed the permitted limits in some samples. Presence of excess amount of studied elements may cause health threats to local inhabitants, however, the hazards of Mn and Zn are insignificant. Dermal exposure was found to be quiet unsafe for all residents, whereas, the oral pathway was thought to be unsafe to some extent. Infants and youngsters are prone to F- pollutants, and adult people are affected by NO3- ions predominantly. Anthropogenic as well as geogenic activities and sources are liable for the raised levels of the different ions in the studied samples. Therefore, purified water supply, waste management, practice of rational irrigation is to be encouraged in the studied village. Access to unpolluted potable water is crucial for good health, but dirtied water can be detrimental to the body and cause physical ailments. So it is decisive to examine the physico-chemical parameters of drinking water to regulate its safety. This study can help local inhabitants make informed decisions about the adequacy of water from different sources, as well as take steps to purify it or obtain purified drinking water to prevent diseases. By raising awareness about the importance of pure water and advocating for its provision, we can ensure a healthier sustenance for the locals. The results of the study may be used to inform local policies and practices related to water management and public health.
Study Area and Sampling Sources
The study area, i.e., Aiho village of Malda district is predominantly agronomy centered settlement of West Bengal, India. The area is located at 24.960N 88.240E and sandwiched between two rivers Mahananda and Tangon as depicted in Figure 1. Groundwater samples for their analysis were collected from 12 (sample 1-12) wells and 5 tube wells (sample 13-17) having the depth scale of 30–50 m downwards respectively in the studied village for the period of the month of October 2018 as all the wells and tube wells used by local inhabitants of the studied area for drinking water considered for examination are located in the 17 different nearby residential places of the studied populace. The collected groundwater samples were carried in glass bottles of 500 ml volume that were carefully prewashed by means of distilled water and afterwards target water samples and finally considered for the laboratory analysis within maximum 24 hours.
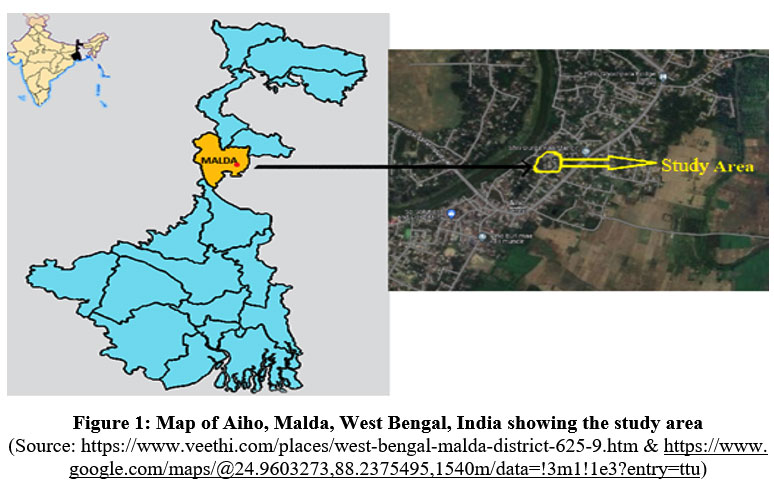 | Figure 1: Map of Aiho, Malda, West Bengal, India showing the study area
|
Materials and methods
The present amount of anions; NO3-, SO42- Cl-, F-, HCO3- ; cations; K+, Na+, Ca2+, Mg2+ and trace elements (Mn, Zn) in the water samples were evaluated by the method as described by APHA.23 The water pH and Total Dissolved Solids (TDS) were observed by the HANNA pH and TDS Meter (HI9814). Total Hardness was analyzed through a titration process by a standard solution of 0.01N EDTA.
A cross-sectional study was conducted for the present research, which included 131 inhabitants of Aiho, comprising 2.22 percent of the total population (5898; 2011 Census of India), including males, females, and children of 38 families living in an area attached to agricultural land, suffering from potable water who were interviewed using a list of prepared questionnaires. Local gram panchayat members, administrative bodies were also taken into consideration for getting other related information.
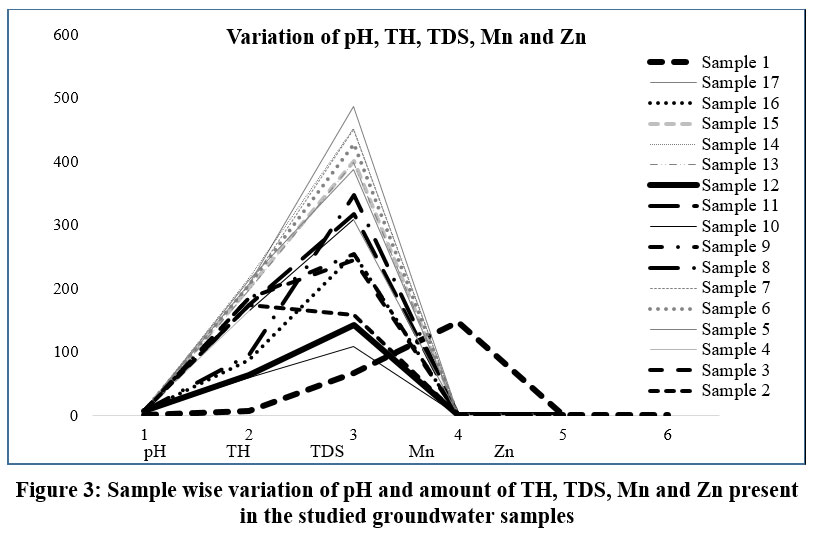
Water quality index is an extremely important and proficient process to get a perfect indication about the quality of water examined by using some essential constraints. In this work, the WQI was estimated by means of the process; weighted arithmetic index as Cude (2001) and Brown et al. (1970).24-25 To determine the WQI, quality rating; Qi and unit weight; Wi were considered and sub-index for all variables were determined through multiplication of the unit weight; Wi and quality rating; Qi. The inclusive WQI was determined by using sum up with regard to sub index for respective parameters by dint of following equation:
To determine the WQI a total of 14 physical characteristics or parameters were selected for this study using BIS standards. Where, Wi denotes a unit weight factor, evaluated through the equation; Wi = K/Si. Si signifies ith parameter’s standard value and K stands for constant of proportionality.
Qi is assessed through the help of the equation: Qi = 100 (Vi – V10) / (Si – V10) indicating quality rating regarding parameter of nth water quality.
Vi signifies assessed magnitude of the nth parameters for a specified sampling station. Si denotes standard approved value based on nth parameter. V10 stands for ideal or model value of the nth parameter for uncontaminated water. For the potable water, the entire ideal values; V10 are ruminated as ‘0’ excluding for pH value of 7.0.
Hydrochemical Features
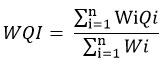
The leading cation present in most of the water samples is (Ca2+), with the concentration range between 23 mg/L to 169.2 mg/L. In view of BIS 200926 the tolerable border of Ca2+ ions are subordinate than 75 mg/l and this is not adhered to any of the studied samples of water in the area except sample 8, 12 and 16. Das et al. (2020) discovered a remarkably similar range of analogies.27
The sodium ion (Na+) intensity of the tested water differed from 2.9 to 121 mg/L in the present study. Sodium ions help to maintain blood pressure, fluid levels and even play a significant role in maintaining normal nerve and muscle function. BIS 200926 educes an anticipated sodium intentness of 200 mg/L in potable water. The level of Potassium (K+) ion in water samples diverged from 2.1 to 11.6 mg/L which is within the permissible limit as mentioned by BIS 199128: 50 mg/L. Among all the significant studied, Mg2+ ions are acquired to have relatively low concentration, ranging from 4.9 mg/L to 71.5 mg/L as also depicted by Das et al. (2020)27 which exceeds the permissible threshold value of BIS 201229: 30 mg/L except for sample 2, 4, 6, 8 and 9. Further from the physico-chemical study it was reported that HCO3- anion is one of the prevailing anions, alongside concentrations varying from 81 mg/L to 187 mg/L which is within the range of acceptable limit by BIS 200926: 200 mg/L, followed by the anion SO42- with concentration of 29.5 mg/L, 87.2 mg/L which is also in the suitable range (BIS 201229: 200 mg/L) as the minimum and maximum values, respectively. The Cl- anion concentrations range from 5.8 mg/L to 74 mg/L which is in the permissible limit as the approbation border for the ion Cl- is 250 mg/l as per BIS, 2009.26
Nitrogen as one of the important element was identified in the under groundwater samples in the studied locale. The extent of NO3- ion presents in the experimental water samples assorted from 0.09 to 10.7 mg/L as represented by Das et al. (2020)27 too, was detected within the tolerable limits as per BIS 201229: 45 mg/L. The presence of NO3- ions may be caused by elevated intrusion of soil crust including anthropogenic endeavors. In the drinkable water, occurrence of intense nitrate ion concentration may cause intestinal malignancy and some other prospective threats to the expecting other. The involvements of anthropogenic sources in these studied areas are also responsible to elevate the TDS concentration of ground water. The amount of F- anions is supposed to be in the range of 1.4–4.6 mg/L in the samples signifying not within permitted range as guided by BIS 201229: 1 mg/L. The concentrations of Na+, SO42-, and F- ions were found to be higher, while HCO3- and Cl- ions were smaller, with K+ ions being relatively consistent in the present study in comparison to the investigation conducted by Batabyal et al. (2015).30 Presence of the above cations including anions are depicted in Table 1, and Figure 2.
Table 1: Amount of various ions present in the investigated groundwater samples
Sample No. | Concentration of Cations and Anions in mg/L | ||||||||
Ca2+ | Na+ | K+ | Mg2+ | HCO3- | SO42- | Cl- | NO3- | F- | |
1 | 131.5 | 121 | 11.1 | 54.2 | 84.2 | 74.3 | 36.8 | 0.09 | 2.3 |
2 | 134.8 | 56.2 | 9.3 | 13.5 | 91.5 | 87.2 | 35.3 | 2.4 | 2.1 |
3 | 151.1 | 64.2 | 8.2 | 42.6 | 99.1 | 84.3 | 74 | 1.9 | 3.8 |
4 | 79.4 | 12.8 | 8.3 | 21.2 | 175.2 | 72.1 | 54.1 | 0.9 | 1.8 |
5 | 103.4 | 2.9 | 11.6 | 45.8 | 143.7 | 79.5 | 44.2 | 3.4 | 1.4 |
6 | 98.1 | 35.7 | 5.5 | 9.4 | 81 | 58.4 | 45.1 | 2.5 | 2.6 |
7 | 169.2 | 87 | 7.5 | 36.4 | 159.4 | 68.3 | 54.8 | 0.9 | 4.1 |
8 | 59.2 | 44.2 | 9.1 | 4.9 | 125.1 | 29.5 | 59.7 | 9.8 | 3.8 |
9 | 147.2 | 23.5 | 10.2 | 21.7 | 96.2 | 49.7 | 15.4 | 1.4 | 3.7 |
10 | 85.1 | 9 | 6.4 | 30.5 | 85.4 | 78.1 | 19.5 | 3.1 | 2.6 |
11 | 115.8 | 49.2 | 3.1 | 38.7 | 121.6 | 39.7 | 5.8 | 10.7 | 1.9 |
12 | 57 | 112.7 | 3.6 | 40.5 | 125.4 | 45.3 | 25.9 | 7.5 | 1.5 |
13 | 128.5 | 42.5 | 4.8 | 71.5 | 187 | 48.9 | 8.3 | 1.2 | 3.3 |
14 | 139.1 | 52.7 | 2.1 | 71 | 178.1 | 47.4 | 13.6 | 0.4 | 4.6 |
15 | 154.2 | 33.8 | 8.2 | 69.5 | 179.6 | 78.2 | 9.1 | 3.2 | 3.7 |
16 | 23 | 40 | 7.3 | 59.9 | 154.9 | 64.3 | 24.8 | 8.7 | 4 |
17 | 87.4 | 63.8 | 10.3 | 67.4 | 168.3 | 53.7 | 10.7 | 2.7 | 2.8 |
 | Figure 2: Sample wise variation of ions present in the investigated water samples.
|
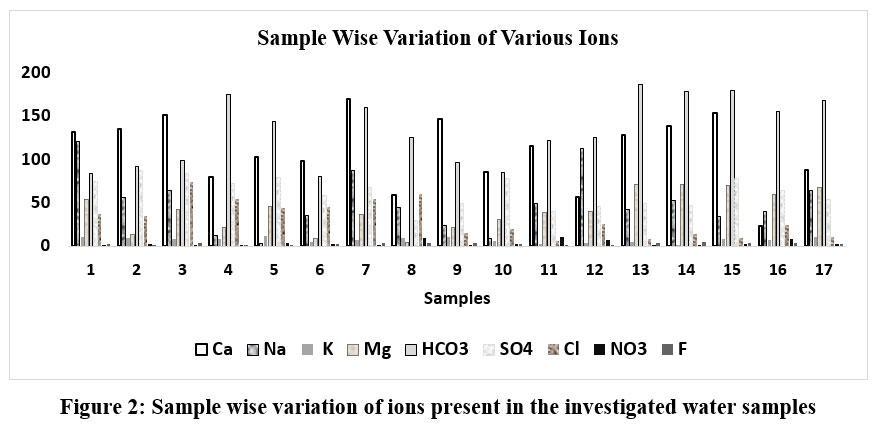
The ground water samples for majority of the experiments as depicted in Table 2, Figure 3 (sample: 1-7, 9, 11, 13-15, 17) are alkaline in nature with a pH range of 7.1–7.7.
Table 2: pH and amount of TH, TDS, Mn and Zn present in the studied groundwater samples.
Sample No. | pH | Physical parameters in mg/L | |||
TH | TDS | Mn | Zn | ||
1 | 7.2 | 67 | 147 | 0.04 | 0.003 |
2 | 7.4 | 174 | 158 | 0.08 | 0.003 |
3 | 7.5 | 185 | 245 | 0.03 | 0.005 |
4 | 7.3 | 165 | 308 | 0.04 | 0.001 |
5 | 7.4 | 214 | 387 | 0.08 | 0.005 |
6 | 7.1 | 205 | 428 | 0.05 | 0.004 |
7 | 7.5 | 206 | 451 | 0.07 | 0.006 |
8 | 6.7 | 95 | 347 | 0.03 | 0.004 |
9 | 7.6 | 185 | 254 | 0.04 | 0.003 |
10 | 5.8 | 59 | 108 | 0.04 | 0.007 |
11 | 7.2 | 174 | 318 | 0.08 | 0.008 |
12 | 6.8 | 64 | 142 | 0.05 | 0.005 |
13 | 7.6 | 198 | 398 | 0.06 | 0.008 |
14 | 7.7 | 217 | 452 | 0.1 | 0.006 |
15 | 7.4 | 201 | 401 | 0.08 | 0.003 |
16 | 6.4 | 87 | 254 | 0.06 | 0.003 |
17 | 7.3 | 208 | 487 | 0.04 | 0.002 |
 | Figure 3: Sample wise variation of pH and amount of TH, TDS, Mn and Zn present in the studied groundwater samples
|
Whereas sample 8, 10, 12, 16 are found to be acidic in nature to some extent with pH ranging from 5.8-6.8. pH values for sample 10 and 16 are only not within permissible limit as described by BIS 201229: 6.5-8.5. Total hardness (TH) of the experimental water samples ranges within 59 mg/L and 217 mg/L. For this case sample 5, 6, 7, 14, 15 and 17 shows the values not suitable as per BIS 201229: 200 mg/L. The amount of total dissolved solids (TDS) are determined from the range 108–487 mg/L which is within permissible limit as maximum of the aquatic bionomic entities regarding various fish, species can be capable in tolerating TDS concentration maximum to 1000 mg/l31 (BIS 201229: 500 mg/L). These results are closely related to the work done by Chatterjee et al. (2007).32 The relatively high concentration of TDS existing in the ground waters were mainly distributed in the agricultural areas along with some sporadic domestic parts of the village. Ground waters of all the sites under investigation are considered as fresh water by the US Geological Survey centered on TDS (TDS in clean water <1000 mg/L; marginally saline water range: 1000–3000 mg/L, fairly saline water range: 3000–10,000 mg/L and highly saline water range: 10,000–35,000 mg/L).33
The presence of these above parameters are represented in Table 2. Also for certain toxic metals as mentioned in Table 2, the concentrations are investigated within 0.03–0.1 mg/L indicating permissible range by BIS 201229: 0.1-0.5 mg/L for Mn, 0.001–0.008 mg/L, for Zn (BIS 201229: 5 mg/L) and were comparable to the findings of Karmakar et al. (2024).34 Ground water with NO3- anions beyond the allowed perimeter is commonly persuaded by the anthropogenic involvement of nitrogen as depicted by Xiao et al. (2017).3 It has also been seen that the greater concentration of NO3- ions in ground waters are predominantly distributed in the inhabited areas of the village specifying discharge of domestic sources like sewages, wastes of septic tanks etc. Further the higher TDS in ground waters in the studied area are noticed in agricultural areas indicating a connection with agronomic work like use of manures, insecticides etc. The higher quantity of Zn in ground waters is also correlated with anthropogenic activities and pollutants; F- ions, Mn elements present in samples of groundwater instigate from geogenic concerns.
As the WQI denotes a distinct expression which reviews several parameters and determines the water characteristic, WQIs were measured for all the water samples utilizing the 14 parameters; Ca2+, Na+, K+, Mg2+, HCO3-, SO42-, Cl-, NO3-, F-, pH, TH, TDS, Mn, and Zn for 17 different samples presented in Table 3-11.
Table 3: Computed water quality values for samples 1 and 2.
Parameters in mg/L | Wi | Qi | WQI | Wi | Qi | WQI |
Sample No. 1 | Sample No. 2 | |||||
Ca2+ | 0.00117 | 175.333 | 69.2968 | 0.00117 | 179.733 | 115.48752 |
Na+ | 0.00044 | 60.5 | 0.00044 | 28.1 | ||
K+ | 0.00175 | 22.2 | 0.00175 | 18.6 | ||
Mg2+ | 0.00292 | 180.667 | 0.00292 | 45 | ||
HCO3- | 0.00044 | 42.1 | 0.00044 | 45.75 | ||
SO42- | 0.00044 | 37.15 | 0.00044 | 43.6 | ||
Cl- | 0.00035 | 14.72 | 0.00035 | 14.12 | ||
NO3- | 0.00194 | 0.2 | 0.00194 | 5.33333 | ||
F- | 0.08748 | 230 | 0.08748 | 210 | ||
pH* | 0.01029 | 84.7059 | 0.01029 | 87.0588 | ||
TH | 0.00029 | 22.3333 | 0.00029 | 58 | ||
TDS | 0.00017 | 29.4 | 0.00017 | 31.6 | ||
Mn | 0.87482 | 40 | 0.87482 | 80 | ||
Zn | 0.0175 | 0.06 | 0.0175 | 0.06 | ||
Table 4: Computed water quality values for samples 3 and 4
Parameters in mg/L | Wi | Qi | WQI | Wi | Qi | WQI |
Sample No. 3 |
| Sample No. 4 | ||||
Ca2+ | 0.00117 | 201.467 | 93.6001 | 0.00117 | 105.867 | 71.19391 |
Na+ | 0.00044 | 32.1 | 0.00044 | 6.4 |
| |
K+ | 0.00175 | 16.4 | 0.00175 | 16.6 | ||
Mg2+ | 0.00292 | 142 | 0.00292 | 70.6667 | ||
HCO3- | 0.00044 | 49.55 | 0.00044 | 87.6 | ||
SO42- | 0.00044 | 42.15 | 0.00044 | 36.05 | ||
Cl- | 0.00035 | 29.6 | 0.00035 | 21.64 | ||
NO3- | 0.00194 | 4.22222 | 0.00194 | 2 | ||
F- | 0.08748 | 380 | 0.08748 | 180 | ||
pH* | 0.01029 | 88.2353 | 0.01029 | 85.8824 | ||
TH | 0.00029 | 61.6667 | 0.00029 | 55 | ||
TDS | 0.00017 | 49 | 0.00017 | 61.6 | ||
Mn | 0.87482 | 30 | 0.87482 | 40 | ||
Zn | 0.0175 | 0.1 | 0.0175 | 0.02 |
| |
Table 5: Computed water quality values for samples 5 and 6
Parameters in mg/L | Wi | Qi | WQI | Wi | Qi | WQI |
Sample No. 5 |
| Sample No. 6 | ||||
Ca2+ | 0.00117 | 137.867 | 109.653 | 0.00117 | 130.8 | 73.5082 |
Na+ | 0.00044 | 1.45 |
| 0.00044 | 17.85 | |
K+ | 0.00175 | 23.2 |
| 0.00175 | 11 | |
Mg2+ | 0.00292 | 152.667 |
| 0.00292 | 31.3333 | |
HCO3- | 0.00044 | 71.85 |
| 0.00044 | 40.5 | |
SO4-2 | 0.00044 | 39.75 |
| 0.00044 | 29.2 | |
Cl- | 0.00035 | 17.68 |
| 0.00035 | 18.04 | |
NO3- | 0.00194 | 7.55556 |
| 0.00194 | 5.55556 | |
F- | 0.08748 | 140 |
| 0.08748 | 260 | |
pH* | 0.01029 | 87.0588 |
| 0.01029 | 83.5294 | |
TH | 0.00029 | 71.3333 |
| 0.00029 | 68.3333 | |
TDS | 0.00017 | 77.4 |
| 0.00017 | 85.6 | |
Mn | 0.87482 | 80 |
| 0.87482 | 50 | |
Zn | 0.0175 | 0.1 |
| 0.0175 | 0.08 |
|
Table 6: Computed water quality values for samples 7 and 8
Parameters in mg/L | Wi | Qi | WQI | Wi | Qi | WQI |
Sample No. 7 |
| Sample No. 8 | ||||
Ca2+ | 0.00117 | 225.6 | 131.2 | 0.00117 | 78.9333 | 79.77653 |
Na+ | 0.00044 | 43.5 |
| 0.00044 | 22.1 | |
K+ | 0.00175 | 15 |
| 0.00175 | 18.2 | |
Mg2+ | 0.00292 | 121.333 |
| 0.00292 | 16.3333 | |
HCO3- | 0.00044 | 79.7 |
| 0.00044 | 62.55 | |
SO42- | 0.00044 | 34.15 |
| 0.00044 | 14.75 | |
Cl- | 0.00035 | 21.92 |
| 0.00035 | 23.88 | |
NO3- | 0.00194 | 2 |
| 0.00194 | 21.7778 | |
F- | 0.08748 | 410 |
| 0.08748 | 380 | |
pH* | 0.01029 | 88.2353 |
| 0.01029 | 78.8235 | |
TH | 0.00029 | 68.6667 |
| 0.00029 | 31.6667 | |
TDS | 0.00017 | 90.2 |
| 0.00017 | 69.4 | |
Mn | 0.87482 | 70 |
| 0.87482 | 30 | |
Zn | 0.0175 | 0.12 |
| 0.0175 | 0.08 |
|
Table 7: Computed water quality values for samples 9 and 10
Parameters in mg/L | Wi | Qi | WQI | Wi | Qi | WQI |
Sample No. 9 |
| Sample No. 10 | ||||
Ca2+ | 0.00117 | 196.267 | 107.91 | 0.00117 | 113.467 | 138.25542 |
Na+ | 0.00044 | 11.75 |
| 0.00044 | 4.5 |
|
K+ | 0.00175 | 20.4 |
| 0.00175 | 12.8 | |
Mg2+ | 0.00292 | 72.3333 |
| 0.00292 | 101.667 | |
HCO3- | 0.00044 | 48.1 |
| 0.00044 | 42.7 | |
SO42- | 0.00044 | 24.85 |
| 0.00044 | 39.05 | |
Cl- | 0.00035 | 6.16 |
| 0.00035 | 7.8 | |
NO3- | 0.00194 | 3.11111 |
| 0.00194 | 6.88889 | |
F- | 0.08748 | 370 |
| 0.08748 | 260 | |
pH* | 0.01029 | 89.4118 |
| 0.01029 | 68.2353 | |
TH | 0.00029 | 61.6667 |
| 0.00029 | 19.6667 | |
TDS | 0.00017 | 50.8 |
| 0.00017 | 21.6 | |
Mn | 0.87482 | 40 |
| 0.87482 | 40 | |
Zn | 0.0175 | 0.06 |
| 0.0175 | 0.14 |
|
Table 8: Computed water quality values for samples 11 and 12
Parameters in mg/L | Wi | Qi | WQI | Wi | Qi | WQI |
Sample No. 11 |
| Sample No. 12 | ||||
Ca2+ | 0.00117 | 154.4 | 100.632 | 0.00117 | 76 | 70.80273 |
Na+ | 0.00044 | 24.6 |
| 0.00044 | 56.35 |
|
K+ | 0.00175 | 6.2 |
| 0.00175 | 7.2 |
|
Mg2+ | 0.00292 | 129 |
| 0.00292 | 135 |
|
HCO3- | 0.00044 | 60.8 |
| 0.00044 | 62.7 |
|
SO42- | 0.00044 | 19.85 |
| 0.00044 | 22.65 |
|
Cl- | 0.00035 | 2.32 |
| 0.00035 | 10.36 |
|
NO3- | 0.00194 | 23.7778 |
| 0.00194 | 16.6667 |
|
F- | 0.08748 | 190 |
| 0.08748 | 150 |
|
pH* | 0.01029 | 84.7059 |
| 0.01029 | 80 |
|
TH | 0.00029 | 58 |
| 0.00029 | 21.3333 |
|
TDS | 0.00017 | 63.6 |
| 0.00017 | 28.4 |
|
Mn | 0.87482 | 80 |
| 0.87482 | 50 |
|
Zn | 0.0175 | 0.16 |
| 0.0175 | 0.1 |
|
Table 9: Computed water quality values for samples 13 and 14
Parameters in mg/L | Wi | Qi | WQI | Wi | Qi | WQI |
Sample No. 13 |
| Sample No. 14 | ||||
Ca2+ | 0.00117 | 171.333 | 122.373 | 0.00117 | 185.467 | 175.40829 |
Na+ | 0.00044 | 21.25 |
| 0.00044 | 26.35 |
|
K+ | 0.00175 | 9.6 |
| 0.00175 | 4.2 |
|
Mg2+ | 0.00292 | 238.333 |
| 0.00292 | 236.667 |
|
HCO3- | 0.00044 | 93.5 |
| 0.00044 | 89.05 |
|
SO4-2 | 0.00044 | 24.45 |
| 0.00044 | 23.7 |
|
Cl- | 0.00035 | 3.32 |
| 0.00035 | 5.44 |
|
NO3- | 0.00194 | 2.66667 |
| 0.00194 | 0.88889 |
|
F- | 0.08748 | 330 |
| 0.08748 | 460 |
|
pH* | 0.01029 | 89.4118 |
| 0.01029 | 90.5882 |
|
TH | 0.00029 | 66 |
| 0.00029 | 72.3333 |
|
TDS | 0.00017 | 79.6 |
| 0.00017 | 90.4 |
|
Mn | 0.87482 | 60 |
| 0.87482 | 100 |
|
Zn | 0.0175 | 0.16 |
| 0.0175 | 0.12 |
|
Table 10: Computed water quality values for samples 15 and 16
Parameters in mg/L | Wi | Qi | WQI | Wi | Qi | WQI |
Sample No. 15 |
| Sample No. 16 | ||||
Ca2+ | 0.00117 | 205.6 | 130.079 | 0.00117 | 30.6667 | 128.24211 |
Na+ | 0.00044 | 16.9 | 0.00044 | 20 | ||
K+ | 0.00175 | 16.4 | 0.00175 | 14.6 | ||
Mg2+ | 0.00292 | 231.667 | 0.00292 | 199.667 | ||
HCO3- | 0.00044 | 89.8 | 0.00044 | 77.45 | ||
SO42- | 0.00044 | 39.1 | 0.00044 | 32.15 | ||
Cl- | 0.00035 | 3.64 | 0.00035 | 9.92 | ||
NO3- | 0.00194 | 7.11111 | 0.00194 | 19.3333 | ||
F- | 0.08748 | 370 | 0.08748 | 400 | ||
pH* | 0.01029 | 87.0588 | 0.01029 | 75.2941 | ||
TH | 0.00029 | 67 | 0.00029 | 29 | ||
TDS | 0.00017 | 80.2 | 0.00017 | 50.8 | ||
Mn | 0.87482 | 80 | 0.87482 | 60 | ||
Zn | 0.0175 | 0.06 | 0.0175 | 0.06 | ||
Table 11: Computed water quality values for sample 17
Parameters in mg/L | Wi | Qi | WQI |
Sample 17 | |||
Ca2+ | 0.00117 | 116.533 | 80.4288 |
Na+ | 0.00044 | 31.9 | |
K+ | 0.00175 | 20.6 | |
Mg2+ | 0.00292 | 224.667 | |
HCO3- | 0.00044 | 84.15 | |
SO42- | 0.00044 | 26.85 | |
Cl- | 0.00035 | 4.28 | |
NO3- | 0.00194 | 6 | |
F- | 0.08748 | 280 | |
pH* | 0.01029 | 85.8824 | |
TH | 0.00029 | 69.3333 | |
TDS | 0.00017 | 97.4 | |
Mn | 0.87482 | 40 | |
Zn | 0.0175 | 0.04 | |
*no unit
The WQI of the samples were observed to be in the range of 69.29682 to 175.40829 was found to be comparable to those obtained in the study done by Batabyal et al. (2015)30 and was compared with the water grade categorization for intake purposes depending on the values of WQI as mentioned by Boateng et al. (2016)22 who categorized the quality of water into five categories as excellent, good, poor, very poor, and unsuitable for human consumption subject to WQI as represented in Table 12.
Table 12: Categorization of potable water hinged on the WQI values (Boateng et al. 2016)22
Range | Type of water |
<50 | Excellent |
50-100 | Good |
100.1-200 | Poor |
200.1-300 | Very poor |
> 300 | Unsuitable |
Calculated values of WQI signifies that 41.2% of the investigated water samples are of good and 58.8% of the water samples defines poor quality water for intake purposes. The WQI values represented in Table 3 indicates that the Sample 1 is the best in quality among all the 17 water samples and the worst water quality is observed for sample 14. Figure 4 might be useful to compare the overall excellence of the water concerning different sources and maintain proper use of the water.
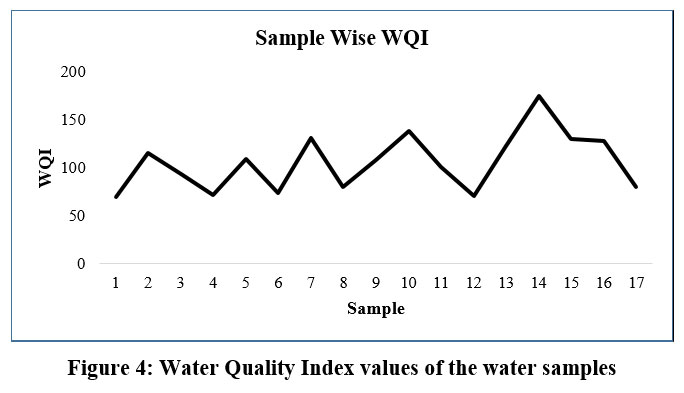 | Figure 4: Water Quality Index values of the water samples
|
Health implications
The higher amount of NO3-, F-, Zn, Mn in the ground water beyond the accepted border may cause severe health hazards to human health. Non carcinogenic threats to human robustness should be taken into consideration if subjected to large extent of NO3-, F-, Zn and Mn in everyday living mentioned by USEPA, 2008.35 There is a greater connotation between contamination and health difficulties. Health hazards related to uncleaned water include distinctive ailments such as lung disease, dysentery, neural disorder, cancer and cardiac vascular disease.36 Polluted water can have the capability to destroy the production of crops. It may also infect food and vegetables which is harmful for aquatic living organisms as well as human life.37 Pollutants present in water disrupt the food chain. Heavy metals for example Fe may cause difficulties in respiratory system of fishes which if eaten by human beings may lead to several health issues. Metal polluted water results in different health problems like liver cirrhosis, renal failure, hair loss, neural syndrome etc.38
F- in water is crucial to strengthen of the bones and to protect against dental carries. Concentration of fluoride ions lower than 0.5 mg/l instigates tooth decay and weakening of tooth but greater concentration of more than 0.5 mg/l for about 5-6 years may result in hostile consequences on human health bringing about fluorosis disease.
Several toxic rudiments may be assimilated in the food web from the polluted water bodies. Thus, aquatic animals are also getting affected directly due to the contaminated ground waters.39 Pollution of ground waters also affects the animals of surrounding areas of the polluted ground water sources. Drinking water excellence must meet specific guidelines of organizations such as WHO, IS etc. If drinking water quality is appropriately controlled and within desirable limits, it may not cause waterborne diseases in humans and have no adverse effect on the environment.40-41 Residents of the studied village reported that ingestion of aquatic animals including fishes of the nearby wet lands, lakes, rivers creates frequent health difficulties. During the study it was reported that different diseases like nausea, vomiting, indigestion, diarrhea, fever, cancer, dermal problems, vertigo, itching, burning sensation, liver problems etc. were found to increase to a greater extent in comparison to previous years. These problems were suffered by the local people to a higher degree who use the ground water as drinking water directly without purification, instead those dwellers of the villagers do not use untreated water from the ground water sources are more or less not affected to some extent. It was noticed that among the inhabitants those were interviewed for conducting the present study, 12 percent had indigestion problem, 7 percent were suffering from vomiting problems, 2 percent had fever, 7 percent were having severe diarrhea, nausea like health issues were found in 4 percent cases, vertigo type difficulties were shown in 1 percent cases, 9 percent people were going through itching and burning sensation, liver related difficulties were faced by 21 percent people, dermal problems were found in case of 18 percent people. The disease cancer was found in four inhabitants of the studied area. According to the local dwellers the health issues were found to increase day by day irrespective of genders. Although a number of people also reported that after using treated water for drinking purpose and other house hold works, their health problems were under control to some extent. The health issues were seen more problematic for the children under 14 years and pregnant women. Therefore, the people are now may be aware of the water pollution and associated diseases. They are trying to cope up with the situation for the betterment of livelihood and to protect the nearby water sources from being polluted. It is imperative for every villager to develop a profound knowledge of water pollution and take action to inhibit contagion. The study's test results can provide valuable insights into water quality basics, but it is important to note that the presence of chemical and biological components determines the extent of water pollution and how it leads to diseases. Therefore, it is crucial to identify the responsible water component for illnesses and apply newer technologies and analytical methods to quantify various compounds in water. By raising awareness and taking necessary precautions, a safe and healthy drinking water source for the community can be ensured.
Despite facing certain challenges during the study, such as the absence of a laboratory in close proximity to the water sources and difficulties in transporting the samples over long distances without compromising their quality, the findings provide valuable insights and highlight the importance of further research in this field. Due to the fact that a majority of the villagers in the study area are engaged in agriculture, conducting the study required a significant amount of time and effort as they were not always available for interviews. However, it was not possible to accurately educate everyone about water pollution as not all the local people are concerned. Additionally, it is not always apparent that everyone is fully aware of their physical ailments and actively seeking treatment.
Conclusion
Water contamination is a universal concern and whole community is fronting most awful outcomes of diseased water. Major causes of water effluence are to be identified so as to protect ground water and prevent pollution in terms of several health issues of human beings. WQI values specify about the water excellence in the studied area designating good to poor class of water. There is a need of consciousness among the people of the area and urgent requirement to procure the apposite measures to defend the overall water quality in the study area. Various bacterial, viral as well as parasitic diseases are increasing through contaminated water and causing normal to acute problems to human health. There should be appropriate waste discarding method and discharge of waste matters should be processed prior to dumping in the ground or entering in to water bodies. In every sectors of people educational in addition to awareness programs may be organized to aware the inhabitants about the paucity of the pollution specifically raising awful situation due to contaminated water. Cost effective and reasonably priced water purifiers may be supplied to the dwellers from the gram panchayat or better to plant for a water purifier for safe drinking water and cooking purposes in the village by the government agencies. In this regard, local panchayats can play a pivotal role in monitoring the purity of drinking water and ensuring that every household in the village has access to purified water. It is imperative for villagers to prioritize the health of their drinking water and for the authorities responsible for managing the village to adopt appropriate and feasible measures to guarantee that every family of the studied village can avail of clean potable water and prevent common physical ailments to some extent.
Acknowledgements
The author is thankful to the Panchayat members, other administrative bodies and villagers of Aiho village of Malda district, West Bengal and grateful to the Siliguri college authority to complete this present study.
Funding Sources
No funding source was availed in conducting the study.
Conflict of Interest
There is no conflict of interest.
Author’s Contribution
As the corresponding and principal author of this study, all aspects of the research and manuscript preparation were completed solely by the author herself.
Data Availability Statement
The research is based on primary data and all primary data obtained from laboratory experiments and field-based interviews were included in this study. Additionally, the data used for comparison can be found in the references.
Ethics Approval Statement
The privacy of the participants in this study was respected as their names were not published upon their request. Prior approval from the Gram Pradhan was obtained to carry out the study, and the local Panchayat of Aiho village in the Malda district of West Bengal, India ultimately authorized the present study.
References
- Snousy MG., Morsi MS., Elewa AMT., Ahmed SAEF., El-Sayed E. Groundwater Vulnerability and Trace Element Dispersion in the Quaternary Aquifers Along Middle Upper Egypt. Environmental Monitoring and Assessment. 2020;192(3):1-36. DOI: 10.1007/s10661-020-8109-5.
CrossRef - Gu X., Xiao Y., Yin S., Hao Q., Liu H., Hao Z., Meng G., Pei Q., Yan H. Hydrogeochemical Characterization and Quality Assessment of Groundwater in a Long-Term Reclaimed Water Irrigation Area, North China Plain. Water. 2018;10(9)1209:1-16. doi:10.3390/w10091209.
CrossRef - Xiao Y., Gu X., Yin S., Pan X., Shao J., Cui Y. Investigation of Geochemical Characteristics and Controlling Processes of Groundwater in a Typical Long-Term Reclaimed Water Use Area. Water. 2017;9(10)800:1-16. DOI:10.3390/w9100800.
CrossRef - Subba Rao N., Ravindra B., Wu J. Geochemical and Health Risk Evaluation of Fluoride Rich Groundwater in Sattenapalle Region, Guntur district, Andhra Pradesh, India. Human and Ecological Risk Assessment: An International Journal. 2020;26(9):2316-2348. DOI: 10. 1080/10807039.2020.1741338.
CrossRef - Critelli T., Vespasiano G., Apollaro C., Muto F., Marini L., De Rosa R. Hydrogeochemical Study of an Ophiolitic Aquifer: A Case Study of Lago (Southern Italy, Calabria). Environmental Earth Sciences. 2015;74:533–543. DOI 10.1007/s12665-015-4061-z.
CrossRef - Wang Z., Guo H., Xiu W., Wang J., Shen M. High Arsenic Groundwater in the Guide Basin, Northwestern China: Distribution and Genesis Mechanisms. Science of The Total Environment. 2018;640–641:194-206. DOI 10.1016/j.scitotenv.2018.05.255.
CrossRef - Huang G., Liu C., Li L., Zhang F., Chen Z. Spatial Distribution and Origin of Shallow Groundwater Iodide in a Rapidly Urbanized delta: A Case Study of the Pearl River Delta. Journal of Hydrology. 2020;585. DOI https://doi.org/10.1016/j.jhydrol.2020.124860.
CrossRef - Renau-Pruñonosa A., García-Menéndez O., Ibáñez M., Vázquez-Suñé E., Boix C., Ballesteros BB., Hernández García M., Morell I., Hernández F. Identification of Aquifer Recharge Sources as the Origin of Emerging Contaminants in Intensive Agricultural Areas. La Plana de Castellón, Spain. Water. 2020;12(3)731:1-22. DOI 10.3390/w12030731.
CrossRef - Ahmadi S., Jahanshahi R., Moeini V., Mali S. Assessment of Hydrochemistry and Heavy Metals Pollution in the Groundwater of Ardestan Mineral Exploration Area, Iran. Environmental Earth Sciences. 2018;77(5): Article number: 212. DOI : 10.1007/s12665-018-7393-7.
- Juneja T., Chauhdary A. Assessment of Water Quality and its Effect on the Health of Residents of Jhunjhunu district, Rajasthan: A cross Sectional Study. Journal of public health and epidemiology. 2013;5(4):186-191. DOI: 10.5897/JPHE12.096.
- Khan MA., Ghouri AM. Environmental Pollution: Its Effects on Life and its Remedies. Journal of Arts, Science & Commerce. 2011;2(2):276-285.
- Okeke CO., Igboanua AH. Characteristics and Quality Assessment of Surface Water and Groundwater Resources of Akwa Town, Southeast, Nigeria. Water Resources Journal. 2003;14: 71-77.
- Baig JA., Kazi, TG., Arain MB., Afridi HI., Kandhro GA., Sarfraz RA., Jamali MK., Shah AQ. Evaluation of Arsenic and Other Physico-Chemical Parameters of Surface and Ground Water of Jamshoro, Pakistan. Journal of Hazardous Materials. 2009;166:662–669. DOI: 10.1016/j.jhazmat.2008.11.069.
CrossRef - Halder JN., Islam MN. Water Pollution and its Impact on the Human Health. Journal of environment and human. 2015;2(1):36-46. DOI 10.15764/EH.2015.01005.
CrossRef - Ahmad SM., Yusafzai F., Bari T. Assessment of Heavy Metals in Surface Water of River Panjkora Dir Lower, KPK Pakistan. Journal of Biodiversity and Environmental Sciences. 2014:5(3):144-152.f
- Jabeen S., Mehmood Q., Tariq S., Nawab B., Elahi N. Health Impact Caused by Poor Water and Sanitation in District Abbottabad. Journal of Ayub Medical College Abbottabad. 2011;23(1)47-50.
- Currie J., Joshua GZ., Katherine M., Neidell M., Schlenker W. Something in the water: contaminated drinking water and infant health. Canadian Journal of Economics. 2013;46(3):791-810. DOI 10.1111/caje.12039.
CrossRef - Sahu P., Sikdar PK. Hydrochemical Framework of the Aquifer in and around East Kolkata Wetlands, West Bengal, India. Environmental Geology. 2008;55:823–835. DOI:10.1007/s00254-007-1034-x.
CrossRef - Singh DF. Studies on the Water Quality Index of Some Major Rivers of Pune, Maharashtra. Proceedings of the Academy of Environmental Biology. 1992;1(1):61–66.
- Subba RN. Studies on Water Quality Index in Hard Rock Terrain of Guntur District, Andhra Pradesh, India. In: National seminar on hydrology of Precambrian terrains and hard rock areas. 1997:129–134.
- Tiwari TN., Mishra MA. A Preliminary Assignment of Water Quality Index of Major Indian rivers. Indian Journal of Environmental Protection. 1985;5:276–279.
- Boateng TK., Opoku F., Acquaah SO., Akoto O. Groundwater Quality Assessment Using Statistical Approach and Water Quality Index in EjisuJuaben Municipality, Ghana. Environmental Earth Sciences. 2016;75:489. DOI:10.1007/s12665-015-5105-0.
CrossRef - APHA (American Public Health Association) Standard Method for Examination of Water and Wastewater, NW, DC 20036, 1994.
- Brown RM., McClelland NI., Deininger RA., Tozer RG. A Water Quality Index-Do We Dare. Water sewage works. 1970;117(10):339-343.
- Cude CG. Oregon Water Quality Index a Tool for Evaluating Water Quality Management Effectiveness. Journal of the American Water Resources Association. 2001;37(1):125-137. DOI 10.1111/j.1752-1688.2001.tb05480.x.
CrossRef - FAD 25(2047) C, 2009 BIS 10500. Drinking Water Quality Standards Specification (IS 10500), Bureau of Indian Standards, Manak Bhawan, 9 Bahadur Shah Zafar Marg, New Delhi-110002. 2009: second revision.
- Das A., Das SS., Chowdhury NR., Joardar M., Ghosh B., Roychowdhury T. Quality and Health Risk Evaluation for Groundwater in Nadia district, West Bengal: An approach on its Suitability for Drinking and Domestic Purpose. Groundwater for Sustainable Development. 2020;10:100351. DOI:10.1016/j.gsd.2020.100351.
CrossRef - BIS (Bureau of Indian Standards) 10500, Indian standard drinking waterspecification, FAD 25(2047) C, 2009 BIS 10500. Drinking water quality standards specification (IS 10500), Bureau of Indian Standards, Manak Bhawan, 9 Bahadur Shah Zafar Marg, New Delhi-110002. 1991: 1-8, First revision.
- Indian Standard DRINKING WATER-SPECIFICATION BIS 2012, FAD 25(2047) C, 2009 BIS 10500. Drinking water quality standards specification (IS 10500), Bureau of Indian Standards, Manak Bhawan, 9 Bahadur Shah Zafar Marg, New Delhi-110002. 2012: 1-13, Second Revision.\
- Batabyal AK., Chakraborty S. Hydrogeochemistry and Water Quality Index in the Assessment of Groundwater Quality for Drinking Uses. Water Environment Research. 2015; 606-617. DOI: 10.2175/106143015X14212658613956.
CrossRef - Boyd CE. Water Quality: An Introduction. The Netherlands: Kluwer Academic Publishers Group. ISBN 07923-78539, 1999.
- Chatterjee PR., Raziuddin M. Studies on the Water Quality of a Water Body at Asansol Town, West Bengal. Nature Environment and Pollution Technology. 2007;6(2):289-292.
- USGS. Classification of Natural Ponds and Lakes; U.S. Department of the Interior, U.S. Geological Survey: Washington, DC, USA, 2000.
- Karmakar D., Sarkar B., Islam N. Drinking Water Quality in Cooch Behar Municipality, West Bengal, India: Assessment Using WQI and Public Perception. Journal of Environmental Quality Management. 2024;1-17. DOI: 10.1002/tqem.22226.
CrossRef - USEPA. User’s Guide: Human Health Risk Assessment; United States Environmental Protection Agency: Washington, DC, USA, 2008.
- Ullah S., Javed MW., Shafique M., Khan SF. An Integrated Approach for Quality Assessment of Drinking Water Using GIS: A Case Study of Lower Dir. Journal of Himalayan Earth Sciences. 2014;47 (2):163-174.
- Haseena M., Malik MF., Javed A., Arshad S., Asif N., Zulfiqar S., Hanif J. Water Pollution and Human Health. Journal of Environmental Risk Assessment and Remediation. 2017;1 (3):16-19.
CrossRef - Singh SS., Kumari M., Nandan M., Kumar R., Agrawal P. Heavy Metals Contamination in Water and their Hazardous Effect on Human Health-A Review. International Journal of Current Microbiology and Applied Sciences. 2016;5 (10):759-766
CrossRef - Malik DS., Sharma AK., Sharma AK., Thakur R., Sharma M. A Review on Impact of Water Pollution on Freshwater Fish Species and Their Aquatic Environment. Advances in Environmental Pollution Management: Wastewater Impacts and Treatment Technologies. 2020; Edition: 1, Chapter: 2, 10-28. DOI:10.26832/aesa-2020-aepm-02.
CrossRef - World Health Organization (WHO). Guidelines for drinking water quality, recommendations. Geneva, Switzerland. 1984;130.
- Drinking water-speci?cation, Bureau of Indian Standards (Second Revision of IS 10500). www.mdws.gov.in/sites/default/?les/Drinking_water_quality_standards.


