Long-term Assessment of Precipitation Behaviour in Bihar (1901-2021): Patterns, Trends and Observed Variability
Manu Raj Sharma
*
 and Sukeshi Priya
1
University Department of Geography,
Advanced Research Centre, LN Mithila University,
Darbhanga,
Bihar
India
http://dx.doi.org/10.12944/CWE.18.2.19
Copy the following to cite this article:
Sharma M. R, Priya S. Long-term Assessment of Precipitation Behaviour in Bihar (1901-2021): Patterns, Trends and Observed Variability. Curr World Environ 2023;18(2). DOI:http://dx.doi.org/10.12944/CWE.18.2.19
Copy the following to cite this URL:
Sharma M. R, Priya S. Long-term Assessment of Precipitation Behaviour in Bihar (1901-2021): Patterns, Trends and Observed Variability. Curr World Environ 2023;18(2).
Download article (pdf)
Citation Manager
Publish History

Introduction
Rainfall is an important hydrometeorological variable that governs the hydrological balance between land-ocean-atmosphere system.1 Long-term changes in total annual rainfall amount directly affects the availability of surface water, groundwater potential, moisture retention capacity of soil. It also indirectly affects the important sector activities like agriculture and domestic-urban uses. Many studies identified noticeable changes in trends, magnitude and direction of change of precipitation across the world. Under scenarios of projected global warming, visible changes in precipitation patterns and trends have been reported from almost every part of the world.2 Several studies found an increase of 2% in terrestrial global precipitation3 and varying long and short-term change in the trends in global precipitation456. While few other studies suggested an overall increase in the precipitation area affected by more intense daily rainfall7 and assessed changes in precipitation on global and regional scales.8 Anthropogenic influences have also shown to cause both an increasing and decreasing effect on precipitation in different parts of the world. 9 This has been confirmed by some recent computer-based models’ projections that reports climate change in the 21st century will result in an increase of rainfall extreme events.10 11 Some recent studies also supplemented a conceptual basis for such changes in precipitation12 13 and frequency of extreme events. 14 15 These variations are reflected in several regions with both increasing and decreasing trends in precipitation that are at increasing risk of both heavy flooding and long spells of drought. 16 An international body IPCC in its Sixth Assessment Report (AR6) reported higher latitudes to be rainier, while subtropical terrestrial regions to be relatively dry.17 It shows that almost every region will be impacted with huge human and economic costs of precipitation changes 18 19. The report establishes that consequences of this projected change will be irreversible over time, and will result in noticeable changes in glacial ice-streamflow balance, rising seas levels, and ocean stratification. And such impacts will continue to escalate and compound as emissions increase. 20 21 IPCC AR616 highlighted how indirect drivers of climate change such as socio-economic conditions of water stress will impact intensively in several parts of Asia especially India. Long term trends assessments undertaken for the Indian summer monsoon from 1951 to 2005 detected an increase in extreme rainfall events while low rainfall events declined. 22 These studies have also investigated the impact of rainfall variability on annual and seasonal rainfall trends, intensity, and count of rainy days in different regions of India.2 Analysis of rainfall data in different regions of Asia revealed that total annual rainfall is declining particularly in central India. 16 Understanding of behavioural patterns of rainfall was important as it revealed that frequency of heavy rainfall events is increasing while that of moderate rainfall events is decreasing.23 24 Over the past few decades, certain areas of northwest India have experienced a rise in the frequency of intense rainfall events.25 Similar findings were documented by “The Summary for Policymakers of the Working Group I contribution (AR6)” 17, titled Climate Change 2021 that an increase in rainfall will be catastrophic over southern parts of India; over the southern and west coast region, and rainfall is expected to increase by around 20 per cent, in comparison to the period 1850 AD -1900 AD. As per projection, if the planet warms by 4°C, India and less developed neighbouring countries can witness more than 40 per cent increase in annual rainfall. 26 As a result of this sudden change, it becomes more important to study the rainfall trends specially in a region where economy is dependent on rainfed agriculture. 27
This study focuses on Bihar, which is identified as one of the under-developed states of east India and poorest on National Multidimensional Poverty Index28, that has high vulnerability and least resilience capacity in wake of climate change. 29 To visualize the impact of regional climate change, trend analysis of annual rainfall at district level has been undertaken. Changes in annual rainfall trends, magnitude and spatial patterns are examined across Bihar for sufficient long periods (1901-2021). As the development of Bihar is solely dependent on the efficient management of water resources it is necessary to understand the behaviour of annual receipt of precipitation across state. 30 31 Also, these changes are important to understand the future implications for rainfed based agriculture systems in Bihar as the emerging pattern of witnessed changes will affect crop evaporation, surface runoff, total soil water storage, crop water demand, crop growth season, and annual yield.
Study Area
The region under examination, Bihar, is an eastern Indian state situated along latitudes ranging from 24.28° N to 27.52° N and longitudes spanning from 83.32° E to 88.30° E. On the basis of administrative boundaries, it has been divided into 38 districts. On an average Bihar covering an approximate land area of 94.16 thousand square kilometres. To its north, Bihar shares an international border with Nepal, while its western side is bounded by Uttar Pradesh. In the south, it shares state boundaries with Jharkhand, and to the east, it is bordered by West Bengal. Here during summer season temperature soars to as high as 43 °C while it dips to below 5 °C during winters. With a mean annual rainfall of about 1200 mm, it receives moderate to heavy rainfall during monsoon (about 84%) and winters. The topography of Bihar is dominated by fertile alluvial plain brought in Gangetic valley. Hydrologically Bihar is divided into almost equal halves by river Ganga into North Ganga plains and South Ganga plains. Besides Ganga, it is drained by other big rivers like Gandak, Ghaghara, Baghmati, Kamla-Balan, Kosi, Mahananda, Son and Punpun etc. The north and south Ganga plains consists of a thick alluvium, mainly loam that is rejuvenated annually through continuous deposition of fine textured clay, loosely bound silt, and porous sand. The soil lacks crucial elements such as phosphoric acid (H3PO4), nitrogen (N2) and organic matter (humus), but it contains ample amounts of potash (Kal (SO4)2 ) and lime (CaO). In the far south, the southern plateau region merges with Vindhyan and Dharwar lithology and is composed of hard rocks like granite, gneiss, and schist. The economy is primarily rural and based on rainfed agriculture and allied sectors. Despite being located in a region with high rainfall, Bihar experiences significant rainfall variability, leading to recurring heavy rainfall periods and intermittent dry spells during the rainy season, which is a cause for concern.
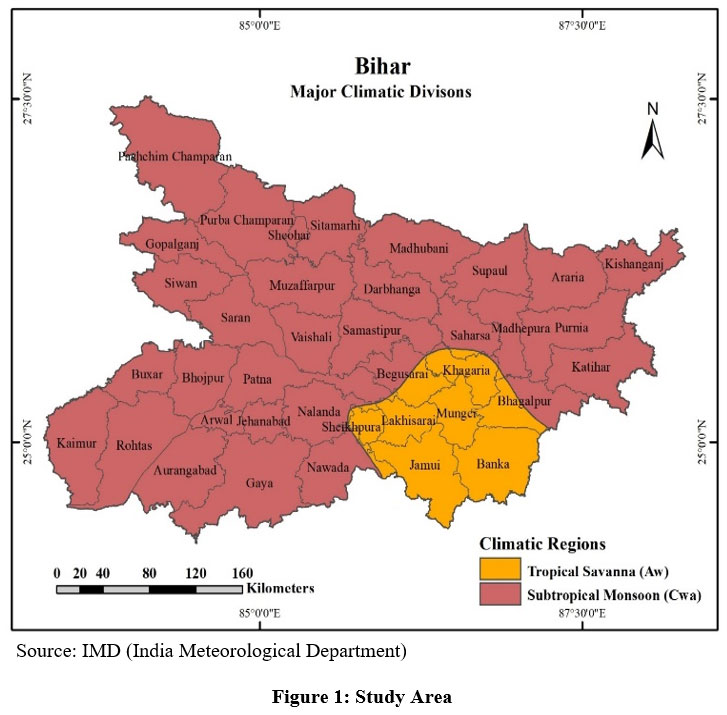 | Figure 1: Study Area.
|
Source: IMD (India Meteorological Department)
Based on the historical data of rainfall and temperature in the study area, IMD has used Koppen’s classification scheme to identify two main climatic regions (i) Subtropical monsoon (Cwa) experiencing mild and dry winter with hot summer (ii) Tropical Savanna (Aw) with less annual rainfall, hot summer and dry winters (Figure 1). Bihar has been selected as one large spatial unit for study because of its strong physiographic, monsoonal and hydrological links. Large rainfall anomalies in the study region will threaten agriculture-based economy, groundwater potential and natural aquatic ecosystems (chaurs and mauns).
Objectives
The study area from a climatic perspective forms a large spatial division but with variations. The high rainfall variability and rainfall anomalies over long period of several climatic cycles have resulted into characteristic spatial patterns of annual rainfall. This paper aims to address the direction and magnitude of trend and spatial patterns of rainfall with the following objectives:
To study patterns and trends of annual precipitation in Bihar.
To analyse annual rainfall variability in Bihar.
Data sources and Methodology
The mean monthly precipitation data were acquired from the IMD for the period 1901–2021. Annual precipitation series of each district was computed from mean monthly data. Missing values in the rainfall database were identified and replaced with average values of previous years. The Mann–Kendall test i.e., MK test 32 (non-parametric test) and Sen’s slope estimator33 34 tests were adopted to detect trends in annual precipitation for all the districts in Bihar.35 MK test is capable of identifying trend from rainfall time-series without any further simulation. At a confidence level of 95%, the outcomes of the MK test were classified into four categories: significant positive trend, significant negative trend, non-significant positive trend and non-significant negative trend. The MK test assesses whether there is no trend compared to the presence of a trend that is either increasing or decreasing.
H0: No trend exists in data series.
Ha: Monotonic trend exists in data series.
Presuming Xi, Xj are the two subsets of data series where i= 1, 2, 3, 4, …. N-1 and j=i+1, i+2, i+3, i+4, …………. N. The representation of the Mann-Kendall ‘S’ statistic is as follows:
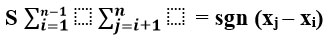
Where:
‘n’ represents number of data points,
‘xj’and ‘xi’ represents data values in the times series I and j (j>i) and
sgn (xj - xi ) = +1 if (xj - xi ) > 0; 0 if (xj - xi ) = 0 and -1 if (xj - xi ) < 0.
When the size of the test sample, denoted as n, is greater than 10, the standard normal test statistic (Zs) is determined by employing the following formula:
1 | Zs = (S-1)/?(var (S) | if S is greater than 0 |
| 2 | Zs = 0 | if S I equal to 0 |
| 3 | Zs = (S+1)/?(var (S) | if S is less than 0 |
The positive value of Zs indicates increasing trend while all negative values of Zs represent decreasing trends. The null hypothesis (at significance level of 5%) is rejected if ?Zs? is greater than 1.96. Theil and Sen’s slope estimator test was utilized to determine the degree of a trend (Sen 1968 34; Theil 1950 33). Statistical methods of variability description like coefficient of variation (CV), standard deviation (SD) and range were used as to analyse nature and patterns of rainfall variability. These indicators are capable of describing variability of rainfall from long term mean and help planners to frame mitigation policies.
Result and Discussions
Spatial Patterns of Annual Rainfall
For the present study all analysis were done at district level. For easy understanding of annual precipitation behaviour study area was divided into two climatic divisions: (a) Tropical Savanna (Aw) and (b) Subtropical Monsoon climate (Cwa). Mean monthly rainfall data were used for preparation of annual rainfall series for all districts of Bihar for the duration 1901–2021. Rigorous statistical analysis tests were applied to characterize the implications of trend and variability of annual rainfall of the study area.
Annual precipitation data describes the total annual receipt of water received through various processes and forms of precipitation. It provides information about hydrological balance between land-ocean surface and atmosphere. Bihar experiences sub-tropical climate with high rainfall fairly distributed across state. Precipitation decreases as one traverses from northeast to southwest part of the state. Annual precipitation ranges from an annual minimum of 925 mm in the south eastern part (Lakhisarai) to maximum of 2162 mm in eastern part (Kishanganj) of Bihar (Table 1). Northern part of the state comprising of districts Kishanganj, Araria, Madhepura, Purnea, Supaul, Saharsa, Madhubani, Sitamarhi, Sheohar, Paschim Champaran and Purba Champaran receives highest precipitation (above 1400 mm) owing to its proximity to lower Himalayas zone and direction of arrival of monsoon winds. Southern side of river Ganga comprising of districts Buxar, Bhojpur, Patna, Arwal, Jehanabad, Nalanda, Sheikhpura and Lakhiasarai receives scanty rainfall (below 1020 mm). Rainfall variations are comparatively higher in Subtropical monsoon climate (Cwa) as compared to Tropical savanna climate (Aw). A clear north-south distinction between levels of different annual rainfall regimes of Bihar can be clearly observed where rainfall decrease from northern terai region towards south Ganga plains and again increases towards southern plateau (Figure 2).
Table 1: Annual Rainfall Characteristics: 1901-2021
District | Mean Rainfall (mm) | Max. Rainfall (mm) | Min. Rainfall (mm) | Rainfall Range (mm) | Standard Deviation (in mm) | Coefficient of Variation (in %) |
Tropical Savanna Climate (Aw) | ||||||
| Banka | 1124 | 1720 | 528 | 1192 | 252 | 57.4 |
| Begusarai | 1135 | 1788 | 270 | 1518 | 287 | 60.26 |
| Bhagalpur | 1181 | 2114 | 472 | 1642 | 271 | 59.57 |
| Jamui | 1135 | 1764 | 385 | 1379 | 256 | 56.43 |
| Khagaria | 1153 | 1934 | 155 | 1779 | 308 | 62.39 |
| Lakhisarai | 925 | 1620 | 365 | 1255 | 285 | 62.85 |
| Munger | 1167 | 1885 | 532 | 1353 | 255 | 57.91 |
| Sheikhpura | 1016 | 1580 | 313 | 1267 | 263 | 63.92 |
Subtropical Monsoon Climate (Cwa) | ||||||
| Araria | 1632 | 2423 | 727 | 1696 | 880 | 53.92 |
| Arwal | 969 | 1881 | 343 | 1538 | 637 | 65.76 |
| Aurangabad | 1083 | 1810 | 1150 | 660 | 616 | 56.92 |
| Bhabua | 1039 | 1942 | 349 | 1592 | 639 | 61.5 |
| Bhojpur | 1007 | 1718 | 85 | 1633 | 607 | 60.28 |
| Buxar | 967 | 1561 | 231 | 1330 | 641 | 66.29 |
| Darbhanga | 1275 | 2007 | 429 | 1579 | 703 | 61.36 |
| Gaya | 1464 | 2343 | 935 | 1409 | 613 | 58.25 |
| Gopalganj | 1145 | 1893 | 446 | 1447 | 661 | 58.89 |
| Jehanabad | 1053 | 1788 | 392 | 1396 | 653 | 65.7 |
| Katihar | 1123 | 1995 | 534 | 1461 | 773 | 58.11 |
| Kishanganj | 995 | 1682 | 271 | 1411 | 1123 | 51.94 |
| Madhepura | 1331 | 2381 | 553 | 1828 | 754 | 58.25 |
| Madhubani | 2162 | 3125 | 792 | 2333 | 724 | 59.61 |
| Muzaffarpur | 1295 | 2074 | 559 | 1516 | 713 | 61.68 |
| Nalanda | 1215 | 1982 | 458 | 1525 | 579 | 58.82 |
| Nawada | 1157 | 2232 | 420 | 1812 | 590 | 58.38 |
| Patna | 984 | 1657 | 426 | 1230 | 575 | 57.96 |
| Paschim Champaran | 1011 | 1625 | 457 | 1168 | 783 | 53.51 |
| Purba Champaran | 993 | 1631 | 395 | 1236 | 705 | 55.33 |
| Purnea | 1537 | 2504 | 628 | 1875 | 865 | 56.26 |
| Rohtas | 1065 | 1752 | 382 | 1370 | 621 | 58.32 |
| Saharsa | 1317 | 2442 | 386 | 2056 | 773 | 58.7 |
| Samastipur | 1177 | 1921 | 528 | 1393 | 727 | 61.78 |
| Saran | 1069 | 1737 | 304 | 1433 | 605 | 56.64 |
| Sheohar | 1270 | 2470 | 432 | 2038 | 903 | 71.13 |
| Sitamarhi | 1222 | 1938 | 9 | 1929 | 755 | 61.81 |
| Siwan | 1074 | 1909 | 337 | 1572 | 688 | 64.1 |
| Supaul | 1319 | 2353 | 111 | 2241 | 836 | 63.43 |
| Vaishali | 1023 | 1701 | 16 | 1686 | 615 | 60.12 |
Source: Computed by the authors
 | Figure 2: Spatial Patterns of Annual Rainfall (1901-2021).
|
Source: Prepared by the authors.
Trends of Annual Rainfall
Trend analysis of meteorological parameters is very important as it help decision-makers and researchers to quantify the increase or decrease of annual rainfall. Annual rainfall received on surface and sub-surface of the region is an important determinant in the development of various activities in the region. The trend and magnitude of the change of annual rainfall for the entire state of Bihar for period 1901-2021 are represented in Table 2. Z-scores with values above zero indicate increasing trends, while those below zero indicate decreasing trends. Districts exhibiting significant trends were shaded with highlighted text for easy reference.
Table 2: Annual Rainfall Trends: 1901-2021.
S. No | District | Annual Rainfall | ||
| Qmed (mm/year) | Trend | ||
Tropical Savanna Climate (Aw) | ||||
1 | Banka | -1.50 | -1.07 | Non-significant Decrease |
2 | Begusarai | -2.04 | -1.71 | Significant Decrease |
3 | Jamui | -2.52 | -1.71 | Significant Decrease |
4 | Lakhisarai | 0.00 | 1.97 | Non-significant Increase |
5 | Khagaria | -2.57 | -2.36 | Significant Decrease |
6 | Munger | -2.39 | -1.74 | Significant Decrease |
7 | Sheikhpura | -3.08 | -2.32 | Significant Decrease |
8 | Araria | -0.43 | -0.45 | Non-significant Decrease |
Subtropical Monsoon Climate (Cwa) | ||||
9 | Arwal | -3.92 | -3.51 | Significant Decrease |
10 | Aurangabad | -4.53 | -3.09 | Significant Decrease |
11 | Bhabua | -2.29 | -1.46 | Significant Decrease |
12 | Bhagalpur | -0.60 | -0.42 | Non-significant Decrease |
13 | Bhojpur | -2.46 | -2.46 | Significant Decrease |
14 | Buxar | -2.77 | -1.92 | Significant Decrease |
15 | Darbhanga | -3.05 | -2.37 | Significant Decrease |
16 | Gaya | -4.12 | -2.81 | Significant Decrease |
17 | Gopalganj | -1.73 | -1.28 | Non-significant Decrease |
18 | Jehanabad | -2.83 | -2.26 | Significant Decrease |
19 | Katihar | -0.05 | -0.04 | Non-significant Decrease |
20 | Kishanganj | -0.80 | -1.04 | Non-significant Decrease |
21 | Madhepura | -1.20 | -1.08 | Non-significant Decrease |
22 | Madhubani | -3.21 | -2.57 | Significant Decrease |
23 | Muzaffarpur | -1.30 | -1.13 | Non-significant Decrease |
24 | Nalanda | -0.57 | -0.41 | Non-significant Decrease |
25 | Nawadah | -2.02 | -1.27 | Significant Decrease |
26 | Patna | -0.69 | -0.43 | Non-significant Decrease |
27 | Paschim Champaran | 0.24 | 0.20 | Non-significant Increase |
28 | Purba Champaran | -2.35 | -1.85 | Non-significant Decrease |
29 | Purnea | 2.12 | 2.18 | Significant Increase |
30 | Rohtas | -4.66 | -3.21 | Significant Decrease |
31 | Saharsa | -3.61 | -3.13 | Significant Decrease |
32 | Samastipur | -2.08 | -1.68 | Significant Decrease |
33 | Saran | -1.52 | -1.01 | Non-significant Decrease |
34 | Sheohar | -0.25 | -0.33 | Non-significant Decrease |
35 | Sitamarhi | -2.00 | -1.85 | Significant Decrease |
36 | Siwan | -1.24 | -0.99 | Non-significant Decrease |
37 | Supaul | -1.70 | -1.52 | Non-significant Decrease |
38 | Vaishali | -2.15 | -1.63 | Significant Decrease |
Source: Computed by the authors
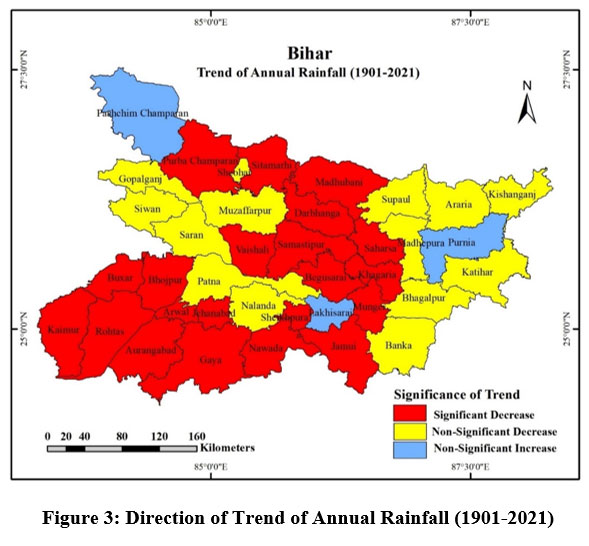 | Figure 3: Direction of Trend of Annual Rainfall (1901-2021).
|
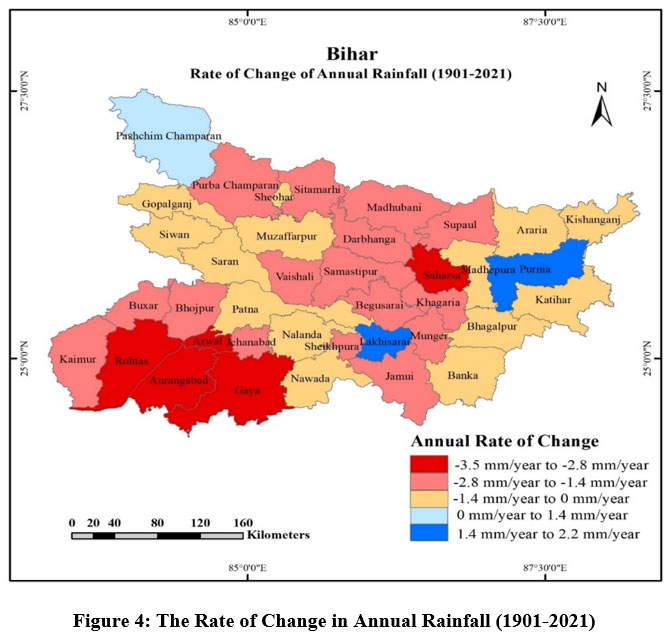 | Figure 4: The Rate of Change in Annual Rainfall (1901-2021).
|
Significant negative trends for following districts falling in both climatic divisions were observed: Begusarai, Jamui, Khagaria, Munger, Sheikhpura in tropical savanna climate zone and, Arwal, Aurangabad, Bhabua, Bhojpur, Buxar, Darbhanga, Gaya, Jehanabad, Madhubani, Nawada, Purbi Champaran, Rohtas, Saharasa, Samastipur, Sitamarhi, Vaishali in subtropical monsoon climate zone (Table 2). The central part of Bihar extending from terai (marshy low land area) region in north to southern plateau region shows significant decreasing trend (Figure 3). All stations except Paschim Champaran, Purnea and Lakhisarai had witnessed negative trends. Only district Purnea witnessed significant increasing trend making an exception to the general trend of the region.
The Sen’s slope estimator helps to quantify total change in terms of amount of rainfall increase or decrease. Highest decrease was noticed for the southwest part of Bihar especially Arwal, Rohtas, Aurangabad, Gaya where rainfall is decreasing a critical rate of 3mm/year to 3.5 mm/year (Figure 4). Sheikhpura, Jehanabad, Bhojpur, Buxar in South Bihar and Saharsa, Madhubani, Darbhanga and Khagaria in North Bihar witnessed an annual decrease is between 2mm/year to 3 mm/year. Only Lakhisarai and Purnea is witnessing a positive increasing of about 2 mm annually.
Variability of Annual Rainfall
Variability of rainfall is important for understanding magnitude of variations and dependability of annual precipitation. It helps policymakers, state planners, and hydrologists for water resource management, mitigation and adaptation strategies to cope with climate change. Different measures of variability like coefficient of variability (CV), standard deviation (SD) and range indicate departures from the mean and the possibility for anomalies leading to severe occurrences. Study of variability is also important for mitigating flood and drought, planning and preparing long term plans for natural hazards, reducing level of uncertainty by providing spatial information on the future availability of water. For the present study variability indices like coefficient of variation (CV), and standard deviation (SD) were used for understanding variability patterns for 1901 to 2021 for 38 stations in Bihar. CV was recorded highest for the Arwal, Khagaria, Lakhisarai, Supaul and Sheohar were it remained above 28%. Large parts of North Bihar that experiences frequent river floods and droughts also experiences high rainfall variability (between 22% to 24%). Overall, in Bihar, districts that receives high annual rainfall also correlate with areas that experiences high annual rainfall variability.
Overall, there exists high variability of rainfall ranging between 22% to 28%. Areas exhibiting high inter-annual variability in rainfall patterns are generally more prone to frequent floods and droughts. Highest variability is record for districts falling under the river basins of Baghmati, Kamla-Balan and Kosi (Sheohar, Sitamarhi, Muzaffarpur, Vaishali, Samastipur, Begusarai, Khagaria, Saharsa, Supaul, Lakhisarai, Sheikhpura) that witnesses heavy annual floods register (Figure 5). Lowest variability (below 22%) is recorded in the south-eastern, north-western and north-eastern part of Bihar that receives scanty rainfall.
The standard deviation (SD) remained high for entire region indicating higher annual fluctuation of rainfall distribution. Least deviation values were recorded for Patna, Nalanda, Lakhisarai and Nawada districts. While highest annual fluctuations were recorded for large parts of North Bihar that witnesses heavy floods in one year and droughts in next year. For tropical savanna (Aw) region SD remained low (approximately below 300 mm) while for tropical monsoon climate region (Cwa) it remained high and fluctuating between 260 mm to 468 mm.
 | Figure 5: Spatial Patterns of Annual Rainfall Variability (1901-2021).
|
Source: Prepared by the authors.
The range signifies absolute fluctuations and degree of uncertainty associated with precipitation change. Annual rainfall for all districts of Bihar ranged between 670 mm to 2333 mm. Only Sheohar, Saharsa, Supaul and Kishanganj were identified as areas with very high annual rainfall range (exceeding 2000 mm). Lowest rainfall range has been found at Aurangabad, Banka and Nawada where it remained below 1200 mm. Southern part of Bihar that receives relatively lesser amount of rainfall than north Bihar witnessed lesser rainfall variability. Subtropical monsoon climate (Cwa) exhibits higher variability as compared to tropical savanna climate zones (Aw). However, districts exhibiting lesser variability cannot be inferred as dependable rainfall areas under scenarios when rainfall is decreasing for the entire state. This high variability will affect future potentials of natural water resources of the state.
Summary and Conclusion
Understanding of patterns, trends and variability in precipitation are central to climate change studies. This study was undertaken to understand long-term (1901-2021) spatial patterns and trends of rainfall that is known to be highly variable across the state of Bihar. The statistical analysis of precipitation records was undertaken for all 38 districts that highlighted decreasing rainfall trends and highly variable conditions for the entire region. Precipitation in Bihar decreases as one traverses from northeast to southwest part of the state. The districts forming international boundary with Nepal and also forming part of terai region witnessed maximum rainfall. Rainfall variations are higher in subtropical monsoon climate zones as compared to tropical savanna climate zones. North Bihar experiences greater rainfall than southern part. The study utilized MK test along with Sen’s slope test to detect any change in rainfall trends. Only 3 districts i.e., Purnea, Lakhisarai and Paschim Champaran recorded an increasing rainfall trend. Most significant decreasing trend was noticed for the central part of Bihar extending from terai region to southern plateau region. The areas that receive heavy rainfall are also experiencing highest rate of annual decline of precipitation. Annually, the magnitude of the trend showed variance from a maximum decrease of -3.5 mm/year to -2.8 mm/year. The noticeable decrease in annual rainfall will have a significant impact on agricultural and pastoral practices in the region, particularly during the growth period of Kharif crops (May-October). This is a critical time when irrigation facilities are crucial for maintaining sufficient moisture levels. High fluctuations of precipitation ranging between 22%-26% may impact upon future climatic scenarios and hydrological balance. Thus, the analyses of annual rainfall data will be useful for policy makers, planners and hydrologists to plan and evolve strategies to adopt and to manage effectively the water resources for sustainability.
Acknowledgement
Authors acknowledge India Meteorological Department (IMD), Patna for providing latest meteorological data and Shri Anand Shankar, Scientist-C, IMD Patna for valuable suggestions and inputs.
Conflict of Interest
The authors have not declared any conflict of interests.
Funding Sources
No assistance under any scheme was received for this work.
References
- Sharma MR, Chandel VBS, Brar KK. Markers of Climate Change: Analysing Extreme Temperature Indices Over the Himalayan Mountains and Adjoining Punjab Plains. In: Schickhoff U., Singh R., Mal S., eds. Mountain Landscapes in Transition. Sustainable Development Goals Series. Springer, Cham. ; 2022:149-161. doi:10.1007/978-3-030-70238-0_2.
CrossRef - Sharma MR, Brar KK, Chandel VBS. Long-term analysis of trend and variability in annual rainfall in Punjab and Himachal Pradesh. Deccan Geogr. 2017;55(1&2):1-16. https://www.researchgate.net/publication/327269766_long-term_analysis_of_trend_and_variability_in_annual_rainfall_in_punjab_and_himachal_pradesh
- Jones PD, Hulme M. Calculating Regional Climatic Time Series for Temperature And Precipitation: Methods And Illustrations. Int J Climatol. 1996;16(4):361-377. doi:10.1002/(SICI)1097-0088(199604)16:4<361::AID-JOC53>3.0.CO;2-F
CrossRef - Karl TR, Knight RW. Secular Trends of Precipitation Amount, Frequency, and Intensity in the United States. Bull Am Meteorol Soc. 1998;79(2):231-241. doi:10.1175/1520-0477(1998)079<0231:STOPAF>2.0.CO;2
CrossRef - Doherty RM, Hulme M, Jones CG. A gridded reconstruction of land and ocean precipitation for the extended tropics from 1974 to 1994. Int J Climatol. 1999;19(2):119-142. doi:10.1002/(SICI)1097-0088(199902)19:2<119::AID-JOC358>3.0.CO;2-X
CrossRef - Dasari HP, Desamsetti S, Langodan S, Attada R, Ashok K, Hoteit I. Long-term changes in the Arabian Peninsula rainfall and their relationship with the ENSO signals in the tropical Indo-Pacific. Clim Dyn. 2022;59(5-6):1715-1731. doi:10.1007/s00382-021-06062-7
CrossRef - Frich P, Alexander L V., Della-Marta P, et al. Observed coherent changes in climatic extremes during the second half of the twentieth century. Clim Res. 2002;19(3):193-212. doi:10.3354/cr019193
CrossRef - Hartmann DL, Tank AMGK, Rusticucci M, et al. Observations: atmosphere and surface. In: Climate Change 2013 the Physical Science Basis: Working Group I Contribution to the Fifth Assessment Report of the Intergovernmental Panel on Climate Change. Cambridge University Press; 2013:159-254.
CrossRef - Lohmann U, Ferrachat S. Impact of parametric uncertainties on the present-day climate and on the anthropogenic aerosol effect. Atmos Chem Phys. 2010; 10(23):11373-11383. doi:10.5194/acp-10-11373-2010
CrossRef - Kunkel KE, Bromirski PD, Brooks HE, Cavazos T DA et al. Observed changes in weather and climate extremes. In: Karl TR, Meehl GA, Miller CD, Hassol SJ, Waple AM MW, ed. Weather and Climate Extremes in a Changing Climate. CCSP; 2008:35-80.
- Wang D, Hagen SC, Alizad K. Climate change impact and uncertainty analysis of extreme rainfall events in the Apalachicola River basin, Florida. J Hydrol. 2013; 480:125-135. doi:10.1016/j.jhydrol.2012.12.015
CrossRef - Allen MR, Ingram WJ. Constraints on future changes in climate and the hydrologic cycle. Nature. 2002; 419(6903):224-232. doi:10.1038/nature01092
CrossRef - Trenberth KE. Changes in precipitation with climate change. Clim Res. 2011;47(1-2):123-138. doi:10.3354/cr00953
CrossRef - Allan RP, Soden BJ. Atmospheric Warming and the Amplification of Precipitation Extremes. Science (80). 2008;321(5895):1481-1484. doi:10.1126/science.1160787
CrossRef - Papalexiou SM, Montanari A. Global and Regional Increase of Precipitation Extremes Under Global Warming. Water Resour Res. 2019;55(6):4901-4914. doi:10.1029/2018WR024067
CrossRef - Degefu MA, Bewket W. Trends and spatial patterns of drought incidence in the omo?ghibe river basin, ethiopia. Geogr Ann Ser A, Phys Geogr. 2015;97(2):395-414. doi:10.1111/geoa.12080
CrossRef - IPCC. Climate Change 2022: Impacts, Adaptation, and Vulnerability. Contribution of Working Group II to the Sixth Assessment Report of the Intergovernmental Panel on Climate Change.; 2022. doi:10.1017/9781009325844.
CrossRef - Zhang M, Wei X, Sun P, Liu S. The effect of forest harvesting and climatic variability on runoff in a large watershed: The case study in the Upper Minjiang River of Yangtze River basin. J Hydrol. 2012;464-465:1-11. doi:10.1016/j.jhydrol.2012.05.050
CrossRef - Gautam S, Costello C, Baffaut C, Thompson A, Sadler EJ. Projection of future drought and extreme events occurrence in Goodwater Creek Experimental Watershed, Midwestern US. Hydrol Sci J. 2021;66(6):1045-1058. doi:10.1080/02626667.2021.1906878
CrossRef - IPCC. Global Warming of 1.5°C. An IPCC Special Report on the Impacts of Global Warming of 1.5°C above Pre-Industrial Levels and Related Global Greenhouse Gas Emission Pathways, in the Context of Strengthening the Global Response to the Threat of Climate Change.; 2018. https://www.ipcc.ch/site/assets/uploads/sites/2 /2019/06/SR15_Full_ Report_High_Res.pdf
- Thoeun HC. Observed and projected changes in temperature and rainfall in Cambodia. Weather Clim Extrem. 2015;7:61-71. doi:10.1016/j.wace.2015.02.001
CrossRef - Pattanaik DR, Rajeevan M. Variability of extreme rainfall events over India during southwest monsoon season. Meteorol Appl. 2010;17(1):88-104. doi:10.1002/met.164
CrossRef - Goswami, B.N., Venugopal, V., Sengupta, D., Madhusudan, M.S., Xavier, P.K. Increasing trends of extreme rain events over India in a warming environment Science, 2006; 314: 1442–1445.
CrossRef - Xia J, Duan QY, Luo Y, Xie ZH, Liu ZY, Mo XG. Climate change and water resources: Case study of Eastern Monsoon Region of China. Adv Clim Chang Res. 2017; 8(2):63-67. doi:10.1016/j.accre.2017.03.007
CrossRef - Nyatuame M, Owusu-Gyimah V and Ampiaw F. Statistical Analysis of Rainfall Trend for Volta Region in Ghana. Int. J. Atmos. Sci. 2014; 67: 1-11
CrossRef - Kumar V, Jain SK, Singh Y. Analysis of long-term rainfall trends in India. Hydrol Sci J. 2010;55(4):484-496. doi:10.1080/02626667.2010.481373
CrossRef - Zakwan M, Ara Z. Statistical analysis of rainfall in Bihar. Sustain Water Resour Manag. 2019;5(4):1781-1789. doi:10.1007/s40899-019-00340-3
CrossRef - Aayog N. Annual Report 2021-2022.; 2022. https://www.niti.gov.in/sites/default/files/2022-02/Annual_Report_2021_2022_%28English%29_22022022.pdf
- Singh N, Sontakke N A. On Climatic Fluctuations and Environmental Changes of the Indo-Gangetic Plains, India. Climate Change. 2002; 52:287-313.https://doi.org/10.1023/A: 1013772505484
CrossRef - Chinnasamy P, Bharati L, Bhattarai U, Khadka A, Dahal V, Wahid S. Impact of planned water resource development on current and future water demand in the Koshi River basin, Nepal. Water Int. 2015;40(7):1004-1020. doi:10.1080/02508060.2015.1099192
CrossRef - Sinha B. Role of Watershed Management in Water Resources Development Planning—Need for Integrated Approach to Development of Catchment and Command of Irrigation Projects. Water Int. 1984;9(4):158-160. doi:10.1080/02508068408686528
CrossRef - Kendall MG. Rank Correlation Method. 4th ed. Charles Griffin; 1975.
- Theil H. A rank-invariant method of linear and polynomial regression analysis. P.1. Proceedings of the Royal Netherlands Academy of Sciences. 1950a; 53: 386–392.
- Sen PK. Estimates of the Regression Coefficient Based on Kendall’s Tau. J Am Stat Assoc. 1968; 63:1379-1389. doi:https://doi.org/10.1080/01621459.1968.10480934
CrossRef - Pingale SM, Khare D, Jat MK, Adamowski J. Trend analysis of climatic variables in an arid and semi-arid region of the Ajmer District, Rajasthan, India. J Water L Dev. 2016;28(1):3-18. doi:10.1515/jwld-2016-0001
CrossRef


