Assessment of Trace Element Concentrations in Groundwater Sources of a Rural Village in Kerala, India
Muhammed Thaniem
 , Anupama Prakash
, Muniyandi Muniasamy
*
, Rangasamy Eeshwar
and Palanisamy Sundarabalan
, Anupama Prakash
, Muniyandi Muniasamy
*
, Rangasamy Eeshwar
and Palanisamy Sundarabalan
1
School of Life Science, Department of Environmental Sciences,
Bharathiar University,
Coimbatore,
Tamil Nadu
India
http://dx.doi.org/10.12944/CWE.18.2.34
Copy the following to cite this article:
Thaniem M, Prakash A, Muniasamy M, Eeshwar R, Sundarabalan P. Assessment of Trace Element Concentrations in Groundwater Sources of a Rural Village in Kerala, India. Curr World Environ 2023;18(2). DOI:http://dx.doi.org/10.12944/CWE.18.2.34
Copy the following to cite this URL:
Thaniem M, Prakash A, Muniasamy M, Eeshwar R, Sundarabalan P. Assessment of Trace Element Concentrations in Groundwater Sources of a Rural Village in Kerala, India. Curr World Environ 2023;18(2).
Download article (pdf)
Citation Manager
Publish History

Introduction
Water is an essential part of all living organisms. For a number of reasons, mankind needs access to a reliable source of groundwater1. In India, groundwater is a crucial natural resource for irrigation and drinking. Both urban and rural regions mostly rely on groundwater as their source of drinking water. India is already experiencing the effects of the impending global freshwater crisis in terms of water quantity and quality. The use of groundwater has expanded along with the population. Since it is directly related to human welfare, water quality is a crucial problem for humanity. Poor groundwater quality can be detrimental to both human health and plant growth2. The physicochemical features of water quality are becoming significantly influenced by human activities and it is extreme in emerging nations worldwide. The usage of physicochemical can be uniform throughout the text with either feature or properties. The physico-chemical properties of water are changed not just by anthropogenic influence but also by other natural factors3.
Groundwater pollution from trace metals is a significant environmental issue that requires considerable attention that could be hazardous to both human and ecological well-being4. Since the heavy metals are harmful even at low concentrations and are disseminated into the water column by both natural and manmade processes, heavy metals are a significant class of environmental contaminants5. Due to their toxicity, persistence, and bioaccumulation traits, among other environmental pollutants, heavy metals have the worst effects on both the aquatic ecosystem and drinking water.
There is no literature available on the specified research problem and hence an attempt is made to close the gap. The amounts of heavy metals in drinking and irrigation water must be continuously checked, and this gap must be closed. The spatial distribution of heavy metals and the possible harm to human health from groundwater contamination during the pre-monsoon season are explored in the current study. Thus, this is a pioneering attempt in identifying the potential heavy metal types that are accumulated at an alarming level as it has yielded some baseline information. The study is primarily focused with the following objective.
To document the different types of heavy metals.
To identify the possible harm to human health from the source samples collected during pre-monsoon time.
Materials and Methods
Study Area
‘Villiappally’ a grama-panchayath lies in Kozhikode district, Kerala, Southern India (11°37'32" north and 75°37'46" east). Details about the research region are provided in table No. 1 and depicted in figure 1. The location of the village, which has a population of 31,763 people (Census 2001). It has an area of 17.35 sq. km (Census 2001). Geologically, the study area comprises of migmatite complex with hornblende formation. The physiographic divisions of the Kozhikode district, from west to east, are: coastal plain - low land, mid land, and high land - mountainous terrain, according to the survey report created by the department of mining and geology in 2016. The Villiappally grama-panchayath located in the mid land of Kozhikode district. The height of the midland region ranges from 7.6 to 76 metres. Groundwater is found in the weathered, fractured, crystalline, and alluvial formations in the district6. Depth to water varies from 5 to 20 metres below ground level in an area covered by thick laterite. According to central ground water board monitoring wells, the average ground water level in Villiappally gramapanchayath in 2018–19 is 6.72 metres7.
Twenty-two public dug wells from 19 wards of panchayath that are used by the local people for drinking, sanitation and other daily needs are selected as sample site in this study.
Table 1: Coordinates and elevation of sampling site. (Garmin Gpsmap 64s)
| Sample No: | Coordinates | Elevation (m) |
| DW-1 | N 11°37´34.22´´, E 075°38´23.77´´
| 9 |
| DW-2 | N 11°37´28.28´´, E 075°38´04.53´´
| 61 |
| DW-3 | N 11°37´44.91´´, E 075°38´52.73´´
| 14 |
| DW-4 | N 11°37´28.29´´, E 075°38´53.28´´
| 15 |
| DW-5 | N 11°37´18.82´´, E 075°39´07.46´´
| 10 |
| DW-6 | N 11°37´14.26´´, E 075°38´36.22´´
| 11 |
| DW-7 | N 11°36´47.44´´, E 075°38´07.17´´
| 19 |
| DW-8 | N 11°36´51.64´´, E 075°38´18.62´´
| 17 |
| DW-9 | N 11°37´40.96´´, E 075°37´29.12´´
| 14 |
| DW-10 | N 11°37´12.86´´, E 075°36´58.65´´
| 35 |
| DW-11 | N 11°37´01.19´´, E 075°36´40.85´´
| 33 |
| DW-12 | N 11°37´00.39´´, E 075°36´32.41´´
| 15 |
| DW-13 | N 11°36´32.54´´, E 075°37´34.38´´
| 36 |
| DW-14 | N 11°36´20.86´´, E 075°37´59.33´´
| 19 |
| DW-15 | N 11°35´16.03´´, E 075°37´48.45´´
| 11 |
| DW-16 | N 11°35´16.87´´, E 075°37´15.46´´
| 9 |
| DW-17 | N 11°35´21.49´´, E 075°37´14.00´´
| 10 |
| DW-18 | N 11°35´25.95´´, E 075°37´05.97´´
| 14 |
| DW-19 | N 11°34´56.60´´, E 075°36´50.52´´
| 18 |
| DW-20 | N 11°35´52.91´´, E 075°37´04.72´´
| 22 |
| DW-21 | N 11°35´36.54´´, E 075°38´19.33´´
| 32 |
| DW-22 | N 11°35´30.04´´, E 075°38´25.47´´
| 21 |
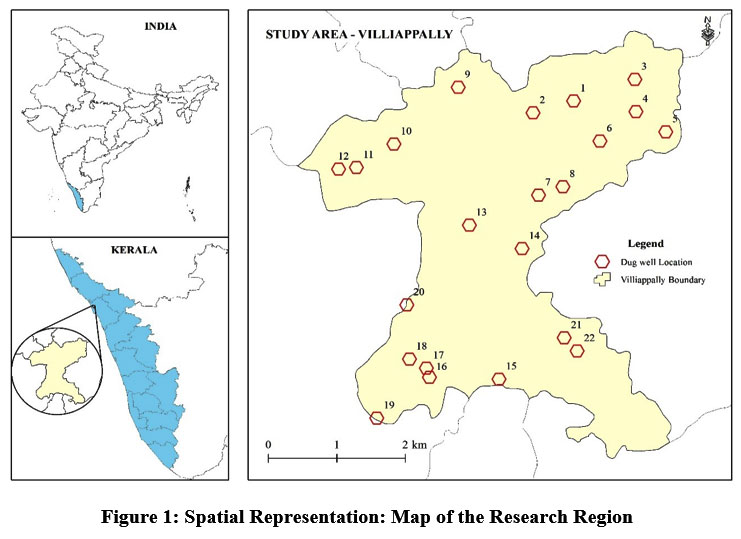 | Figure 1: Spatial Representation: Map of the Research Region.
|
Preservation and Sampling Approaches for Groundwater Analysis.
In the study area, groundwater samples were taken from 22 public dug wells between May and June 2022. A portable global positioning system device (GARMIN GPSMAP 64S) was used to record the latitude, longitude, and elevation of each groundwater sampling site while samples were being taken. Purging was done for 5 to 10 minutes before samples were taken. The samples were obtained in high density polyethylene containers measuring 1 litre that were rinsed three to four times with the appropriate sample prior to sampling. Whatman 0.45 m filter paper was used to filter the samples. In a lab setting, ultrapure HNO3 was used to maintain the pH of the samples that were collected. The samples were then correctly labelled with water-resistant markers and transported to the lab in ice box8. The samples were preserved in a deep freezer maintaining below 4 °C temperature for further analysis.
Heavy metal analysis
Using ICP-MS (PerkinElmer NexION 300X), the samples were analyzed for presence of the trace elements Al, As, Cd, Fe, Pb, and Zn. For the precise quantitative evaluation of trace elements in water samples, a multi-standard calibration procedure was employed, utilizing an internal standard approach with a 22-metal standard provided by PerkinElmer. In preparation for ICP-MS analysis, the collected water samples were diluted to 10 mL by adding 1.0 mL of the sample to 0.3 percentage ultrapure nitric acid. Each sample were tested in triplicate, and the resulting data from ICP-MS analysis included the Standard Deviation and Relative Standard Deviation.
Heavy Metal Pollution Index (HPI)
The assessment of contamination levels in water samples involved the utilization of the Heavy Metal Pollution Index (HPI). The pollution index was employed to evaluate the cumulative impact of each heavy metal on the overall water quality and its suitability for human consumption. Calculating the heavy metal pollution index involved a two-step process: selecting the pollution parameters as the foundation of the index and developing a grading scale for each quality characteristic while assigning parameter weights using a weighted arithmetic mean technique110,11.
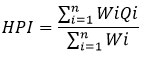
Where n represents the number of parameters under consideration, Qi denotes the sub-index of the ith parameter, and Wi signifies its unit weight. As a result, the sub-index of the parameter (Qi) is defined by

Mi represents the observed trace element, while Ii and Si (table:2) denote the ideal and standard values of the ith parameter, respectively. However, it is worth noting that the distinction between Mi and Ii overlooked the algebraic sign in the negative12. The Si and li values were obtained from the standard value set by BIS 2012.13
Table 2: Comparative table, showing the ideal limit and the standard permissible limit of selected heavy metals under study
Heavy metal (HM) | Symbol
| Standard permissible limit (Si) | Ideal value (li) |
Aluminium | Al | 200 | 30 |
Arsenic | As | 50 | 10 |
Cadmium | Cd | 3 | 0 |
Iron | Fe | 300 | 0 |
Lead | Pb | 10 | 0 |
Zinc | Zn | 15000 | 5000 |
Source BIS: 201214
Metal index
Metal indices that are used to accurately determine the overall water quality and assess the potential effects of heavy metals on public health15. The Metal Index (MI) is based on a comprehensive trend analysis of the current situation of a resource16. Metal Index is calculated using the formula below:
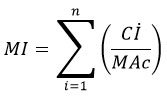
The mean concentration of each element is denoted as Ci, while the maximum permissible concentration (MAC) represents the allowable limit. In relation to water quality, a higher quantity of a element relative to its specific MAC value indicates poorer water standard. An MI value greater than 1 suggests a degree of caution17.
Table 3: Classification and characteristics according to the Metal Index (Mi) value8,18
Class | Quality | Mi Values |
? | Very pure | < 0.3 |
? | Pure | 0.3 to 1 |
? | Slightly Affected | 1 to 2 |
? | Moderately Affected | 2 to 4 |
? | Strongly Affected | 4 to 6 |
? | Seriously Affected | > 6 |
Statistical Analysis
Using IBM SPSS 2022 software, a Pearson correlation analysis was done to determine the relationship between the elemental content in ground water samples. The other statistical parameters (Mean, Standard deviation) were done by Microsoft excel 2019 version.
Results
Trace elements concentration in well water
There were no previous records available on the level of trace elemental contamination in the well water of Villiappally gramapanchayath. The results obtained for heavy metal concentration of ground water using ICP-MS are shown in table below and the average concentration of trace elements in all the wells, maximum and minimum range of all heavy metals present and median of all whole data are presented in Table:5. The study area is surrounded by mainly residential, agricultural and barren land. The potential source of pollutants may be from the household wastes, fertilizers and pesticides application in agricultural fields and other landfills in the vicinity. The acquired value of heavy metal concentration is discussed with the standard values proposed by BIS 2012 is shown in table no:2.
Aluminium (Al)
Majority of the samples has been found to have low levels of aluminium. The sample concentration ranges from 7.5 to 17.9 µg/l. Sample site no: DW1, DW2, and DW5 only shows the presence of Aluminium. None of the sample shows the presence of aluminium beyond the level of standard limits. The relatively high quantities of aluminium in groundwater may be due to the metal's dissolution from clays and other alumino-silicate minerals found in soils, sediments, and rocks19.
Arsenic (As)
Chronic exposure to arsenic-contaminated water is known to cause skin sores and cancer20. All of areas showed arsenic without exceeding the BIS 2012 standard limits, with concentrations ranging from 4.71 to 9.74 µg/l in the chosen dug wells. Mean arsenic concentration of all wells is 8.33µg/l whereas DW11 and DW19 shows a negative deviation from mean concentration. The western side of the Villiappally gramapanchayath shows lower arsenic concentration than eastern part.
Cadmium (Cd)
Cadmium is a very hazardous heavy metal even at low quantities. The content of cadmium varies from 1.67 to 8.67 µg/l, with 3 µg/l being the maximum permissible level specified by BIS and 5 µg/l by WHO. DW1, DW2, and DW14 forecast the concentration to be higher than allowed limits by analysing the entire sampling well. The biological half-life of cadmium in the human body is lengthy, ranging from 10 to 33 years. Renal damage caused by prolonged exposure to Cd. Additionally, it interferes with the body's metabolism of calcium, and incidences of lung and prostate cancer have been linked to excessive Cd exposure21.
Iron (Fe)
The widespread presence of iron in groundwater were also studied by the authorities as a serious problem, leading to framing strict guidelines by BIS, which resulted in a lower maximum permissible limit for iron concentration in drinking water from 100 µg/l to 300 µg/l10. The value of iron ranges from 23.74 to 651.43µg/l in the present study with: DW6 and DW15 showing higher concentration of iron (651.4 and 409µg/l) which exceed the limit of BIS. Drinking water with too much iron can encourage the development of iron bacteria, which can block pipes, lessen water flow, and produce an unpleasant odour22.
Lead (Pb)
The amount of lead in groundwater exceeding 10 µg/l is regarded as contaminated or unfit for human consumption by the Bureau of Indian. The ICP-MS analysis doesn't show a single of the samples contained lead which ensures the absence of lead in the study area. Kidney damage and a higher risk of high blood pressure can result from lead accumulation in the kidney and interfering with their ability to function23.
Zinc (Zn)
The presence of zinc in groundwater and surface water may be due to the result of nearby rock formations' sphalerite and smithsonite minerals, which contain zinc, dissolving. The amount of zinc in the water depends on its pH, temperature, and dissolved oxygen content as well as the amount of zinc in the nearby geology24. The acquired value of zinc in different sample site ranges from 7.95 to 54.3µg/l. As compared with other metals and their permissible limit, Zinc is relatively very low in its presence. The levels of zinc in groundwater can vary depending on various factors such as geology, land use, and the presence of other minerals.
Table 4: Concentration of trace elements in µg/l with standard deviation (±) n=3 in the dug wells.
Dug well No: DW | Aluminium
| Arsenic | Cadmium
| Iron | Lead | Zinc (Zn) |
DW 1 | 14.5±3.36 | 8.5±0.05 | 7.7±0.04 | 126.9±27.3 | ND* | 22.4±1.47 |
DW2 | 7.5±3.25 | 9.6±0.03 | 8.6±0.02 | 95.9±11.77 | ND* | 21.3±0.14 |
DW 3 | ND* | 9.4±0.06 | 2.6±0.03 | 68.9±1.06 | ND* | 20.8±0.42 |
DW 4 | ND* | 7.3±0.06 | 3.6±0.00 | 85.7±3.85 | ND* | 46.7±0.41 |
DW 5 | 17.9±1.14 | 9.2±0.01 | 1.6±0.03 | 179.3±13.3 | ND* | 32.4±0.59 |
DW 6 | ND* | 9.1±0.01 | 0.6±0.01 | 651.4±17.8 | ND* | 14.8±0.25 |
DW 7 | ND* | 6.1±0.02 | 2.6±0.03 | 41.7±10.73 | ND* | 10.5±0.16 |
DW 8 | ND* | 9.1±0.02 | 1.6±0.01 | 49.9±10.13 | ND* | 29.8±0.92 |
DW 9 | ND* | 7.3±0.00 | 3.6±0.02 | 148.8±18.7 | ND* | 7.5±0.05 |
DW10 | ND* | 9.1±0.03 | 0.6±0.02 | 36.6±3.49 | ND* | 54.3±0.56 |
DW11 | ND* | 5.1±0.01 | 0.6±0.00 | 29.4±4.11 | ND* | 17.3±0.29 |
DW12 | ND* | 9.2±0.01 | 2.6±0.02 | 139.9±4.66 | ND* | 29.4±0.08 |
DW13 | ND* | 8.8±0.01 | 0.6±0.02 | 36.7±4.28 | ND* | 17.4±0.26 |
DW14 | ND* | 8.7±0.01 | 4.6±0.01 | 23.7±8.05 | ND* | 26.3±0.64 |
DW15 | ND* | 8.9±0.05 | 1.6±0.00 | 409±9.81 | ND* | 12.1±0.22 |
DW16 | ND* | 7.9±0.02 | 0.6±0.02 | 37.9±2.46 | ND* | 10.0±0.07 |
DW17 | ND* | 9.1±0.01 | 1.6±0.02 | 120.4±11.8 | ND* | 28.2±0.25 |
DW18 | ND* | 8.8±0.07 | 2.6±0.02 | 41.9±2.99 | ND* | 17.5±0.13 |
DW19 | ND* | 4.1±0.04 | 1.6±0.04 | 34.3±7.42 | ND* | 18.2±0.42 |
DW20 | ND* | 8.9±0.01 | 0.6±0.03 | 73.5±19.83 | ND* | 31.1±0.88 |
DW21 | ND* | 8.8±0.05 | 0.6±0.00 | 45.9±8.79 | ND* | 24.9±0.04 |
DW22 | ND* | 9.7±0.03 | 0.6±0.03 | 70.3±9.85 | ND* | 14.3±0.12 |
| DW*: Dug well, ND*: Not detected |
|
|
|
|
| |
Table 5 : Average range of trace elements concentrations across all samples, measured in g µg/l.
Parameter | Aluminium | Arsenic | Cadmium | Iron | Lead | Zinc |
Mean | 1.779090909 | 8.335909091 | 2.391363636 | 115.8309091 | 0 | 23.03 |
Median | 0 | 8.86 | 1.67 | 69.655 | 0 | 20.69 |
Max Value | 17.09 | 9.74 | 8.67 | 651.43 | 0 | 54.3 |
Min Value | 0 | 4.71 | 0.65 | 23.74 | 0 | 7.95 |
HPI
Heavy metal pollution index (HPI) carried out for each well by using the concentration of metals received from ICP-MS analysis. The analysed heavy metal pollution index shows an order of pollution: DW13 < DW21 < DW9 < DW22 < DW11 < DW20 < DW16 < DW6 < DW5 < DW8 < DW15 < DW17 < DW19 < DW18 < DW12 < DW7 < DW3 < DW10 < DW4 < DW14 < DW1 < DW2. According to the HPI, the dug wells DW2, DW1 and DW14 is not suitable for consumption as it is showing the value of HPI > 100 (figure:2).
 | Figure 2: Calculated HPI value of each well water (Red gridline:>100 HPI- Not fit for consumption.
|
Metal index
The wells are classified in to different classes according to their metal concentration by using metal index (table:6). The metal index categorises DW8, DW9, DW13, DW19, DW20, DW21, and DW22 as pure, DW18, DW17, DW14, DW12, DW10, DW7, DW5, DW4, and DW3 as slightly influenced, and DW1, DW2, DW6, and DW15 as moderately affected.
Table 6 classification of dug wells according to their metal index value
Metal Index (Mi) | ||
Classification | Sample Dug well No | ?ci/MAC (Mi Value) |
Class ?- Very pure | - | - |
Class ?- Pure | 8 | 0.907238667 |
9 | 0.52582 | |
11 | 0.418835333 | |
13 | 0.516716 | |
16 | 0.51262 | |
19 | 0.769774667 | |
20 | 0.648720667 | |
21 | 0.547479333 | |
22 | 0.650175333 | |
Class ?- Slightly affected |
|
|
3 | 1.317538667 | |
4 | 1.658911333 | |
5 | 1.422772667 | |
7 | 1.152016667 | |
10 | 1.850063333 | |
12 | 1.538949333 | |
14 | 1.812342 | |
17 | 1.143654667 | |
18 | 1.186423333 | |
Class ?-Moderately affected |
|
|
1 | 3.234252667 | |
2 | 3.441286667 | |
6 | 2.575285333 | |
15 | 2.090420667 | |
Class ?- Strongly affected | - | - |
Class ?- Seriously affected | - | - |
Table 7: Pearson correlation analysis of each element in the sample.
| Al | As | Cd | Fe | Zn |
Al | 1 |
|
|
|
|
As | .196 | 1 |
|
|
|
Cd | .498* | .093 | 1 |
|
|
Fe | .074 | .245 | -.085 | 1 |
|
Zn | .114 | .230 | -.011 | -.213 | 1 |
Correlation Analysis
Aluminium and cadmium have a very weakly positive link. Aluminium and cadmium have similar chemical properties, such as their ability to form complexes and bind to other compounds. This could lead to a correlation between the two metals in groundwater samples. Contamination from common sources could also be a possible reason for correlation. The correlation between aluminium and cadmium in groundwater can be complex and may involve multiple factors. Further research is needed to determine the specific reasons for the observed correlation.
Conclusion
The study emphasises the significance of routine water quality monitoring in rural regions and the requirement to take action to prevent water source pollution. In the current research, a total of 22 groundwater samples from Villiappally gramapanchayath, located in Kozhikode district, Kerala, were analyzed for the presence of heavy metals. The results of the study suggest the need for immediate action to address the problem of heavy metal contamination in rural water sources. This may be accomplished by adopting suitable treatment procedures in place, regularly checking the quality of the water, and educating the local community about the hazards of trace elemental pollution in water. The results of this study can potentially be used as a foundation for future investigations into the causes and processes of heavy metal pollution in rural groundwater.
Acknowledgement
The author would like to express the deepest gratitude to all those who have contributed to the completion of this research work. It would like to thank the research supervisor Dr.M.
Muniasamy for their unwavering support, guidance, and valuable feedback throughout the entire research process. It is also grateful to Bharathiar university for providing me with the
necessary resources and facilities to carry out this research work.
Funding Sources
The author(s) received no financial support for the research, authorship, and/or publication of this article.
Conflict of Interest
The authors do not have any conflicts of interest.
References
- Ijumulana, J., Ligate, F., Irunde, R., Bhattacharya, P., Ahmad, A., Tomašek, I., ... & Mtalo, F. Spatial variability of the sources and distribution of fluoride in groundwater of the Sanya alluvial plain aquifers in northern Tanzania. Science of the Total Environment. 2022; 810: 152153.
CrossRef - Thilagavathi, R., Chidambaram, S., Prasanna, M. V., Thivya, C., & Singaraja, C. A study on groundwater geochemistry and water quality in layered aquifers system of Pondicherry region, southeast India. Applied water science. 2012; 2: 253-269.
CrossRef - Uddin, M. G., Moniruzzaman, M., & Khan, M. Evaluation of groundwater quality using CCME water quality index in the Rooppur Nuclear Power Plant Area, Ishwardi, Pabna, Bangladesh. American Journal of Environmental Protection. 2017; 5(2): 33-43.
CrossRef - Arslan, H., & Ayyildiz Turan, N. Estimation of spatial distribution of heavy metals in groundwater using interpolation methods and multivariate statistical techniques; its suitability for drinking and irrigation purposes in the Middle Black Sea Region of Turkey. Environmental Monitoring and Assessment 2015;187: 1-13.
CrossRef - Schwarzenbach, R. P., Egli, T., Hofstetter, T. B., Von Gunten, U., & Wehrli, B. Global water pollution and human health. Annual review of environment and resources 2010;35: 109-136.
CrossRef - District Survey Report of Minor Minerals, Kozhikode District (2016). www.dmg.kerala.gov.in
- Central groundwater board, India. Ground water year book of Kerala CGWB,2019-20. http://cgwb.gov.in/Regions/KR/Reports/KR_GW%20Year%20book%202019-20.pdf.
- Ogunkunle, C. O., Mustapha, K., Oyedeji, S., & Fatoba, P. O. Assessment of metallic pollution status of surface water and aquatic macrophytes of earthen dams in Ilorin, north-central of Nigeria as indicators of environmental health. Journal of King Saud University-Science. 2016;28(4): 324-331.
CrossRef - Reza, R., & Singh, G. Assessment of ground water quality status by using Water Quality Index method in Orissa, India. World Appl Sci J. 2010; 9(12): 1392-1397.
- Mohan, S. V., Nithila, P., & Reddy, S. J. Estimation of heavy metals in drinking water and development of heavy metal pollution index. Journal of Environmental Science & Health Part A.1996; 31(2): 283-289.
CrossRef - Singh, G., & Kamal, R. K. Heavy metal contamination and its indexing approach for groundwater of Goa mining region, India. Applied water science.2017;7: 1479-1485.
CrossRef - Rahman, M. A., Paul, M., Bhoumik, N., Hassan, M., Alam, M., & Aktar, Z. Heavy metal pollution assessment in the groundwater of the Meghna Ghat industrial area, Bangladesh, by using water pollution indices approach. Applied Water Science.2020;10(8): 1-15.
CrossRef - Mirza A. T. M. Tanvir Rahman, Moutushi Paul, Nikhil Bhoumik, Mahmud Hassan, Md. Khorshed Alam, Zakia Aktar. "Heavy metal pollution assessment in the groundwater of the Meghna Ghat industrial area, Bangladesh, by using water pollution indices approach", Applied Water Science, 2020
- BIS, I. (2012). Bureau of Indian Standards. New Delhi, 2-3.
- Ojekunle, O. Z., Ojekunle, O. V., Adeyemi, A. A., Taiwo, A. G., Sangowusi, O. R., Taiwo, A. M., & Adekitan, A. A. Evaluation of surface water quality indices and ecological risk assessment for heavy metals in scrap yard neighbourhood. SpringerPlus. 2016; 5(1): 1-16.
CrossRef - Tamasi, G., & Cini, R. Heavy metals in drinking waters from Mount Amiata (Tuscany, Italy). Possible risks from arsenic for public health in the Province of Siena. Science of the total environment 2004; 327(1-3): 41-51.
CrossRef - Bakan, G., Özkoç, H. B., Tülek, S., & Cüce1T, H. Integrated environmental quality assessment of the K?z?l?rmak River and its coastal environment. Turkish Journal of Fisheries and Aquatic Sciences.2010;10(4).
CrossRef - Hamdan, A. N. A. Assessment of heavy metals pollution in the Shatt Al-Arab River, Basra-Iraq. In AIP Conference Proceedings. 2020; (Vol. 2213, No. 1, p. 020037).
CrossRef - Chetia, M. Assessment of drinking water quality in different small tea gardens of Sonitpur District (Assam), India. 2010.
- Karagas, M. R., Gossai, A., Pierce, B., & Ahsan, H. Drinking water arsenic contamination, skin lesions, and malignancies: a systematic review of the global evidence. Current environmental health reports. 2015;2:52-68.
CrossRef - Idrees, N., Tabassum, B., Abd_Allah, E. F., Hashem, A., Sarah, R., & Hashim, M. Groundwater contamination with cadmium concentrations in some West UP Regions, India. Saudi journal of biological sciences. 2018;25(7):1365-1368.
CrossRef - World Health Organization. (2011). Guidelines for drinking-water quality. Geneva:World Health Organization.
- Flora, G., Gupta, D., & Tiwari, A.Toxicity of lead: a review with recent updates. Interdisciplinary toxicology. 2012;5(2): 47-58.
CrossRef - U.S. Environmental Protection Agency (EPA).2022. Basic Information about Zinc in Drinking Water. Retrieved from https://www.epa.gov/dwreginfo/basic-information-about-znc-drinking-water.


