Assessment of Spatial Variability Mapping of Soil Properties and its Impacts on Agricultural Productivity using GIS Approach in Siliguri Sub-Division, West Bengal, India
Abhisek Sarkar
 , Dipesh Roy
*
and Deepak Kumar Mandal
, Dipesh Roy
*
and Deepak Kumar Mandal
1
Department of Geography and Applied Geography,
University of North Bengal,
Siliguri,
West Bengal
India
http://dx.doi.org/10.12944/CWE.18.2.28
Copy the following to cite this article:
Sarkar A, Roy D, Mandal D. K. Assessment of Spatial Variability Mapping of Soil Properties and its Impacts on Agricultural Productivity using GIS Approach in Siliguri Sub-Division, West Bengal, India.Curr World Environ 2023;18(2). DOI:http://dx.doi.org/10.12944/CWE.18.2.28
Copy the following to cite this URL:
Sarkar A, Roy D, Mandal D. K. Assessment of Spatial Variability Mapping of Soil Properties and its Impacts on Agricultural Productivity using GIS Approach in Siliguri Sub-Division, West Bengal, India.Curr World Environ 2023;18(2).
Download article (pdf)
Citation Manager
Publish History

Introduction
One of the most important elements of land is the soil. Soil is the foundation of agriculture and the majority of food-producing plants grow in this environment as well1. Healthy soils provide healthy crops which nourish people and animals2. Food quality and quantity are, in fact, directly correlated with soil quality3.Therefore there is an urgent requirement of a better sustainable development of soil and land resource planning. Evaluation of spatial variation of soil features within a landscape is useful information that can be gleaned from mapping soil attributes. In order to make decisions for environmentally friendly land use and increased production, land managers need to have a thorough grasp of aspects such as soil fertility, nutrients distribution, runoff hazards, and other critical elements. In order to map spatial variability, soil samples must be taken at various points throughout the region being studied. The features of these soil samples, including soil texture, pH levels, organic matter content, amount of nutrients, and other pertinent factors, are then examined. The distribution trends & variation of these soil attributes over the terrain are then depicted on maps and spatial models made from the data obtained. Mapping spatial variability enables the identification of regions with particular soil constraints or opportunity for increased productivity. It makes it possible to define management zones inside of a field and landscape where specialised methods can be used to enhance agricultural practises. Farmers can, for instance, apply fertilisers at varying rates across different zones based on the mapping of soil nutrient variability, optimising nutrient usage efficiency and reducing environmental consequences. The main goal of sustainable agriculture is to meet the current needs for food production while ensuring the long-term health and productivity of the natural resources on which agriculture depends. It seeks to strike a balance between economic viability, environmental stewardship, and social responsibility. Sustainable agriculture recognizes that our planet's resources are finite and that agricultural practices must be implemented in a manner that conserves and protects these resources. This approach seeks to maximise resource efficiency while minimising detrimental effects on the natural environment, which involve soil erosion, contamination of water, and habitat destruction. One of the key aspects of sustainable agriculture is soil conservation. Soil is a vital component of agriculture, as it provides the nutrients and support necessary for plant growth. With the use of strategies like crop rotation, the use of cover crops, and minimal tillage, sustainable farming practises aim to preserve the fertility and health of the soil. These methods lessen the requirement for synthetic fertilisers and maintain soil quality for generations to come by preventing erosion, improving soil structure, and fostering natural nutrient cycling. Sustainable agriculture emphasizes efficient water management strategies, such as drip irrigation, precision farming, and water recycling, to minimize water wastage and reduce the impact on freshwater ecosystems. By using water resources responsibly, sustainable agriculture aims to ensure their availability for both agricultural purposes and other societal needs. Sustainable agriculture considers the social and economic well-being of farmers and rural communities. It advocates for fair trade practices, encourages local food systems, and supports the livelihoods of small-scale farmers. By promoting equitable and inclusive agricultural systems, sustainable agriculture aims to create resilient communities and ensure food security for all4.For natural resource management, sustainable development, and intensive agriculture, accurate quantitative assessment of information of spatial variability in soil is significant. The spatial distribution patterns of soil characteristics have a significant role in bio-physical processes and are a common feature of natural communities of living organisms5, 6.Agricultural productivity of the seven major crops in the Siliguri Sub-Division is moderate in nature. Ghoshpukur has the highest API with 1.29 points and lowest API (Agricultural productivity index) is present in Hatighisa and Moniram which is 0.81 and 0.88 respectively. Other Gram Panchayats such as Naxalbari, Bidhannagar-I, Bidhannagar-II, and shows good Agricultural productivity index, due to the presence of thick layer of top soil, adequate water supply, sufficient rainfall, whereas Hatighisa, Upper Bagdogra, Raniganj-Panisali, Lower Bagdogra, Moniram, Binnabari, Jalas- Nizamtara has low API.
Soil Survey assessment is a tool for assessing, managing, and causing changes in the soil and connects present resource issues to sustainable land use for the environmental practices& soil survey evaluation, which is then utilized to examine the consequences of management on the soil7.In order to create a logical land utilization plan for agriculture, forestry, irrigation, drainage, etc., it is essential to have an in-depth understanding of the various soil types and their geographic distribution8.Soil survey provides a comprehensive and scientific knowledge of various soil types, their kind, nature, and area of distribution so that predictions about their characteristics and potentialities can be made9. It also offers sufficient details about the terrain, terraces, and vegetation10.
The development of GIS technology and its enormous potential for enhancing soil statistics has created new opportunities to achieve this goal because it provides an expedited, repeated, spatial, and temporal synoptic perspective.GIS is a type of computer software that is used to manage huge amounts of data and can help with spatial statistical analysis11.The implementation of such programmes that allow academics and decision-makers to gain access of the enormous amount of data and maps which may be used efficiently by using techniques of collection, storage, and conventional or traditional analysis may be challenging in the absence of rules12.Therefore, it is important to prepare rules in geographic information which will help to aid in accounting and also help in the analysis of accomplishments and maintenance plans, it is now crucial to use systems like GIS. Using GIS instead of more traditional approaches plans and processes for data collecting and analysis can be developed instantaneously.
Study Area
The study has been conducted in a ‘Terai’ region of Darjeeling district. 'Terai' is the name for the southerly sloping area in the Himalayan foothills. There are swamps and pebbles almost everywhere. In Siliguri Sub-Division, there are four CD block viz. Kharibari, Matigara, Naxalbari, Phansidewa and, including a small section of Siliguri Municipal Corporation which is included in the Siliguri Sub-Division. The study area extends between 26o27’16” N to 26o57’39” N of latitude and 88o07’12” E and 88o31’23” E of longitude. The study area has an area of 802.10 km2. The average elevation of Siliguri Sub-Division is 122 mts above the mean sea level. The region is surrounded on the east by the Jalpaiguri district, on the north by the Kurseong & Mirik of the Darjeeling district, which is in the south by the Uttar Dinajpur district, and in the west by Nepal and Bangladesh to a lesser extent.
The Darjeeling Himalaya's southern foothill region includes the Siliguri subdivision. The major portion of the research area is formed of especially incoherent materials which were obtained from the great mighty Himalayas and transported sloping downward by the rivers which developed within these mountains, given that this region is enclosed by the steep slopes of the lower Himalayas of the north and the relatively mild alluvium present in the south.13, 14, 15. Average altitude is, accordingly, 840 m to 69 m above mean sea level when measured from the north to south. Along the north-east to south-west orientations make up the area's general slope.
The main rivers of North Bengal are distinguished by drainage inversion, which occurs when a converging of drainage system within the hills changes to a diverging drainage of the system towards the plains. Significant alterations have also occurred in the gradient of their lengthy profiles16. The majority of the rivers are substantial. The rivers that run through this region frequently produce braided channels. The Mahananda river system and the Tista river system are the two river systems that flow through North Bengal. The Tista, flows through the eastern boarder of the study area, and enters Bangladesh and finally empties into the Brahmaputra (called Jamunna in Bangladesh). In north-eastern India, tea is grown in the Terai region. The tea gardens are mainly located between the river Mechi, old Balasan River, and Mahananda River in this area. The soil in the study area is mostly porous, slightly coarse in texture, very acidic, with moderate organic matter, low phosphorus, potassium, and micronutrient levels. The soil is made up of rocks and gravels of varying sizes, as well as sands of various sizes, and humus 17. The sediments brought down by rivers from Northern hilly region and are deposited over the plain in south. Therefore, the parent material of the entire plain part of the study area is loose alluvium. The upper part of this loose alluvium has transformed into soil through the pedogenic processes18. The greater part of the region is covered with alluvial soils.
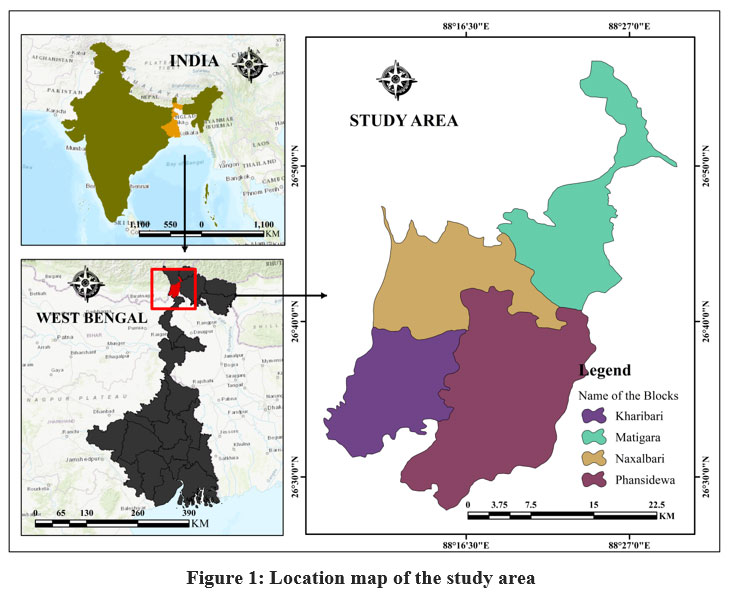 | Figure 1: Location map of the study area
|
The Data sources and the Methodology
This work has been conducted in the four blocks of Siliguri Sub-Division present in Darjeeling District of the West Bengal, India. At first a pilot survey was conducted by the researchers in the entire Sub-Division. Then, all the four blocks were divided into grid square of 4km * 4km in length and breadth. About 50 square grids were chosen by the researcher which falls almost entirely within the boundary of Siliguri Sub-Division. The sample soils were collected and gathered from the suitable site of each grid and the coordinates were noted. Collected sample soils were air dried and made ready for test. The soils were tested by the researcher in the soil Laboratory19.Soil pH was tested with the help of Digital Soil pH meter, soil organic carbon was tested by the process of Walkley-Black Rapid Titration Method. Soil Potassium, soil Nitrogen and soil Phosphorus was tested by Soil Kit Box analysis and Sulphur estimation in the soil was done by Turbidimetric method. The tabulated data was arranged in the MS- excel and converted into point data in the ArcGis software. Finally, the Spatial Zonation maps of all the selected parameters have been prepared by using IDW techniques in Spatial Analysis Tool in ArcGis Software 20. The spatial resolution of all maps of chemical properties is 30 m * 30 m. The final spatial maps help to identify the current status of the soil properties in the study area. These maps were later analysed by the researcher for better agricultural management, sustainable development and land useplanning21, 22.
In this study, the M. Shafi’s technique (1984) is used to calculate agricultural productivity. Seven major crops—rice, wheat, jute, maskalai, Til, mustard, and potato—were chosen for the study. When taking into account all cropping seasons, these crops take up over 65.40 percent of the total land that is cultivated. Shafi's method sums up the entire yield of every crop grown in a block divided by the total area planted with those crops in a block. The position thus obtained is then compared to the sum of the total yield of all the crops taken into consideration at the district level divided by the total area planted with those crops.
The algorithm of M. Shafi is:
Pi = (y1/t + y2/t + y3/t …..…): (Y1/T + Y2/T +Y3/T……) ……………… (Eq. 1)
Where,
Pi=Productivity Index
y= Yield of 1 to nth crops at block level
t= Area under crops 1 to nth at block level
Y= Yield of the 1 to nth crops at district level
T= The total area of crops 1 to nth at the district level
Results and discursions
Soil pH
Soil pH is regarded as a key variable to determine the alkalinity or acidity of the soil. A pH reading is actually a measurement of hydrogen ion concentration23. The availability of vital nutrients to plants is modulated by soil pH. The solubility of several nutrients varies depending on the pH. The pH extremes could result in toxicities or nutritional deficiencies, which will have an impact on crop development and yield. The pH in the soil affects the composition and activity of soil microorganisms. Many beneficial soil microbes, including bacteria and fungi, have specific pH preferences. Changes in pH can alter the microbial community structure, affecting nutrient cycling, organic matter decomposition, and disease suppression. Maintaining an optimal pH range supports a diverse and healthy microbial population, which contributes to nutrient availability and overall soil fertility. When choosing crops for a location, the pH of the soil is an essential consideration to take into account. Different crops have specific pH preferences for optimal growth. Acid-loving plants like blueberries and rhododendrons thrive in acidic soils, while alkaline soils may be suitable for crops like asparagus or melons. Matching crop choices to the soil pH of the agricultural land can enhance productivity and reduce the need for extensive soil amendments24. The pH of the soil affects how much of the nutrients and other substances dissolve in the water in the soil and are thus available to plants. A strongly alkaline atmosphere makes it simpler for some nutrients to be absorbed, while an acidic one makes it better for others25.
The soil in the research area has a pH that is acidic in nature, it ranges between pH 4.57 to 6.09. The north eastern mountainous region of Matigara Block has the lowest soil pH of 4.57 which is highly acidic in nature and the pH level increases as we move down towards the south. A total of 191.27 km2 of area has very low pH level that is about 25.44 % of the study area. This region located at the foot hill of Darjeeling Himalayas and mostly comprises of large tea estates. The soil is porous and contains coarse sand and very little percentage of silt and clay which make it fall under the loamy sand category in Soil Texture Triangle chart. The northern regions of Naxalbari Block havelow pH level of 4.78 which comprises of 137.37 km2 area which is 18.28 % of the total area. The southern region the pH ranges between 5.18 and 5.48, and the total area in this category is highest with 244.91 km2 that is 32.60 % of the total area. The entire Kharibari block has pH value ranging between 5.18 and 5.48 comprising of area 99.13 km2 and it is 13.20 % of the total area. In Phansidewa Block there is a variation of soil pH found, in the northern region the pH is between 4.87 to 5.18. The pH level increase as we move towards the south, it is between 5.18 to 4.48, further south the pH ranges between 5.48 and 5.79 and in the extreme south it has a highest pH of 6.1. Some portion of Phansidewa block and Kharibari block comprises of large Tea Estates while other majority part of the land is comprised of agricultural land, total area comprising of 78.75 km2 which is 10.48% of the total area.
Soil Organic Carbon (SOC)
SOC is essential to agriculture, reducing climate change, and identifying sustainable food sources26. It is an organic substance that can be found in soil that acts as a natural energy source and is highly desired by biopolymers27.SOC boosts soil's capacity to hold water while also improving the soil's chemical, biological, physical, and structural stability. It is crucial for the production of the organic acids in soil that are necessary for the dissolving of soil minerals, making them available to plants, and nutrient leaching28.SOC will prevent soils from abrupt pH alterations and create reserves of soil organic matter (SOM), which are essential for a variety of soil processes and ecosystem services29.SOC sequestration is an unambiguous method for enhancing soil health and quality, achieving food security, and reducing land use change30.
The above map of organic carbon portrays that 248.89 km2 of the study area has been found witha moderate organic carbon value ranging from 1.76% to 1.91%. Some regions in Matigara block and Naxalbari block has soil organic carbon ranging from 1.61% to 1.76% which comprises of the total area of 266.58 km2 that is about 35.52% of the total area. Southern region of the study area has a good proportion of soil organic carbon value ranging from 1.91% to 2.06% of total area is 111.99 km2 and 14.90 %. Some pockets of low soil organic carbon of 1.47% to 1.61% can be found in Matigara Block, Phansidewa Block andNaxalbariBlock which comprises of.5.34 km2 area and 0.71 % of the total area.
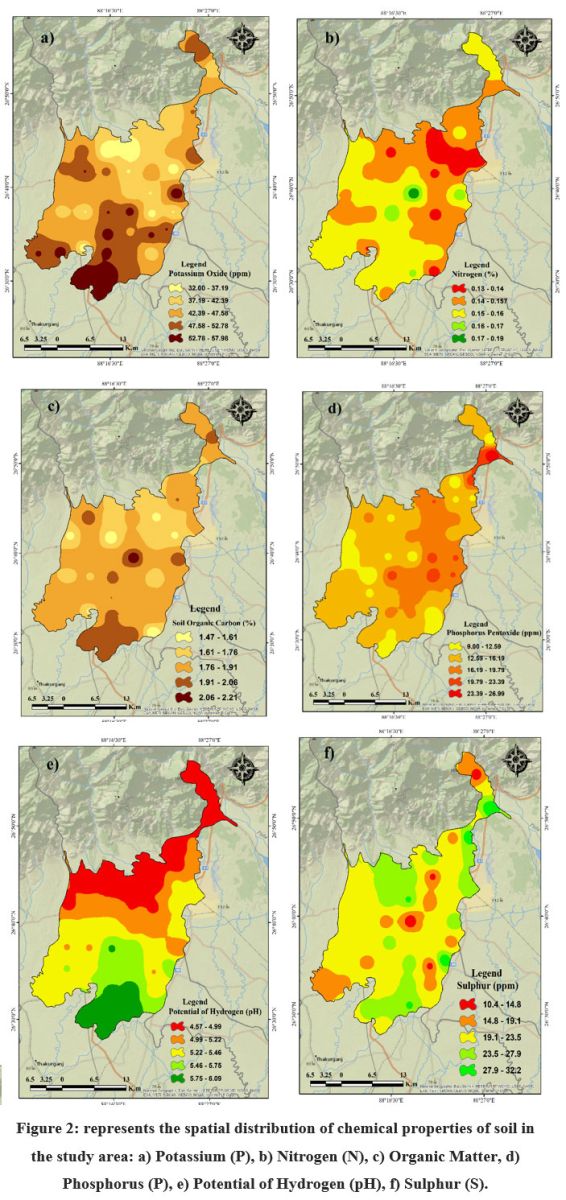 | Figure 2: represents the spatial distribution of chemical properties of soil in the study area: a) Potassium (P), b) Nitrogen (N), c) Organic Matter, d) Phosphorus (P), e) Potential of Hydrogen (pH), f) Sulphur (S).
|
Soil Nitrogen
Nitrogen is said to be the most common element present in the atmosphere and is necessary for life. Nitrogen is found in soils and plants in addition to being naturally present in both drinking water and air. It is essential for the development of plants, which makes it essential for the production of the food we eat.31. It is also vital for our survival. But like all things, balance is key, a lack of nitrogen hinders plant growth, which lowers agricultural production; Plants and the environment may both be at risk from too much nitrogen. Lack of nitrogen resulted in yellowing, reduced development, and smaller fruits and flowers for plants. Fertilisers with nitrogen can be applied to crops by farmers to increase crop growth. The loss of as much as one-third of the crops necessary for our food supply as well as other forms of agriculture is predicted by scientists to occur in the absence of nitrogen fertilisers32. However, we must be aware of the precise amount of nitrogen required for plant growth because excess nitrogen can contaminate streams and harm aquatic life33.
Major portion of the study area has Nitrogen content of 0.15% to 0.16% which is 41.33 % of the study area and comprises of 310.51 km2 area. Matigara block (except the mountainous region) have Nitrogen content of 0.14 to 0.157% and southern region of the Matigara block has low Nitrogen content of 0.13% to 0.14% respectively. It consists of the 14.2% of the study area and about 121.34 km2 of area comprise of 16.14% of the total land. And only 17.20 km2 that is 2.29 % of the land has very high amount of Nitrogen in the soil.
Soil Phosphorus
Soil phosphorus (P) is one of the essential nutrients for plant growth and is considered crucial for agricultural productivity. Phosphorus is a vital component of adenosine triphosphate (ATP), a molecule that stores and transfers energy within plant cells. ATP is involved in various metabolic processes, including photosynthesis, respiration, and the synthesis of proteins and nucleic acids. Adequate phosphorus availability in the soil ensures efficient energy transfer and storage, supporting plant growth and development. Adequate phosphorus levels in the soil are crucial during early plant growth stages, as they help establish a robust root system, improving plant establishment and nutrient acquisition capabilities. Phosphorus availability influences the nutritional composition and quality of crops. It contributes to the accumulation of essential compounds such as sugars, proteins, and vitamins. Adequate phosphorus levels in the soil promote the synthesis of these compounds, enhancing the nutritional value and quality of harvested crops. Additionally, immature plants and seedlings require it. Plant growth is hindered without phosphorus. Plants are wiry and stunted, with short roots. Other signs of a deficit include withering leaves, red pigment at the bases of leaves, and dull, greyish-green leaves. Phosphorus shortage is challenging to detect, and by the time it is, it might be too late to take action. When phosphorus is later added to plants that were starved of the mineral as seedlings, they might not recover. Phosphorus is a very stable element chemically34. As fertiliser phosphorus reacts with soil quickly, it does not spread far away from the application location. The pH of the soil rapidly bonds with both aluminium and iron when it drops below 5.0, rendering it inaccessible to plants.
Very high phosphorous content can be seen in the Matigara Block ranging from 23.39 to 26.99 ppm which covers about 2.25% of the land and has an area of 20.32 km2. Most of the region in the study area is covered with phosphorus ranging from 12.59ppm to 16.19ppm with an area of 344.07 km2 that comprises of 38.23% of the land. Some patches of low phosphorus can be found in Kharibari and Phansidewa block about 172.29 km2 of an area comprises of 19.14% of the total land. Moderate Phosphorous is found in most of the places in the study area covering 244.95 km2 and 27.12% of the land.
Soil Potassium
Potassium is considered as an essential element for plant development and reproduction. It deficiency makes plants less tolerant to heat, drought, and excess water35. Additionally, they have lower resistance to worm assaults, illnesses, and pest infestations. Potassium is referred to as the "quality" nutrient since it enhances the general health of developing plants and aids in their defence against illness, Soil Survey (Staff, 1983).Potassium is essential for healthy plant growth. In reality, most of the crops that contain more amount of potassium other than any other nutrient, that includes nitrogen (N), at all stages of growth. While significantly higher amounts of potassium are incorporated to regulate the water interactions in the plant, smaller amounts are required to maintain many of the essential enzyme functions within the plant. Additionally, potassium is necessary for the transfer of sugars and other photosynthetic by-products which transfer from leaves to the storage organs. In order for a crop to produce its maximum amount of yield, adequate potassium levels are necessary. Additionally, it has significant effects on a wide range of other quality variables, such as grain shape as well as colour, size of the tuber, oil content, the amount of dry matter & starch content, sugar content, fruit ripeness, and quality36.
Therefore, it is hardly unexpected that crops suffer substantially in difficult growing seasons when they lack plant-available potash. Weaker, less vigorous crops are the result. Potash may not have much of an impact during favourable growth conditions, especially for crops like cereals, but during challenging years, it will significantly contribute to the highest yields possible. In order to protect against unfavourable conditions during challenging growing seasons, adequate potassium is consequently a form of "insurance”. Different plants absorb potassium at different times. But compared to nitrogen and phosphorus, potassium is often absorbed by plants at an earlier stage of growth36.
A very high potassium content can be seen in the southern region of Phansidewa block whose value ranging from 52.78 to 57.98 ppm covering 147.71 km2 of an area and covers 19.56% of the study area. Low Potassium can be found in Naxalbari Bock and Matigara block of 81.99 km2 area and 10.91% of the total land. Moderate potassium is mostly found in Kharibari Block and western part of Naxalbari block of area181.97 km2 and 24.21% of land. Moderately high potassium is found in Phansidewa Block ranging between 47.58 to 52.78 ppm covering an area of 191.43km2 and 25.47% of the land.
Soil Sulphur
Soil sulphur (S) is a crucial nutrient component for soil fertility & plant development. Amino acids, which serve as the foundation for proteins, must contain sulphur37. In the synthesis of enzymes, the organisation of cells, and the transfer of nutrients, proteins are essential to the growth and development of plants. A variety of physiological processes in plants are supported by the presence of sulphur in the soil, which ensures protein synthesis. Sulphur influences how well plants absorb and use nutrients. It contributes to the production of the vitamins, enzymes, & coenzymes necessary for nutrition metabolism. Because it helps plants use nitrogen more effectively, sulphur is particularly crucial for nitrogen metabolism. A balanced plant's nutrition is supported by adequate sulphur availability, which promotes effective nutrient uptake and utilisation. Compounds that support plant defence mechanisms are produced using sulphur. It participates in the production of secondary metabolites with sulphur, like phytoalexins and glucosinolates, which support plants' defences against pathogens, stresses, and pests. Due to weakened defences caused by sulphur deficiency, plants are more vulnerable to biotic and abiotic stressors. Due to sulphate in the form of sulphur leaching underneath the plant's root zones in grazing plants during rainy years, a sulphur deficit can significantly impair output in meadows with sandy soils. Sulphur is prevalent in almost all soils in varying amounts38. Because of the original parent rock's nature, clay and gravel soils typically contain more sulphur. More organic sulphur, which gets mineralized into sulphate sulphur that is available to plants, is found in soils that contain a lot of clay and gravel. Higher rainfall regions with sandier soils are unable to stop the leaching of water-soluble sulphate sulphur. Symptoms of sulphur deficiency in cereals frequently match those of nitrogen deficit, including pale green or yellow leaves. Examine the plant in detail to identify the source of the deficit. In contrast to nitrogen shortage, which affects the oldest leaves, sulphur deficiency causes the youngest leaves of plants to turn yellow39.
Very small patches of high sulphur ranging between 10.4 to 14.8 ppm is found in the mountainous region of Matigara block and in the western Phansidewa Block with total area of 64.54 km2 and only 8.51% of the total land. Moderately low sulphur is found in Naxalbari block ranging between 14.8 to 19.1 ppm covering 24.30 % with total area of 180.09 km2. Moderate sulphur is found in almost all the whole blocks ranging between 19.1 to 23.5 ppm covering an area of 300.6 km2 and 39.72 % land. Moderately high sulphur is found in northern Naxalbari block total area of 177.11 km2 covering 23.59 % land. And very low sulphur is found in a small patch in Champasari region of Matigara Block with 29.05 km2 area and 3.86 % of land.
Table 1: Spatial distribution of soil properties in Siliguri Sub-division.
Soil properties | Class | Area in sq./km | Area in % |
Soil pH | 4.57 – 4.99 | 191.27 | 25.45 |
4.99 – 5.22 | 137.36 | 18.28 | |
5.22 – 5.46 | 244.90 | 32.59 | |
5.46 – 5.75 | 99.13 | 13.19 | |
5.75 – 6.09 | 78.75 | 10.48 | |
Soil Organic Carbon (%) | 1.47 – 1.61 | 118.34 | 15.74 |
1.61 – 1.76 | 266.85 | 35.51 | |
1.76 – 1.91 | 148.39 | 33.12 | |
1.91 – 2.06 | 111.99 | 14.90 | |
2.06 – 2.21 | 5.32 | 0.71 | |
Soil Nitrogen (%) | 0.13 – 0.14 | 106.72 | 14.20 |
0.14 – 0.15 | 195.64 | 26.04 | |
0.15 – 0.16 | 310.54 | 41.32 | |
0.16 – 0.17 | 121.34 | 16.15 | |
0.17 – 0.19 | 17.20 | 2.30 | |
Soil Phosphorus (ppm) | 9.00 – 12.59 | 172.29 | 19.14 |
12.59 – 16.69 | 344.07 | 38.23 | |
16.69 – 19.79 | 244.95 | 27.21 | |
19.79 – 23.39 | 118.35 | 13.15 | |
23.39 – 26.99 | 20.32 | 2.26 | |
Soil Potassium (ppm) | 32.00 – 37.19 | 81.99 | 10.91 |
37.19 – 42.39 | 148.31 | 19.73 | |
42.39 – 47.58 | 181.97 | 24.21 | |
47.58 – 52.78 | 191.43 | 25.47 | |
52.78 – 57.98 | 147.71 | 19.65 | |
Soil Sulphur (ppm) | 10.4 – 14.8 | 64.54 | 8.51 |
14.8 – 19.1 | 180.09 | 24.30 | |
19.1 – 23.5 | 300.61 | 39.72 | |
23.5 – 27.9 | 177.11 | 23.59 | |
27.9 – 32.2 | 29.05 | 3.86 |
Impacts of soil properties on agricultural productivity
The main crop farmed across the Sub-Division is rice.Rice is cultivated mostly during the monsoon season. All the three types of rice Aus, Aman, Boro are grown here, but the dominant one is Aman which is sown in the rainy season especially in the month of June - July and harvested during the winter season. Boro rice is grown in the northern region of the study area especially in the Hatighisa, Upper Bagdogora and Panighata region. Rice production in Raniganj-Panisali is highest which is 8112 kg/hec and Matigara II is lowest which is 4147 kg/hec. This is mainly due to the water holding capacity of the soil and soil pH level which suits the Buraganj, Kharibari-Panisali and Raniganj-Panisali region where rice is grown abundantly. Wheat is dominant in Atharakhai, Patharghata, Matigara-II, Lower Bagdogra, Hatighisa and Raniganj-Panishali regions.Wheat is a winter crop that needs irrigation, has been extensively supported in these areas. It is mainly sown in the month of November and harvested during the month of March. This is possible because these areas have loamy texture of soil, good structure and moderate water holding capacity, the soil present in this region has adequate proportion of sand, silt and clay to grow wheat. Raniganj-Panisali dominates with highest production of wheat which is 2011 kg/hec. Maskalai is grown in Patharghata, Binnabari, Atharakhi, Phansidewa-Bansgaon Kismat, Hatighisa, Naxalbari, regions. The production is notso high as wheat and rice, Patharghata is the highest producer of Maskalai in the Sub-Division, with 783 kg/hec along with Binnabari, Buraganj, Kharibari-Panisali and Raniganj-Panisali where Maskalai is being cultivated in recent times.
Mustard is grown extensively in Chathat-Bansgaon Kismat, Jalas- Nizamtara, HetmuriSinghijhora, Phansidewa-Bansgaon Kismat regions. Chathat-Bansgaon Kismat region is the highest producer of mustard with 1144 kg/hec. and Matigara I, Matigara II, and Champasari region does not grow mustard at all. Since the study areacomprises of well drained sandy loam with pH 6.0 hence mustard thrives well here.Til is grown in some of the regions only, Naxalbari, Binnabari, Buraganj, Kharibari-Panisali, Raniganj-Panisali region.Phansidewa-Bansgaon Kismat in the highest producer of Til with 630 kg/hec and Atharakhai, Matigara I, Matigara II, Patharghata, Champasari does not grow til at all. Due to the available irrigation facilities, well drained light to medium textured soil make it favourable to grow Til. Potato is cultivated extensively all over the Sub-Division, it is mainly sown in the month of December or January as a Rabi crop. The ideal period to plant is during the times when the maximum and minimum temperatures, respectively, range from 30°C to 32°C and 18°C to 20°C.Potato is widely grown in Chathat-Bansgaon Kismat, Ghoshpukur, Jalas- NizamtaraBidhannagar-Ii, Phansidewa-Bansgaon Kismat, HetmuriSinghijhora. The highest producer of potato is HetmuriSinghijhora with 29035 kg/hec. Jute is not grown so extensively, total jute cultivation amounts to only 216.07 kg/hec only among which HetmuriSinghijhora is the highest producer of jute in the Sub-Division with 11.35 kg/hec production, and Champasari with lowest jute production. Due to the presence of fertile alluvial soil and sandy loamy soil cultivation of jute is possible here.
Table 2: Gram panchayat wise crop productivity ( kg/hectare) in Siliguri Sub-division.
Gram Panchayat | Rice | Wheat | Maskalai | Mustard | Til | Potato | Jute |
Atharakhai | 4322 | 1776 | 763 | 657 | 0 | 21679 | 9.98 |
Matigara- I | 4178 | 1770 | 750 | 0 | 0 | 21680 | 9.1 |
Matigara -Ii | 4147 | 1767 | 752 | 0 | 0 | 20147 | 9.3 |
Patharghata | 4240 | 1841 | 783 | 655 | 0 | 21679 | 9.98 |
Champasari | 4068 | 1677 | 730 | 0 | 0 | 20412 | 9 |
Gossaipur | 6810 | 1921 | 763 | 511 | 600 | 22922 | 10.22 |
Hatighisa | 6701 | 1923 | 766 | 501 | 600 | 21456 | 9.18 |
Lower Bagdogra | 6879 | 1901 | 722 | 511 | 0 | 21324 | 9.01 |
Naxalbari | 6844 | 2014 | 775 | 651 | 612 | 22922 | 10.22 |
Moniram | 6595 | 1966 | 736 | 602 | 601 | 22932 | 10.21 |
Binnabari | 7982 | 1818 | 765 | 492 | 601 | 27485 | 8.64 |
Buraganj | 8056 | 1820 | 763 | 496 | 605 | 27549 | 7.6 |
Kharibari-Panisali | 8101 | 1966 | 752 | 499 | 600 | 28141 | 8.64 |
Upper Bagdogra | 6735 | 1896 | 712 | 515 | 0 | 21414 | 9.1 |
Raniganj-Panisali | 8112 | 2011 | 745 | 488 | 599 | 28150 | 8.78 |
Bidhannagar-I | 7321 | 1611 | 741 | 951 | 0 | 28698 | 10.96 |
Chathat-Bansgaon Kismat | 7570 | 1678 | 767 | 1144 | 611 | 29032 | 11.31 |
Ghoshpukur | 7012 | 1555 | 766 | 1021 | 587 | 28794 | 10.91 |
Jalas- Nizamtara | 7278 | 1780 | 763 | 1071 | 602 | 29032 | 11.02 |
Bidhannagar-Ii | 7205 | 1601 | 745 | 966 | 0 | 28965 | 10.25 |
Phansidewa-Bansgaon Kismat | 7654 | 1790 | 763 | 1071 | 630 | 29032 | 11.31 |
Hetmurisinghijhora | 7352 | 1720 | 760 | 1076 | 0 | 29035 | 11.35 |
Source: Office of Assistant Director of Agriculture (2016-2017), Kharibari-Phansidewa block and Matigara- Naxalbari block.
 | Figure 3: GP wise crop production in Siliguri Sub-division in the period of 2016-2017
|
Table 3: Average API OF 7 crop productions in Siliguri Sub-division
SL no | GP | Average API of 7 Crops |
1 | Atharakhai | 1.08 |
2 | Matigara- I | 1.0 |
3 | Matigara -II | 1.10 |
4 | Patharghata | 0.92 |
5 | Champasari | 0.96 |
6 | Gossaipur | 1.31 |
7 | Hatighisa | 0.81 |
8 | Lower Bagdogra | 0.98 |
9 | Upper Bagdogra | 0.83 |
10 | Naxalbari | 1.16 |
11 | Moniram | 0.88 |
12 | Binnabari | 0.96 |
13 | Buraganj | 1.26 |
14 | Kharibari-Panisali | 1.19 |
15 | Raniganj-Panisali | 0.94 |
16 | Bidhannagar-I | 1.18 |
17 | Chathat-Bansgaon Kismat | 1.07 |
18 | Ghoshpukur | 1.29 |
19 | Jalas- Nizamtara | 0.92 |
20 | Bidhannagar-II | 1.23 |
21 | Phansidewa-Bansgaon Kismat | 1.07 |
22 | Hetmuri Singhijhora | 1.18 |
Computed by authors using eq. 1 formula | ||
Descriptive statistics
The elaborative qualities of soil parameters were shown in table 2. The most significant characteristics of soil are its pH, which has a mean value of 5.27, the median value is 5.26 and the modal class value of 5.1 respectively in the top layers of the soil in the study area. The average organic carbon present in the soil is 1.81%, it has a median value of 1.83 and modal value of 1.88. The SD value is 0.14. Nitrogen is very important for the growth of crops and the study area have relatively good amount of Nitrogen with mean Nitrogen of 0.157 ppm, median value is also 0.157 ppm and mode of 0.162. The SD value is 0.01. The study area has an average Potassium of 47.72 ppm and median value of Potassium is 46.5 ppm and the modal class is 53. The mean value of Phosphorus present in the soil of the study area is 15.42 ppm and the median value as well as the modal value is 15 ppm, with SD value 3.98. Sulphur is another essential element of soil; it has a mean of 22.25 ppm in the soil of the study area. The median value is 22.9 and the modal value is also 22.9. The SD value is 4.94.
Table 4: represents the descriptive statistics in Siliguri Sub-division (n = 50).
Descriptive Statistics | Soil pH | Organic Carbon (%) | N (ppm) | K (ppm) | P (ppm) | S (ppm) |
Mean | 5.2752 | 1.81 | 0.157 | 47.72 | 15.42 | 22.25 |
Median | 5.265 | 1.83 | 0.157 | 46.5 | 15 | 22.9 |
Mode | 5.10 | 1.88 | 0.162 | 53 | 15 | 22.9 |
SD | 0.39 | 0.142 | 0.01 | 16.49 | 3.98 | 4.94 |
Kurt. | -0.45 | 0.43 | 0.96 | 31.00 | 0.13 | -0.01 |
Skew. | 0.42 | -0.01 | 0.57 | 4.97 | 0.55 | -0.15 |
Min. | 4.57 | 1.47 | 0.136 | 32 | 9.00 | 10.40 |
Max. | 6.10 | 2.22 | 0.191 | 150 | 27.0 | 32.30 |
Conclusion
For soil protection and environmental modelling, it is crucial to understand geographical distribution and accurately mapping of soil properties at a large scale. To prepare the spatial distribution mapping of chemical soil properties in Siliguri sub-division, authors have been selected six parameters such as soil pH, soil Nitrogen, soil organic carbon, soil sulphur, soil potassium, and soil phosphorus. The study area comprises total four blocks viz. Khoribari, Naxalbari, Pansidewa and Matigara blocks. The aforementioned figures indicate that the soil in the two blocks viz. Phansidewa and Kharibari are very suitable for farming whereas the soil in the Naxalbari block is only moderately suitable for cultivation. In contrast, some of Matigara block's mountainous terrain is unsuitable for farming. Agriculture is practised in a few locations in the southern region of the Matigara block. If proper fertilizers are added and sufficient irrigation facilities is provided, then the two blocks of Matigara and Naxalbari will be made very productive. This works will be helpful to the policymakers and decision taking authorities to take any kind of developmental plan regarding soil conservation and degradation in the Siliguri sub-division.
Acknowledgement
The authors are pleased to offer their heartfelt thanks and respect to everyone who helped this research work be completed successfully. Their invaluable support, guidance, and encouragement have been instrumental in shaping this work.
Firstly, and most importantly, we desire to express our gratitude to our supervisor, Dr. D.K. Mandal (Professor), for their unwavering support, expert guidance, and valuable insights throughout the research process.
We would like to acknowledge the support and resources provided by the Department of Geography and Applied Geography and the Department of Tea Science soil laboratory of the University of North Bengal. The access to the necessary facilities, equipment, and research materials has been vital in conducting the experiments and analyses required for this study. We are grateful for the opportunities provided by these institutions, which have greatly facilitated the progress and success of our research.
Furthermore, NBSS & LUP are gratefully acknowledged by the authors for providing the essential data for the research. We also thankful to the editor and reviewers for give their valuable suggestions to improve this work.
Conflict of Interest
The authors declare that they have no conflict of interests.
Funding Sources
There is no funding or financial support for this research work.
Reference
- Retallack, G. J. (2001). A 300-million-year record of atmospheric carbon dioxide from fossil plant cuticles. Nature, 411(6835), 287-290.
CrossRef - Tauqeer, H. M., Turan, V., Farhad, M., & Iqbal, M. (2022). Sustainable agriculture and plant production by virtue of biochar in the era of climate change. In Managing plant production under changing environment (pp. 21-42). Singapore: Springer Nature Singapore.
CrossRef - Younis MGA (1985) Emirates and Sudan investment CO.LTD Agricultural scheme, JubelAulia – Khartoum province, p.
- Biswas, T. D., & Mukherjee, S. K. (1994) Textbook of soil science. New Delhi: Tata McGraw-Hill Publishing Company Limited.
- Moore, G.A. (2001) Soil guide: a handbook for understanding and managing agricultural soils. Bulletin 4343.Perth, Western Australia: Department of Agriculture and Food.
CrossRef - Alexander, E.B. (1980) Bulk density of Californian soils in relation to other soil properties. Soil Science Society of America Journal 44:689–92.
CrossRef - Dent D., and Young, A., (1981) Soil Survey and Land Evaluation, Taylor & Francis Books Ltd, London, p. 78.
- Al-Atab, S. M. S. (2008) Variations of soil properties and classification in some area of Basrah Governorate (PhD Thesis). College of Agriculture, University of Basrah, Basrah.
- Bashtian, M. H., Gholamhosseinian, A., & Sepehr, A. (2022). Digital Soil Map: An Applied Tool to Determine Land-Use Alterations. In Soils in Urban Ecosystem (pp. 189-218). Singapore: Springer Singapore.
CrossRef - Brown G, Newman ACD, Rayner JH, Weir AH (1978) The structure and chemistry of soil clay minerals: in The Chemistry of Soil Constituents, D. J. Greenland and M. H. B. Hayes, eds., Wiley, New York, pp. 29- 178.
- Ohyma, T., Ito M., Kobayashi, K., Araki, S., Yasuyoshi, S., Sasaki, O., and Ikarashi, T. (1991) Analyticalprocedures of N, P, K contents in plant and manure materials using H2SO4-H2O2 Kjeldahl digestionmethod. Bull. Fac. Agric. Niigata Univ., 43, 111-120.
- Doran, J.W. and Zeiss, M.R. (2000) Soil health and sustainability; managing the biotic component of soil quality. Applied Soil 15: 2-11.
CrossRef - Young, M. H, T. G. Caldwell, D. G. Meadows, and L. F. Fenstermaker, (2009) Variability of soil physical and hydraulic properties at the Mojave Global Change Facility, Nevada: Implications for water budget and evapotranspiration,” J. Arid Environ., vol. 73, no. 8, pp. 733–744.
CrossRef - Mitra, R. and Roy, D., (2022) Delineation of groundwater potential zones through the integration of remote sensing, geographic information system, and multi-criteria decision-making technique in the sub-Himalayan foothills region, India. International Journal of Energy and Water Resources, pp.1-21.
CrossRef - Roy, D., Das, S. and Mitra, R., (2022) An application of geospatial-based multi-criteria decision-making technique to identify landslide susceptibility zones in the Ragnu Khola River Basin of Darjeeling Himalayan region, India. Applied Geomatics, 14(4), pp.731-749
CrossRef - Jenny H (1941) Factors of Soil Formation, a System of Quantitative Pedology. McGraw Hill, New York, N.Y.
CrossRef - O’Malley, LSS, 1907 Bengal District Gazetteers, Darjeeling District, The Bengal Secretariat Book Depot, Kolkata, pp. 1-71.
- Emerson, W. W. (1967). A classification of soil aggregates based on their coherence in water. Soil Research, 5(1), 47-57.
CrossRef - Singha, C., (2018) Spatio temporal change of agricultural land use pattern in Siliguri subdivision, Darjeeling District: A Geographical analysis, (Doctoral Thesis), Geography & Applied Geography, University of North Bengal, Darjeeling. pp. 1-8.
- Batjes, N. H. (2009) Harmonized soil profile data for applications at global and continental scales: Updates to the WISE database.” Soil Use and Management 25 (2):124–27.
CrossRef - Klingbiel A.A., & Montgomery P.H., (1961) Land Capability Classification, Soil Conservation Service, United States Department of Agriculture, U.S. Government Printing Office, Washington 25. DC, pp. 6-12.
- U.S.D.A., (2014) Soil Survey Field and Laboratory Methods Manual, Soil Survey Investigation Report No. 51, Version 2.0, (edited by Rebecca Burt), Kellogg Soil Survey Laboratory, National Soil Survey Centre, Natural Resources Conservation Service, U.S. Department of Agriculture, Lincoln, Nebraska.
- Singh KK, Colvin TS, Erbach DC, Mughal AQ (1992) Tilth index: An approach to quantifying soil tilth. Trans. ASAE. 35:1777-1785.
CrossRef - Vasu, D, Singh, S. K. N. Sahu, P. Tiwary, P. Chandran, V. P. Duraisami, V. Ramamurthy, M.
- Arakeri, H.R. and Donahue, Roy (1984). Principles of Soil Conservation and Water Management, Oxford & IBH Publishing Co., New Delhi, India, First Edition, p. 223.
- Wang, P.; Wang, J.; Zhang, H.; Dong, Y.; Zhang, Y. (2019) The role of iron oxides in the preservation of soil organic matter under long-term fertilization. J. Soils Sediments, 19, 588–598.
CrossRef - Black, C. A. (1965) Methods of soil analysis. Agronomy No. 9, Part 2. Madison, WI: American Society of Agronomy.
CrossRef - Lal, R. (2020) Soil organic matter content and crop yield. J. Soil Water Conserv. 75, 27A–32A.Lalitha, and B. Kalaiselvi (2017) Assessment of spatial variability of soil properties using geospatial techniques for farm level nutrient management,” Soil Tillage Res., vol. 169, pp. 25–34.
CrossRef - Adams, W. A. (1973) The effect of organic matter on the bulk and true density of some uncultivated podzolic soils. Journal of Soil Science 24:10–17.
CrossRef - Maltas, A.; Kebli, H.; Oberholzer, H.R.; Weisskopf, P.; Sinaj, S.(2018) The effects of organic and mineral fertilizers on carbon sequestration, soil properties, and crop yields from a long-term field experiment under a Swiss conventional farming system. Land Degrad. Dev. 29, 926–938.
CrossRef - Maltas, A.; Kebli, H.; Oberholzer, H.R.; Weisskopf, P.; Sinaj, S.(2018) The effects of organic and mineral fertilizers on carbon sequestration, soil properties, and crop yields from a long-term field experiment under a Swiss conventional farming system. Land Degrad. Dev. 29, 926–938.
CrossRef - Ba?tabak, B.; Koçar, G. (2020) A review of the biogas digestate in agricultural framework. J. Mater. Cycles Waste Manag, 22, 1318–1327.
CrossRef - El Jamassi, A. (2013). Using geographic information systems (GIS) in soil classification and analysis in Gaza City, Palestine. Environment and natural resources research, 3(2), 146.
CrossRef - Cambardella, C. A., &Karlen, D. L. (1999) Spatial analysis of soil fertility parameters. Precision Agriculture, 1, 5–14.
CrossRef - Naikwade, P.V. (2019) Soil Organic Carbon Sequestration by Long-Term Application of Manures Prepared fromTrianthemaportulacastrurm Linn. Commun. Soil Sci. Plant Anal, 50, 2579–2592.
CrossRef - Zhao, X., Shi, L., Chang, S., Zhang, C., Yan, S., Du, W., ... & Hou, F. (2022). Multi-cutting and sheep excrement influence plant growth and soil nitrogen mineralization in sown grassland. Plant and Soil, 478(1-2), 533-544.
CrossRef - Havlin, J.L., (2007) Soil Fertility and Fertilizers. An introduction to nutrient management, Dorling Kindersley (India) Pvt. Ltd., New Delhi, India, First Edition, p. 21.
- Yeasmin, M., Lamb, D., Choppala, G., & Rahman, M. M. (2022). Impact of Sulfur on Biofortification and Speciation of Selenium in Wheat Grain Grown in Selenium-Deficient Soils. Journal of Soil Science and Plant Nutrition, 22(3), 3243-3253.
CrossRef - Avetisyan D, Borisova B, Nedkov R (2016) Determination of the Landscapes Regulation Capacity and Their Role in the Prevention of Catastrophic Events: A Case Study from the Lom River Upper Valley, Bulgaria. Sustainable Mountain Regions: Challenges and Perspectives in Southeastern Europe.
CrossRef


