Tree Structure Analysis, Biomass and Carbon Stock of Sal Forests in Central Himalayan Region
Falak Siddiqui
*
 and L. S. Lodhiyal
1
Department of Forestry and Environmental Science,
DSB Campus,
Kumaun University, Nainital,
Uttarakhand
India
http://dx.doi.org/10.12944/CWE.18.1.10
Copy the following to cite this article:
Siddiqui F, Lodhiyal L. S. Tree Structure Analysis, Biomass and Carbon Stock of Sal Forests in Central Himalayan Region. Curr World Environ 2023;18(1). DOI:http://dx.doi.org/10.12944/CWE.18.1.10
Copy the following to cite this URL:
Siddiqui F, Lodhiyal L. S. Tree Structure Analysis, Biomass and Carbon Stock of Sal Forests in Central Himalayan Region. Curr World Environ 2023;18(1).
Download article (pdf)
Citation Manager
Publish History

Introduction
Forest plays a significant role in biomass production and carbon sequestration. Apart from these, they supply a wide range of goods and services including timber, fuelwood and fodder. Forests are foundation of biodiversity and also mitigate the climate change by sequestering carbon dioxide in atmosphere. Present study of Sal (Shorea robusta Gaertn f.) forests covered a large area in foothills of Shiwalik in Kumaun region of Central Himalaya. Recent growing anthropogenic pressure on Sal forest for different uses like timber, fodder, fuelwood and leaflitter it is very imperative to assess the real time data about the stand structure, dry matter and carbon storage in such forest which are closed to human habitation. However, a few studies on sal forests particularly on biomass and Net Primary Production (NPP) were made by various researchers1-5, but there is scarcity of datarelated to carbon and its storage capacity in this region. It is assumed that the carbon percent in biomass ranged from 45 to 50 percent6-7. In this context, stand structure of Sal forest is very important in controlling the various aspects of dry weight, production and carbon potential growing in the region so that the sal forest could be managed and conserved for their full potential of biomass, productivity and carbon. This study aims to analyze the stand composition, biomass and carbon stock of Sal forest in Kumaun region of Central Himalaya.
Methodology
Description of study site
This study was performed to evaluate the vegetation structure, biomass and carbon stock in sal forest sites located in Tanakpur (29.0748940 N lat. and 80.10830180 E long) of Champawat district, Uttarakhand, India. The sal forest sites were located between 250-358 m elevation. On the basis of canopy cover sal forest sites were categorized into dense (Site-1), moderate (Site-2) and open forest (Site-3).The canopy cover of sal forest was 60-70% for dense forest, 50-55% for moderate forest and 25-40% for open forest.
Methods
Quadrat method (10 x10m size.) was used for the assessment of tree species. In each site, 30 quadrats were randomly placed and circumference of trees was considered at breast height i.e. 1.37 m from the ground level. In each study sites, vegetational parameters were estimated as followed8. Species diversity of vegetation was evaluated by using Shannon-Weiner information index9. Simpson Index10 was used to calculate concentration of dominance (Cd). Biomass of tree components i.e. bole, branch, twig and leaves was estimated by using allometric equation developed by various scientists2,11. Carbon was estimated by using the given factor7. The carbon (C) was estimated by using biomass value of component of forest multiplied by 0.475 factor. In each site, total carbon of forest was anticipated by adding carbon values of all tree components. Statistical analysis i.e. Pearson’s correlation test was performed using SPSS Software Version 21.0.
Results
Vegetation analysis
Site-1
Total nine trees were found in this site. Tree density was 690 indiv.ha-1.Of this, S. robusta (370 indiv.ha-1) followed by Syzygium cumini (80 indiv.ha-1), Haldina cordifolia (70 indiv.ha-1), Terminalia bellerica (40 indiv.ha-1) and Terminalia tomentosa (30 indiv.ha-1). Total basal area was 78.8 m2ha-1. S. robusta (54.5) accounted maximum basal area followed by S.cumini (8.1m2ha-1), H. cordifolia (4.6 m2ha-1), T.bellerica (3.7m2ha-1) and T.tomentosa (2.9m2ha-1). The IVI of tree species ranged from 8 (Albizzia lebbeck) to 105 (S. robusta).Species diversity of trees range from 0.01 to 1.0 in the forest (Table 1).
Site-2
Total eight tree species were recorded in this site. Tree density was 510 indiv.ha-1.Of this, S. robusta (310 indiv.ha-1) followed by Mallotus philippensis (100 indiv.ha-1), S.cumini (30 indiv.ha-1) and Allianthus excelsa (20 indiv.ha-1). Total basal area was 75.3 m2ha1. S. robusta (62.7 m2ha-1) accounted maximum basal area followed by M.philippensis (4.7m2ha-1), S.cumini (2.4 m2ha-1) and A.excelsa (0.8 m2ha-1). The IVI ranged among tree from 12.4 (Trewia nudiflora) to 130 (S. robusta).The tree species diversity varied from 0.001 to 1.2 in the forest (Table 2).
Site-3
Total two tree species were found in this site. Tree density was 290 indiv.ha-1.Of this, S. robusta (220 indiv.ha-1) and T. grandis (70 indiv.ha-1). Total basal area was (50.9 m2ha-1). S. robusta (43 m2ha-1) accounted maximum basal area and IVI. The tree species diversity of S. robusta (1.9) and Tectona grandis (0.9) in the forest (Table 2).
Total fifteen tree species i.e. S. robusta Gaertn., S.cumini L. Skeels, H. cordifolia (Roxb.)Ridsdale., T.bellerica (Gaertn.) Roxb., T. tomentosa, Lannea parviflora, M.philippensis(Lam.) Muell.-Arg. , Lannea coromendelica (Houtt.) Merr., A.lebbeck, A.excelsa, Ficus hispida L., B. ceiba, Cassia fistulaL. , T.nudiflora, and T. grandis L.were reported in sal forests. Total tree density varied from 290 to 690 indiv. ha-1 across the all forest sites. Total basal area of trees ranged between 50.9 to 78.8m2ha-1. The species diversity for the trees ranged between 1.1-2.1 in the studied sal forest (Table 1).
Table 1: Phytosociological attribute (Density, TBA) in sal forests in the Tanakpur of district Champawat in Kumaun, Central Himalaya.
| Name of species | Site-1 | Site-2 | Site-3 | |||||||||
D (ind ha-1) | B A (m2 ha-1) | IVI | H- | D (ind ha-1) | B A (m2 ha-1) | IVI | H- | D (ind ha-1) | B A (m2 ha-1) | IVI | H- | |
| A.excelsa | 20 | 0.77 | 17.49 | 0.01 | - | - | - | - | ||||
| A. lebbeck | 20 | 0.33 | 8 | 0.003 | - | - | - | - | - | - | - | - |
| B. ceiba | - | - | - | - | 10 | 2.74 | 41.26 | 0.001 | - | - | - | - |
| C. fistula | - | - | - | - | 10 | 0.49 | 12.53 | 0.001 | - | - | - | - |
| F. hispida | - | - | - | - | 20 | 0.92 | 14.15 | 0.01 | - | - | - | - |
| H. cordifolia | 70 | 4.60 | 31 | 0.03 | - | - | - | - | - | - | - | - |
| L. parviflora | 30 | 1.60 | 18 | 0.01 | - | - | - | - | - | - | - | - |
| L.coromendelica | 20 | 2.12 | 24 | 0.003 | - | - | - | - | - | - | - | - |
| M. philippensis | 30 | 0.99 | 18 | 0.01 | 100 | 4.70 | 43.34 | 0.13 | - | - | - | - |
| S. robusta | 370 | 54.45 | 105 | 0.96 | 310 | 62.74 | 130 | 1.23 | 220 | 43 | 203 | 1.91 |
| S. cumini | 80 | 8.12 | 41 | 0.04 | 30 | 2.40 | 24.76 | 0.01 | - | - | - | - |
| T. grandis | - | - | - | - | - | - | - | - | 70 | 7.92 | 97 | 0.19 |
| T. bellerica | 40 | 3.74 | 28 | 0.01 | - | - | - | - | - | - | - | - |
| T. tomentosa | 30 | 2.90 | 27 | 0.01 | ||||||||
| T. nudiflora | 10 | 0.48 | 12.43 | 0.001 | - | - | - | - | ||||
| Total | 690 | 78.84 | 1.07 | 510 | 75.25 | 1.38 | 290 | 50.92 | 2.11 | |||
Note: D= Density, BA= Basal Area, IVI=Important Value Index, H- =Species diversity, Cd= Concentration of dominance
Biomass
Site-1
Total tree biomass was 787.2t ha-1in sal dense forest. Aboveground and belowground tree components accounted for 77.9 and 22.1% respectively (Table 2). S. robusta contributed 613.6t ha-1 followed by S.cumini 60.3t ha-1 in total biomass whereas A. lebbeck contributed minimum biomass 15.8 t ha-1in this site. However, bole component shared maximum (56.7%) biomass in the above ground part. In aboveground component i.e. bole, branches, twigs and foliage accounted for 46.1-58.0, 12.6-19.8, 3.4-5.9, 2.4-4.4% respectively while belowground part shared 20.5-27.8% biomass among the studied tree species (Table 2).
Site-2
Total tree biomass was 754.8t ha-1 in sal moderate forest. Aboveground and belowground tree components accounted for 78.9 and 21.1% respectively (Table 2). S. robusta contributed 691 t ha-1 followed by B. Ceiba 23.0 t ha-1 in total biomass whereas T. nudiflora contributed minimum biomass 3.3 t ha-1in this site. However, bole component shared maximum (58.7%) biomass in the above ground part. In aboveground component i.e. bole, branches, twigs and foliage accounted for 43.3-59.5, 19.5-11.9, 2.8-5.5, 2-4% respectively while belowground part shared 20.5-27.8% biomass among the studied tree species (Table 2).
Site-3
Total tree biomass was 473.3t ha-1in sal open forest. Aboveground and belowground tree components accounted for 79.5 and 20.5 % respectively (Table 2). S. robusta contributed 472.0 t ha-1 followed by T. grandis 1.3 t ha-1 in total biomass whereas T.grandis contributed minimum biomass 1.3 t ha-1 in this site. However, bole component shared maximum (59.19%) biomass in the above ground part. In aboveground component i.e. bole, branches, twigs and foliage accounted for 39.8-59.4, 11.9-1, 23.3-5.1, 3.1-7.5% respectively while belowground part shared 20.5-17.3% biomass among the studied tree species (Table 2).
Total biomass ranged 473.3 to 787.2t ha-1 in the sal forests (Fig.1). The aboveground and belowground components accounted 77.9 to 79.5 % and 20.5 to 22.1 % respectively.
Table 2: Component wise tree biomass (tha-1) in sal forests at three forest sites
Forest sites | Species | Bole | Branch | Twig | Foliage | TAG | TBG | Total |
Site-1 | S. robusta | 356.29 (58.1) | 77.15 (12.6) | 33.30 (5.4) | 21.03 (3.4) | 487.77 (79.5) | 125.84 (20.5) | 613.62 (100) |
| S. cumini | 31.64 (52.5) | 8.12 (13.5) | 2.19 (3.6) | 1.58 (2.6) | 43.52 (72.2) | 16.76 (27.8) | 60.28 (100) | |
| H. cordifolia | 16.79 (51.4) | 4.53 (13.9) | 1.32 (4.1) | 0.95 (2.9) | 23.6 (72.2) | 9.08 (27.8) | 32.68 (100) | |
| T. belerica | 14.46 (52.3) | 3.75 (13.6) | 1.02 (3.7) | 0.73 (2.7) | 19.96 (72.2) | 7.68 (27.8) | 27.64 (100) | |
| T. tomentosa | 11.28 (52.4) | 2.90 (13.5) | 0.79 (3.7) | 0.57 (2.6) | 15.54 (72.2) | 5.98 (27.8) | 21.52 (100) | |
| L. parviflora | 5.60 (50.7) | 1.56 (14.1) | 0.48 (4.3) | 0.34 (3.1) | 7.98 (72.2) | 3.07 (27.8) | 11.06 (100) | |
| M. philippensis | 1.20 (48.2) | 0.49 (19.8) | 0.08 (3.4) | 0.06 (2.4) | 1.84 (73.9) | 0.65 (26.2) | 2.49 (100) | |
| L.coromendelica | 8.31 (52.5) | 2.13 (13.5) | 0.57 (3.6) | 0.41 (2.6) | 11.43 (72.2) | 4.40 (27.8) | 2.05 (100) | |
| A. lebbeck | 0.96 (46.8) | 0.31 (15.1) | 0.12 (5.9) | 0.09 (4.4) | 1.48 (72.2) | 0.57 (27.8) | 15.83 (100) | |
| Total | 446.53 (56.7) | 100.94 (12.8) | 39.88 (5.1) | 25.76 (3.3) | 613.12 (77.9) | 174.03 (22.1) | 787.15 (100) |
Site-2 | S. robusta | 411.09 (59.50) | 82.17 (11.9) | 35.12 (5.1) | 21.09 (3.1) | 549.48 (79.5) | 141.76 (20.5) | 691.00 (100) |
B. ceiba | 12.61 (54.9) | 2.87 (12.5) | 0.63 (2.8) | 0.46 (2.0) | 16.58 (72.2) | 6.38 (27.8) | 22.96 (100) | |
M.phillippensis | 5.142 (48.9) | 2.05 (19.5) | 0.33 (3.1) | 0.22 (2.1) | 7.74 (73.6) | 2.77 (26.4) | 10.51 (100) | |
S. cumini | 5.28 (43.3) | 2.37 (19.5) | 0.67 (5.5) | 0.48 (4.0) | 8.80 (72.2) | 3.39 (27.8) | 12.19 (100) | |
F.hispida | 3.18 (50.4) | 0.89 (14.1) | 0.28 (4.5) | 0.20 (3.2) | 4.56 (72.2) | 1.76 (27.8) | 6.32 (100) | |
A. excels | 2.55 (49.7) | 0.74 (14.4) | 0.24 (4.7) | 0.17 (3.4) | 3.71 (72.2) | 1.43 (27.8) | 5.14 (100) | |
C. fistula | 1.69 (50.5) | 0.47 (14.2) | 0.15 (4.4) | 0.11 (3.2) | 2.42 (72.3) | 0.93 (27.8) | 3.35 (100) | |
T. nudiflora | 1.66 (50.4) | 0.47 (14.1) | 0.15 (4.4) | 0.10 (3.2) | 2.37 (72.1) | 0.91 (27.8) | 3.29 (100) | |
| Total | 443.21 (58.7) | 92.04 (12.2) | 37.58 (5.0) | 22.84 (3.0) | 595.66 (78.9) | 159.34 (21.1) | 754.76 (100) |
Site-3 | S. robusta | 280.30 (59.4) | 56.03 (11.9) | 24.19 (5.1) | 14.67 (3.1) | 375.19 (79.5) | 96.80 (20.5) | 471.99 (100) |
T. grandis | 0.53 (39.8) | 0.16 (12.0) | 0.31 (23.3) | 0.1 (7.5) | 1.1 (82.7) | 0.23 (17.3) | 1.33 (100) | |
Total | 280.83 (59.19) | 56.19 (11.84) | 24.50 (5.18) | 14.77 (3.12) | 376.29 (79.50) | 97.03 (20.50) | 473.32 (100) |
* TAG (Total Above Ground) * TBG (Total Below Ground) (values in parentheses are the percentage contribution)
Carbon stock
Site-1
Total carbon stock of trees was 373.9t C ha-1 in sal dense forest. Aboveground and belowground tree components accounted for 77.9 % and 22.1 % respectively. (Table 3). S. robusta contributed 291.5t C ha-1 followed by S. cumini 28.6t C ha-1 in total carbon stock. Among the aboveground component, bole shared maximum 56.7% carbon (Table 4).In aboveground component i.e. bole, branches, twigs and foliage accounted for 47-58.1, 12.6-19.9, 3.4-5.8, 2.2-4.2% respectively while belowground part shared 20.5-27.8% carbon content among the studied tree species. (Table 3).
Site-2
Total carbon stock of trees was 358.6t C ha-1 in sal dense forest. Aboveground and belowground tree components accounted for 78.9% and 21.2% respectively. (Table 3). S. robusta contributed 328.3t C ha-1 followed by B. ceiba 18.8t C ha-1 in total carbon stock. Among the aboveground component, bole shared maximum 63.3 % carbon (Table 4). In aboveground component i.e. bole, branches, twigs and foliage accounted for 43.2-59.5, 11.9-19.5, 2.8-5.5, 2-4% respectively while belowground part shared 20.5-27.8% carbon content among the studied tree species. (Table 3).
Site-3
Total carbon stock of trees was 224.8t C ha-1 in sal open forest. Aboveground and belowground tree components accounted for 79.5 % and 20.5 % respectively. S. robusta and T. grandis contributed 224.2 t C ha-1 and 0.6 t C ha-1 total carbon stock respectively. Among the aboveground component, bole shared maximum 59.3% carbon. The carbon storage of different tree species ranged from 79.5-82.8 and 17.2-20.5 % in above and belowground part, respectively (Table 3).Total carbon stock ranged 373.9 to 224.8 t C ha-1 in the sal forests. The aboveground and belowground accounted 77.9 to 79.5 % and 20.5 to 22.1 % carbon respectively.
Table 3: Component wise carbon stock (tha-1) in sal forests at three forest sites
Forest sites | Species | Bole | Branch | Twig | Foliage | TAG | TBG | Total |
Site-1
| S. robusta | 169.24 (58.1) | 36.65 (12.6) | 15.82 (5.4) | 9.99 (3.4) | 231.69 (79.5) | 59.78 (20.5) | 291.47 (100) |
S. cumini | 15.03 (52.5) | 3.86 (13.5) | 1.04 (3.6) | 0.75 (2.6) | 20.67 (72.2) | 7.96 (27.8) | 28.63 (100) | |
H. cordifolia | 7.98 (51.4) | 2.15 (13.9) | 0.63 (4.1) | 0.45 (2.9) | 11.21 (72.2) | 4.32 (27.8) | 15.52 (100) | |
T. belerica | 6.87 (52.3) | 1.78 (13.6) | 0.49 (3.7) | 0.35 (2.7) | 9.48 (72.2) | 3.65 (27.8) | 13.13 (100) | |
T. tomentosa | 5.36 (52.7) | 1.38 (13.5) | 0.37 (3.6) | 0.27 (2.6) | 7.38 (72.2) | 2.80 (27.5) | 10.18 (100) | |
L. coromendelica | 3.95 (52.5) | 1.01 (13.5) | 0.27 (3.6) | 0.19 (2.6) | 5.43 (72.2) | 2.09 (27.8) | 7.52 (100) | |
L. parviflora | 2.66 (50.7) | 0.74 (14.1) | 0.23 (4.3) | 0.16 (3.1) | 3.79 (72.2) | 1.46 (27.8) | 5.25 (100) | |
M. phillippensis | 0.57 (48.4) | 0.23 (19.9) | 0.04 (3.4) | 0.03 (2.2) | 0.87 (73.8) | 0.31 (26.2) | 1.18 (100) | |
A. lebbeck | 0.46 (47.0) | 0.15 (15.0) | 0.06 (5.8) | 0.04 (4.2) | 0.70 (72.0) | 0.27 (27.7) | 0.97 (100) | |
Total | 212.10 (56.7) | 47.94 (12.8) | 18.94 (5.1) | 12.23 (3.3) | 291.22 (77.9) | 82.64 (22.1) | 373.86 (100) | |
Site-2
| S. robusta | 195.27 (59.5) | 39.03 (11.9) | 16.68 (5.1) | 10.02 (3.1) | 261.00 (79.5) | 67.34 (20.5) | 328.34 (100) |
| B. ceiba | 5.99 (54.9) | 1.36 (12.5) | 0.30 (2.8) | 0.22 (2.0) | 7.87 (72.2) | 3.03 (27.8) | 10.91 (100) | |
| S. cumini | 2.51 (43.2) | 1.13 (19.4) | 0.32 (5.5) | 0.23 (4.0) | 4.19 (72.1) | 1.61 (27.8) | 5.80 (100) | |
| M. phillippensis | 2.44 (48.9) | 0.97 (19.5) | 0.16 (3.1) | 0.10 (2.1) | 3.67 (73.7) | 1.32 (26.4) | 4.99 (100) | |
| F. hispida | 1.51 (50.6) | 0.42 (14.2) | 0.13 (4.5) | 0.10 (3.2) | 2.16 (72.5) | 0.83 (27.9) | 2.99 (100) | |
| A. excelsa | 1.21 (49.7) | 0.35 (14.4) | 0.11 (4.7) | 0.08 (3.4) | 1.76 (72.2) | 0.68 (27.8) | 2.44 (100) | |
| C. fistula | 0.80 (50.5) | 0.23 (14.2) | 0.07 (4.4) | 0.05 (3.2) | 1.15 (72.3) | 0.44 (27.8) | 1.59 (100) | |
| T. nudiflora | 0.79 (50.4) | 0.22 (14.2) | 0.07 (4.4) | 0.05 (3.2) | 1.13 (72.2) | 0.43 (27.8) | 1.56 (100) | |
| Total | 210.53 (63.3) | 43.72 (12.2) | 17.85 (5.0) | 10.85 (3.0) | 282.93 (78.9) | 75.69 (21.2) | 358.63 (100) | |
Site-3
| S. robusta | 133.14 (59.4) | 26.61 (11.9) | 11.49 (5.1) | 6.97 (3.1) | 178.21 (79.5) | 45.98 (20.5) | 224.19 (100) |
T. grandis | 0.25 (39.1) | 0.08 (12.5) | 0.15 (23.4) | 0.05 (7.8) | 0.53 (82.8) | 0.11 (17.2) | 0.64 (100) | |
Total | 133.39 (59.3) | 26.69 (11.9) | 11.64 (5.2) | 7.02 (3.1) | 178.74 (79.5) | 46.09 (20.5) | 224.83 (100) |
* TAG (Total Above Ground) * TBG (Total Below Ground) (values in parantheses are the percentage contribution)
Discussion
Forest structure, stocks of biomass and carbon varies with composition of tree species, age and density of plant species occurring in the forest. The tree species growing in Tarai region mainly dominated by Sal (S. robusta) and associated with trees and under canopy plant species. Present study was performed on structure, biomass and carbon content in respective forest site. The three forest sites were located at different area and direction. In each site there was a variation in tree density, species diversity, basal area, biomass and carbon.
Table 5: Correlation between vegetational parameters through Pearson’s correlation matrix
| Density | Total Basal Area | Diversity | Biomass | Carbon | ||
| Density | 1 | 0.94 | -0.98 | 0.93 | 0.93 | |
| TBA | 1 | -0.98 | 0.99 | 0.99 | ||
| Diversity | 1 | -0.97 | -0.97 | |||
| Total Biomass | 1 | 1 | ||||
| Carbon | 1 | 1 | ||||
* Correlation is significant at the 0.05 level (2-tailed). **. Correlation is significant at the 0.01 level (2-tailed).
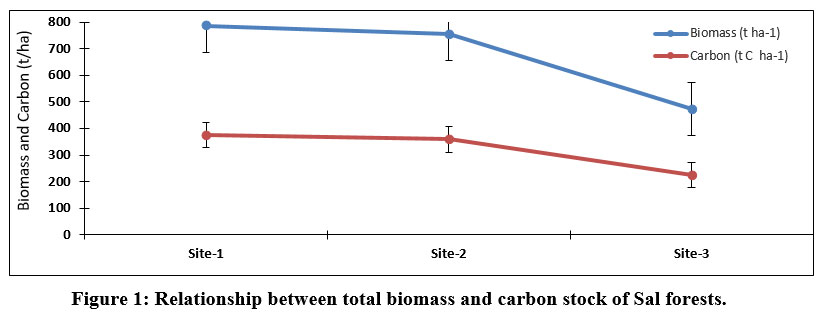 | Figure 1: Relationship between total biomass and carbon stock of Sal forests.
|
The tree density in sal forests varied from 290-690 indiv.ha-1, these values comes within the range 35-863 indiv. ha-1 of Sal forests of Shiwalik region2,5, 12-19. The present values are somewhat close to 35-419 indiv. ha-1of dry tropical forest14 and lower side than 756-911 indiv.ha-1 of sal mixed forest20-21. However, basal area of Sal forests ranged from 50.9 to 78.8 m2 ha-1, 18which was slightly higher side than the range 25.3-77.6m2 ha-1 and 23.2 - 47.8m2 ha-1 of tree species19. Tree species diversity was 1.1-2.1 in sal forest which falls within the range 0.7 - 2.6 of sal forest in Central Himalaya13-15,18,20 and the range slightly higher side than 0.698-0.904 for dry tropical forest14.
Biomass and carbon stock of sal forests ranged from 473.3 to787.1t ha-1 and 224.8-373.9t C ha-1, respectively (Fig.1). The abovesaid values are on higher side than 66.5 to 710 t ha-1of biomass and 33.5 to 337.3 t ha-1carbon of sal forests of central Himalaya2,12,16,17,22-25and lower side than 1280.8 t ha-1 biomass and 577.8 t ha-1 carbon stock of sal dominant forest5. However, the present values are nearly close to455-710t ha-1of biomass and 216.1-337.3t ha-1carbon of Sal forest2, 380.0- 815.0 t ha-1biomass and 181.0-387.0 t ha-1carbonofsal mixed forest of Kumaun Himalaya13and 408.9 - 704.3t ha-1 biomass,194.2 - 339.5t ha-1carbon of sal forests19(Table 4). The Pearson’s correlation indicates that the tree density was positively correlated with total basal area (r2= 0.94), biomass (r2= 0.93) and carbon stock (r2= 0.93) and negatively correlated with tree diversity (p<0.05) significant among the forest stands (Table 4). S. robusta shared maximum tree biomass (471.9 to 691 t ha-1)and carbon content (224.2 to 328.3 t C ha-1) in all forest sites. Biomass and carbon stocks are depicted in Fig.1.
Present findings had shown that there was a variation among various parameters studied in all forest sites. The site-1 had more tree density, diversity, biomass and carbon compared to other sal forest site-2 and site-3. On the basis of findings, it is concluded that the forests sites which had better management inputs and less extraction of usufructs had shown a good condition than the forest sites which had more anthropogenic pressure and poor management inputs as well as unscientific extraction of usufructs by nearby village. Apart from these, it is assumed that the existing soil and climatic condition of the area were also responsible for the vegetation structure and stocks of Sal forests of the region. Therefore, those forests which are degraded and have anthropogenic pressure should be conserved by providing better management and scientific inputs. So that these forests could save large amount of carbon by sequestering the atmospheric carbon continuously and would also help in the battle against global warming and climate change.
Acknowledgment
The author would like to thank the Head of the Department of Forestry and Environmental Science, D. S. B. Campus, Kumaun University, Nainital for providing the laboratory facilities.
Conflict of Interest
The authors do not have any conflict of interest.
Funding source
There is no funding or financial support provided for this research work.
References
- Chaturvedi O. P, Singh J.S.The structure and function of pine forest in Central Himalaya. I. Dry matter dynamics. Annals of Botany 1987; 60:237-252.
CrossRef - Rana B. S, Singh R. P, Singh S. P. Carbon and energy dynamics of seven central Himalayan forests. Tropical Ecology 1989; 30(2):253-264.
- Lodhiyal N, Lodhiyal L. S, Pangtey Y. P. S. Structure and function of Shisham forests in Central Himalaya, India: dry matter dynamics. Annals of Botany 2002; 89: 41-54.
CrossRef - Lodhiyal N, Lodhiyal L.S. Tree layer composition and carbon content of Oak and Pine in Lohaghat forest of Kumaun Himalaya. Journal of plant development Science 2012; 4(1): 55-62.
- Kaushal S, Baishya R. Stand structure and species diversity regulate biomass carbon stock under major central Himalayan forest types of India. Ecological Processes 2021; 10(1): 1-18.
CrossRef - Lodhiyal L. S, Lodhiyal N, Bhakuni N. Standing tree biomass and carbon content in natural forests of Kumaun in Central Himalaya. Journal of plant development Science 2014; 6(2): 167-174.
CrossRef - Magnussen S, Reed D. Modeling for estimation and Monitoring. (FAO-IUFRO, 2004).
- Misra R. Ecology work book. Oxford and IBP Publishing Co., Calcutta, 1968.
- Shannon C. E, Wiener W. The Mathematical Theory of Communication. University Illinois Press, Urbana 1963.
- Simpson E. H. Measurement of diversity. Nature, 1949; 163:688.
CrossRef - Jha K. K. Structure and functioning of an age series of Teak (Tectona Grandis L.) plantations in Kumaon Himalayan Terai. Ph.D. Thesis. Kumaon University, Nainital, 1995.
- Sundriyal R. C, Sharma E, Rai L. K, Rai S. C. Tree structure, regeneration and wood biomass removal in a Sub- Tropical forest of Mamlay watershed in the Sikkim Himalaya. Vegetatio 1994 ;113:53-63.
CrossRef - Pathak G. C.Vegetation analysis and productivity of Shorea robusta Gaertn. F. and Pinus roxburghii Sarg. in Kumaun Himalaya. Ph. D. thesis, Kumaun University, Nainital, Uttarakhand, 2008.
- Sagar R, Raghubanshi A. S, Singh J. S. Tree species composition, dispersion and diversity along a disturbance gradient in a dry tropical forest region of India., Forest Ecology and Management 2003;186(1-3):61-71.
CrossRef - Chauhan P. S, Negi J. D. S, Singh L, Manhas. Regeneration status of Sal forest of Doon Valley. Ann. For. 2008; 16:178-182.
- Sharma C. M, Baduni N. P, Gairola S, Ghilidiyal S. K, Suyal S. Tree diversity and carbon stocks of some major forest types of Garhwal Himalaya, India. Forest Ecology and Management 2010; 260(12): 2170 – 2179.
CrossRef - Mandal G, Joshi S. P. Biomass accumulation and carbon sequestration potential of Shorea robusta and Lantana camara from the dry deciduous forests of Doon Valley, western Himalaya, India, International Journal of Environmental Biology 2014; 4 (2): 157-169.
- Adhikari B, Kapkoti B, Lodhiyal N, Lodhiyal L. S. Structure and Regeneration of Sal (Shorea robusta Gaertn f.) forests in Shiwalik region of Kumaun Himalaya, India. Indian Journal of forestry 2017;40(1): 1-8.
CrossRef - Pandey J, Lodhiyal L. S, Lodhiyal N. Productivity and Carbon sequestration potential of van-panchayat forest in Kumaun Himalaya. Journal of plant development sciences 2017; 9(7):677-682.
- Kapkoti B, Adhikari B, Lodhiyal N, Lodhiyal L. S. Structure and Diversity of Sal Forests in Government and Community Management Systems in Kumaun Region of Central Himalaya. Current World Environment 2016; 11(1): 126-132
CrossRef - Joshi V, Bisht D, Sundriyal R. C, Pant H. Species richness, diversity, structure, and distribution patterns across dominating forest communities of low and mid-hills in the Central Himalaya. Geology Ecology and Landscapes 2022; 10(4):1-10.
CrossRef - Negi M. S, Tandon V. N, Rawat H. S. Bio-mass and nutrient distribution in young teak (Tectona grandis Linn f) plantations in Tarai region of Uttar Pradesh. Indian Forester 1995;121: 455-464.
- Ramachandran A, Jayakumar S, Haroon R. M, Bhaskaran A, Arockiasamy D. I. Carbon sequestration: estimation of carbon stock in natural forests using geospatial technology in the Eastern Ghats of Tamil Nadu, India. Curr Sci 2007; 92(3):323–331.
- Kale M. P, Ravan S. A, Roy P. S, Singh S. Patterns of carbon sequestration in forests of western ghats and study of applicability of remote sensing in generating carbon credits through afforestation/reforestation. Journal of the Indian Society of remote Sensing 2009; 37(3): 457-471.
CrossRef - Bijalwan A, Swamy S. L, Sharma C. M, Sharma N. K, Tiwari A. K. Land-use, biomass and carbon estimation in dry tropical forest of Chhatisgarh region in India using remote sensing and GIS. Journal of Forest Research 2010; 21(2):161 – 170
CrossRef


