Status of Ambient Air Pollution in Different States of India during 1990-2015
Radhika M. Patil1
*
 and H T Dinde
1
Vivekanand College, Kolhapur (Autonomous),
Kolhapur,
India
2
Shri ShivShahu Mahavidyalay,
Sarud, Tehsil Shahuwadi,
Kolhapur,
India
http://dx.doi.org/10.12944/CWE.18.1.21
Copy the following to cite this article:
Patil R. M, Dinde H. T. Status of Ambient Air Pollution in Different States of India during 1990-2015. Curr World Environ 2023;18(1). DOI:http://dx.doi.org/10.12944/CWE.18.1.21
Copy the following to cite this URL:
Patil R. M, Dinde H. T. Status of Ambient Air Pollution in Different States of India during 1990-2015. Curr World Environ 2023;18(1).
Download article (pdf)
Citation Manager
Publish History

Introduction
Pollution in the air is among the most significant factors that can damage human health. Environmental science places a significant emphasis on researching the connection between poor air quality and the development of respiratory conditions 3. In cities all around the world, hospitalizations for respiratory diseases have been linked to air pollution as a potential contributing factor 1 - 7. The connections involving PM and tropospheric ozone have been determined to be the most prevalent and consistent of all the relationships 9 The atmosphere is an essential component of the human ecosystem, and the contaminants that are present in it have a direct impact on the wellness of humans. It would appear that the incidence of pulmonary illnesses is increased as a direct result of air pollution's short-term impact on human welfare. Air pollution has been linked to a rise in the death rates associated with respiratory and cardiovascular disorders. According to the studies, conducted on the relationship between air pollution and public health in Shanghai, when the daily mean composition of PM10 and PM2.5 rises by 10ug/m3, the overall percentages of these diseases boost by 0.53 percentage points (from 0.22 percent to 0.85 percent) and by 0.85 percent percentage points, moving from 0.32 percent to 1.39 percent respectively 3. Figure 1 shows the data on mortality in 2012 due to air pollution in the form of a pie chart.
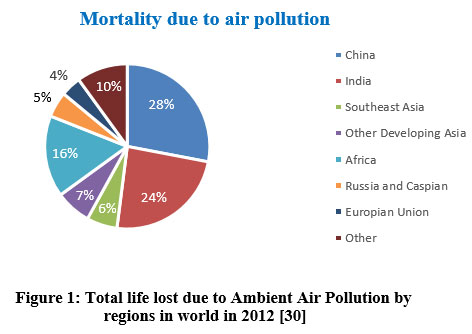 | Figure 1: Total life lost due to Ambient Air Pollution by regions in world in 2012 30
|
It would appear that the incidence of lung illnesses is increased as a direct result of air pollution's short-term impact on human health. It is anticipated that climate change, which can be detected by a rise in both the annual mean temperature and the frequency of heat waves that happen in various locations, would contribute to an elevation in morbidity in several different regions. There is a continuous association between heat waves and a rise in the number of hospital admissions, notwithstanding the broad variety in the kind of sickness or condition that is being treated. A recent survey has demonstrated a correlation between elevated temperatures and an increase in hospitalizations. This correlation holds not just for heat-related disorders like heart attack, yet also for more general pulmonary and cardiovascular ailments. Air temperature is considered to be a key role when it comes to extreme weather and public health. Although the primary climatic variables, such as daily maximum and lowest temperatures, only represent a small portion of the entire input from weather and climate on physiological systems12. Air pollution is primarily caused by PM10, SO2, and NO2. SO2 emissions have risen steadily in recent years, moving this pollutant from third to second on the list of most dangerous pollutants, with a yearly mean level in 2005 above the secondary national threshold. It is critical to investigate how air pollution impacts people's health and the measures that can be taken to mitigate such effects 3.
There have been few prior studies that have examined the relationship between air pollution composition and health effects metrics outside of China's major cities, such as Beijing or Shanghai. Similar studies have been done on the health impacts of air pollution in extremely polluted places in other analyses 1 After a series of validation tests, the reason for mortality is also documented for the patient. It categorizes the factors that led to a person's death as cardiorespiratory. There is a correlation between the quality of the ambient air and the cardiorespiratory sources of mortality, which comprise cardiovascular disease, stroke, lung cancer, and pulmonary disorders. Other forms of cancer, fatalities caused by accidents or violence, and a variety of gastrointestinal conditions are examples of causes of mortality that are unrelated to air quality. These two classes together account for every conceivable cause of mortality 16. Hazardous air contaminants like black carbon, dioxins, furans, particulates, mercury, and carbon monoxide can come from the open burning of garbage, which is a major source of these pollutants. The burning of fuel wood and biomass, the widespread combustion of crop waste in agricultural areas, the usage of gasoline that has been contaminated, emissions from cars, and congestion caused by traffic are the leading providers to air pollution in India [20]. So, the analysis is organized as a comparative study on air pollution in India.
Related Work
An increment in the composition of gaseous and solid toxins is one of the greatest health risks in the world, and according to the most recent data from the WHO, outdoor and indoor air pollution were liable for 3.7 million mortality of people under the age of 60 in 2012.
Dust and construction are responsible for approximately 69 percent of India's overall air pollution. Waste burning is another contributing factor. Urban areas are characterized by a prevalence of dust and building, whereas rural areas are characterized by a prevalence of trash combustion. In metropolitan areas, dust and construction can be seen more frequently, but in rural areas, waste burning is more common, contributing to the annual unfortunate death of 2 million Indians 17. Stroke is one of the leading causes of mortality in middle-aged and older adults, especially when paired with high blood pressure, diabetes, dyslipidemia, smoking, excessive alcohol use, and atherosclerosis 18. Conversely, if strokes are also connected with air pollution, then reducing the amount of exposure might significantly lessen the linked health load without relying on people to change their behaviors. The ambient and home air quality can vary across India due to the wide variety of sources, pollutants, climate, geographical features, and cultural traditions. However, over time, trends show worsening in both urban and rural India, regardless it is due to growing urbanization and the attendant increased vehicle and industrial pollutants or the "Chula trap," which results in poor indoor air quality 18. For the years 1990 to 2019, the number of deaths in India attributable to PM2.5 air pollution is displayed in figure 2. PM2.5, a type of air pollution, is extremely dangerous because it has been linked to an increase in mortality from 1990 to 2019 31.
This demonstrates unequivocally that air quality in India is at an urgent level.
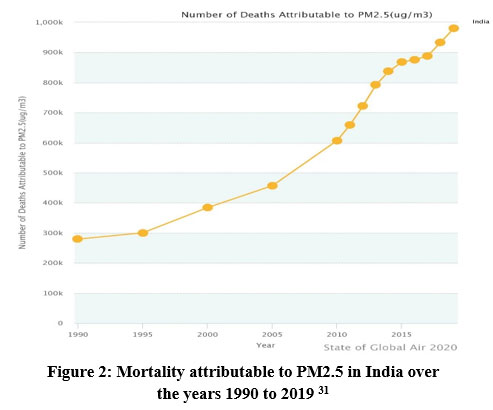 | Figure 2. Mortality attributable to PM2.5 in India over the years 1990 to 2019 31
|
Major Source of Air Pollution In India
Industrial Emission
According to data made public by the Central Electricity Authority (CEA) as of January 2015, thermal power plants that are fueled by coal account for 60.72 percent of India's total power output. It just so happens that coal plants are one of the primary generators of sulphur dioxide and nitrogen dioxide. 21. India is trying to reach its aim of lowering Green House Gas (GHG) emissions by 33–35 percent from 2005 levels by 2030. More than three-fourths of all Green House Gas (GHG) emissions in the country come from the energy sector. Industrial operations release several pollutants into the air, which negatively impacts air quality in ways that humans cannot even begin to comprehend. PM 2.5 and 10, NO2, SO2, and carbon monoxide are important pollutants that are released from factories that produce their goods using coal and wood as their principal sources of energy. The eyes and throat can get irritated, and it causes trouble in breathing also in some cases, it can even develop into a chronic condition as a result of the impact of commercial pollution on health 19.
Indoor Pollution
The term indoor air pollution refers to the contamination of interior air in chemical, biological, and physical ways. It is possible that this would have an unfavorable effect on health. According to a report published in the interdisciplinary journal Lancet Planetary Health, the number of fatalities that were caused by indoor air pollution, also known as home air pollution, decreased by 64 percent in India during the past two decades (2000-2019).
According to the Census completed in 2011, families in rural areas rely on biomass for cooking at a rate of 87%, whereas just 26% of households in urban areas do so. It is estimated that 400 million Indians suffer from pulmonary and respiratory health problems as a direct result of the burning of biomass, which is the major source of indoor air pollution 21-24.
Transportation
The transportation business contributes to exposure to air hazardous chemicals, which can cause cancer or other severe health and environmental problems.
There is no way to dispute the fact that pollution from vehicles is the primary cause of air pollution, particularly in big centers [3]. Gasoline combustion produces contaminants in the air equivalent to smoking ten cigarettes a day. Carbon monoxide, hydrocarbons, nitrous oxide, and PM are all emitted by vehicles. A hole in the ozone layer is formed when car pollution is excessive in the atmosphere, resulting in smog and other health problems. Transport accounts for a third of the country's pollution and a greater percentage of nitrogen oxides, two substances that are toxic to humans. India has extremely minimal per capita mobility emissions since its automobile fleet is modest in comparison to the country's enormous population 21.
Agriculture
The deterioration in air quality has been exacerbated by agricultural operations. Starting with pesticides and fertilizers, the air around is contaminated. Fast-growing crops and plants require the use of insecticides and fertilizers that include new invasive species that are not present in nature. The pesticides' smell and impact linger in the air after they have been applied. In addition to ruining the crops, these chemicals can cause a wide range of health problems 18.
It found that, after adjusting for climate change, the production of wheat in 2010 was down by about 36%, while the yield of rice was down by 20%. Vehicle effluents and outdoor cook burners, respectively, emit Short-Lived Climate Pollutants (SLCPs) into the environment, including ozone and black carbon. These SLCPs only last a little time in the environment21.
Effect on Health
SO2, lead, NO2, particle pollution, ground-level ozone, and carbon monoxide are the six primary air pollutants that have been identified by the World Health Organization (WHO) 26. Both short and long-term exposures to airborne toxicants have a variety of adverse effects on human health, some of which include pulmonary and heart disorders, neuropsychiatric difficulties, eye irritation, skin infections, and long-term chronic diseases like cancer. One of the most significant contributors to air pollution is the combustion of fossil fuels for the generation of primary and secondary contaminants in the context of the generation of electricity and transportation. It results in the formation of aerosols when this gaseous ammonia interacts with other contaminants, including nitrogen oxides and sulphates, which are produced by automobiles and commercial operations. Aerosols are small particles that can go deeper into the lungs and affect a variety of heart and lung conditions. Ozone at ground level is produced when volatile organic molecules and oxides of nitrogen interact with the sun's UV radiation. Mobile sources, such as automobiles, trucks, buses, construction equipment, and agricultural equipment, are the principal contributors of volatile organic compounds and nitrogen oxides. During the late afternoon and early evening hours, the ozone concentration at ground level is at its maximum. The summer months are when elevated levels are most frequently observed 18. Compression of the airways can occur as a result of exposure to this severe irritant, which places additional strain on the respiratory system. Air pollution is to blame for a third of all stroke, lung cancer, and heart disease fatalities. This has a similar impact to smoking and is far greater than the consequences of over-consumption of salt. In the air, there is a complex combination of particles that have been associated with an increased risk of cardiac-related illness and death. Dust and smoke are examples of PM10, however, more than 90% of PM cannot be seen with the human eye Fine Particulate Matter (FPM) and PM2.5 is the name given to these compounds 24. If the molecules have a size of lesser than 2.5 micrometers, then it is only possible to observe them under a microscope. In addition, a great deal of surveys in the medical field has shown that exposure to fine particle pollutants can hasten a person's death by causing cardiac arrhythmias, nonfatal heart attacks, exacerbated asthma, and reduced lung functions in individuals who already have preexisting lung or heart condition 26.
Chemical reactions in the environment and the burning of fuel are the two primary sources of PM. The burning of biomass in domestic furnaces and wood stoves is another substantial source of PM. If carbon monoxide is inhaled, it competes with oxygen in the blood and deprives the heart, brain, and other essential organs of oxygen, which can have serious health consequences. It affects human life, as well as animal and plant life. People who are susceptible to harm, such as those who have lung illness, the elderly, and youngsters, offer a larger danger than others 24.
Data Collection
Air pollution Data
It consists of different parameters or fields such as pollutants, location, date, state, type, and weather station. It can analyze the air pollution data based on these parameters to know about the pollution status of India. The air pollution data repository is collected from Kaggle which is an online community that provides various data repositories. The data is for the years 1990 to 2015 for the country India. The Dataset contains 4, 35,739 records which include the parameters as, sampling date, state, location, agency, type, So2, date, spm, location monitoring station, rspm, stn code, PM2.5, and No2. Figure 3 demonstrated the dataset of air pollution.
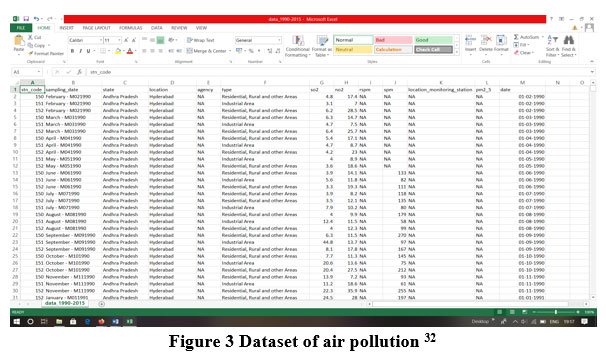 | Figure 3 Dataset of air pollution 32
|
The dataset contains the following parameters
Stn code: station code- It is the code of the station where the data is recorded.
Sampling date: Indicates the date of recording the data.
State: Indicates the state of India whose data is recorded.
location: Indicates the city of state whose data is recorded.
Agency: Indicates the name of the agency that records the data.
Type: It is the type of area where data is recorded. The possible areas under the field are industrial area, sensitive area, Residential, Rural and Others, Residential and others.
So2: The concentration value of Sulphur Dioxide recorded.
No2: The concentration value of Nitrogen Dioxide recorded.
RSPM: The concentration value of Respirable Suspended Particulate Matter recorded.
SPM: The concentration value of Suspended Particulate Matter was recorded.
Location monitoring station: It indicates the location of the monitoring station.
PM2.5: The concentration value of PM having a diameter less than or equal to 2.5 microns was recorded.
Date: It indicates the date of recording the concentration of the pollutant in DD-MM-YYYY format. That gives the day-wise recording of data.
Data Pre-Processing
The raw data that it gets from the source cannot be in the format used in the analysis. Data preparation is important for meaningful analysis. If an appropriate effort is not put to collect accurate information for the evaluation, they cannot expect to obtain accurate findings. Feature selection is one of the tasks involved in data pre-processing where it can remove redundant features, and irrelevant features, combine features or add new features to get required results. The features stn code, agency, sampling date, and location_monitoring_station are removed from the air pollution dataset because it is not useful in terms of findings. It also adds the year feature in the data set, which is derived from the date feature.
Research Methodology
The concept of designed architecture is examined in the context of research methodology. In the research methodology, it has been taken the collection of data as the input data then performed data pre-processing then feature extraction then feature reduction, and last, compared the data based on given parameters and obtained a promising result.
Proposed Methodology
The methodology is based on estimating the status of air pollution in different states of India and detailed steps are given below. Figure 4 shows the flowchart of the proposed methodology.
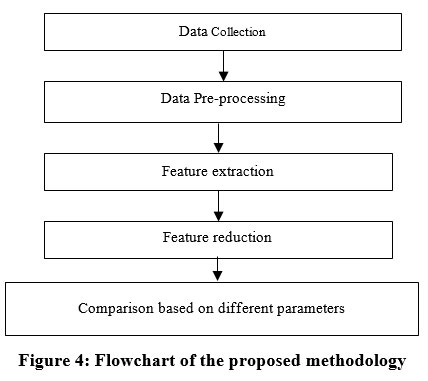 | Figure 4: Flowchart of the proposed methodology
|
This section shows the process of the research work. Following are the steps of the proposed methodology:
Step 1: Collection of data.
In this step, the data is between the years 1990 to 2015 for the country India. It contains 4, 35,739 records which include the parameters such as sampling date, state, location, agency, type, So2, date, SPM, location monitoring station, RSPM, stn code, PM2.5, and No2.
Step 2: Data Pre-processing
After the collection of data in step 2, the pre-processing of collected data occurred. The raw data that it gets from the source cannot be in the format used in the analysis, since pre-processing of data is performed. It can be done by dividing the data into multiple segments by sampling technique.
Step 3: Feature extraction
After pre-processing of collected data in this step, the feature extraction of data is performed in which data is transformed into numerical features that can be processed while preserving the information in the original dataset.
Step 4: Feature Reduction
After completing the feature extraction process in this step, the feature reduction is performed, in which the number of features is reduced without losing or deleting the important information from the dataset.
Step 5: Comparison based on different parameters
At last, after performing the feature reduction process in this step, the data are compared based on different parameters such as SO2, RSPM, NO2, PM2.5, and SPM. After comparison, a promising result is obtained.
Result And Discussion
To operate on an air pollution dataset consisting of different pollutants like SO2, RSPM, NO2, PM2.5, and SPM. By using pollutants concentration values, it analyzed the status of outdoor air pollution in various states of India. It also knows about the status of specific pollutants pollution in different states or cities of India.
First of all, here it takes the bar plot of every state vs. all pollutants ratio by using concentration value. According to the graph (Fig 5), Delhi has the maximum level of concentration for all the pollutants (i.e., SO2, RSPM, NO2, PM2.5, and SPM).
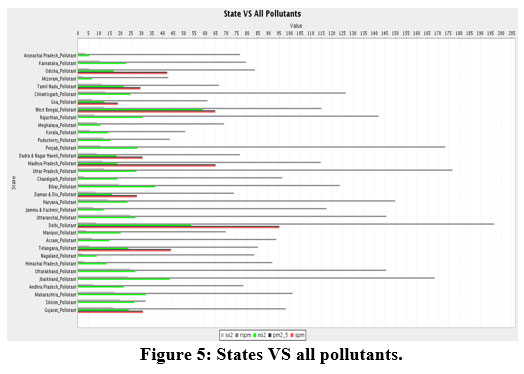 | Figure 5: States VS all pollutants.
|
Year wise graph (Fig 6) represents the various pollutant concentrations for the years 1988 to 2015 in India. It calculates the all-state-wise pollutant with the help of different level state datasets for data channels in Indian big cities. Data can be divided into different classes means every city and every area has different pollutants available in their village or city. The highest pollution is shown for the years 2005 and 2011.
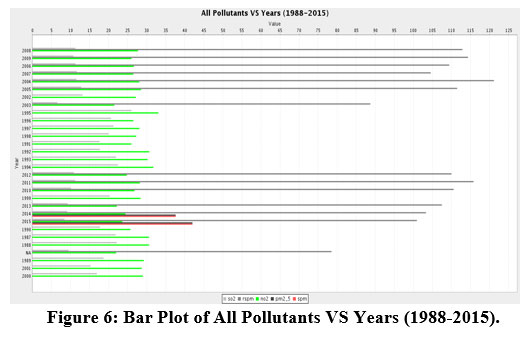 | Figure 6: Bar Plot of All Pollutants VS Years (1988-2015).
|
As shown in the given dataset of pollution there is a type of field that represents the different possible areas. According to the data available for this type of field, there are three types of areas available namely 1. Sensitive area. 2. Residential, Rural and Other areas, 3. Industrial areas. It classified data into 3 categories sensitive areas like hospitalized areas, schools, children play ground areas and any other temple. The second one is combined with all society rural areas where people live and the last one is industrial areas where distinct types of infrastructure factories are available in any sector. So here it shows the status of pollution (All pollutants are considered) in different areas mentioned above for the specific state of India. Figure 7 shows the image of All Pollutants for the state of Karnataka.
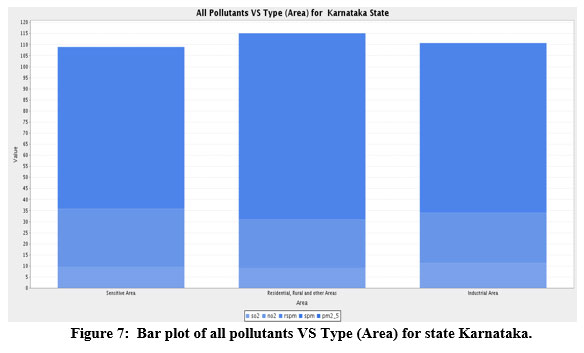 | Figure 7: Bar plot of all pollutants VS Type (Area) for state Karnataka.
|
As per the graph (Figure 7), Karnataka state has the highest concentration level of PM2.5 pollutant in residential, and rural areas. This means the pollution in Karnataka is higher in residential and rural areas because of domestic fuel and other rural sources of indoor and outdoor pollution. Figure 8 shows the image of All Pollutants for the state of Maharashtra.
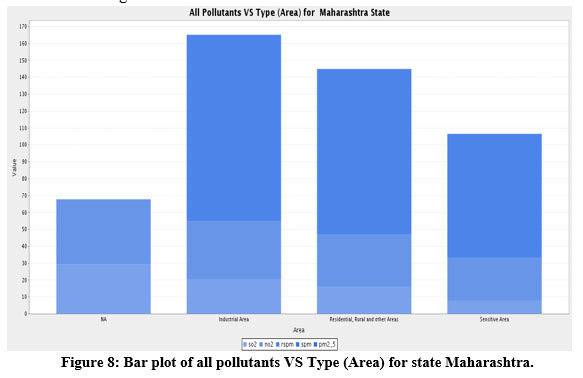 | Figure 8: Bar plot of all pollutants VS Type (Area) for state Maharashtra.
|
Maharashtra has the greatest levels of pollution in the industrial sector because it is home to a diverse range of industries. It has the highest levels of pollution, to determine which cities are in the industrial zone. If industries rely on human labor, then an increase in the human population is inevitable. In several sectors, it is establishing new cities and residential colonies. As a result, human society was the next most polluted source in both residential and rural areas. Figure 9 shows the image of All Pollutants for the state of Madhya Pradesh.
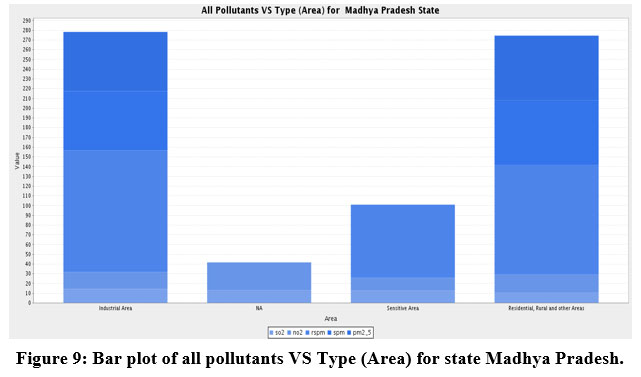 | Figure 9: Bar plot of all pollutants VS Type (Area) for state Madhya Pradesh.
|
Madhya Pradesh has available all types of pollutants in different areas. The above graph (Figure 9) shows that Madhya Pradesh has the highest pollution level in industrial, residential, and rural areas. Figure 10 shows the image of All Pollutants for the state of Rajasthan.
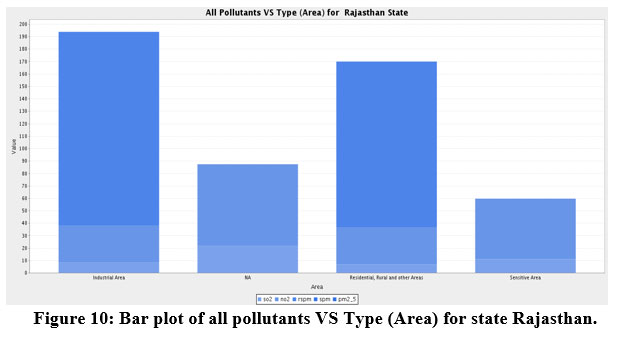 | Figure 10: Bar plot of all pollutants VS Type (Area) for state Rajasthan.
|
Rajasthan has the worst pollution in the industrial sector, followed by the residential sector (Figure 10). Figure 11 shows the image of All Pollutants for the state of Karnataka
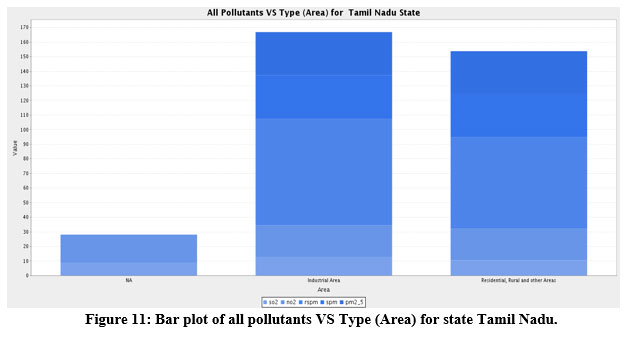 | Figure 11: Bar plot of all pollutants VS Type (Area) for state Tamil Nadu.
|
The industrial areas of Tamil Nadu are the most polluted, followed by residential, rural, and other areas (Fig 11). Figure 12 shows the image of All Pollutants for the state of West Bengal.
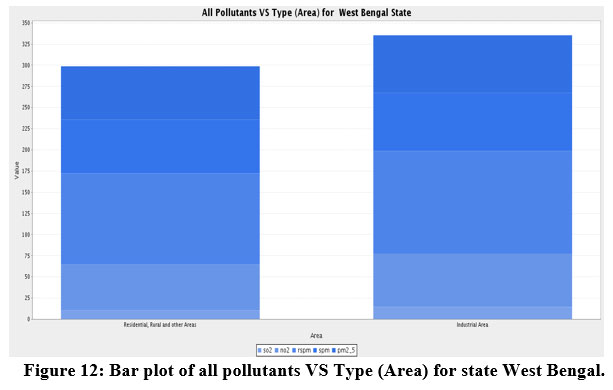 | Figure 12: Bar plot of all pollutants VS Type (Area) for state West Bengal.
|
In the state of West Bengal, the data for only two types of areas are available: industrial and residential. Industrial regions have the most pollution, with So2 having the lowest pollutant ratio and RSPM having the highest pollutant ratio.
Here it plots the bar plots of various pollutants concentration levels in decreasing order of their concentration v/s state so that it can easily find out the highly polluted state in India. For this, it selects the field state and respective pollutant concentration column (So2, No2, RSPM, SPM, and PM2.5) of the air pollution dataset. As the state field of the dataset has the data of various locations, and types (residential, industrial, sensitive areas) in a particular state, so to get the overall result state it takes the average pollution concentration column for a specific state. Figure 13 shows the value of RSPM in different states of India
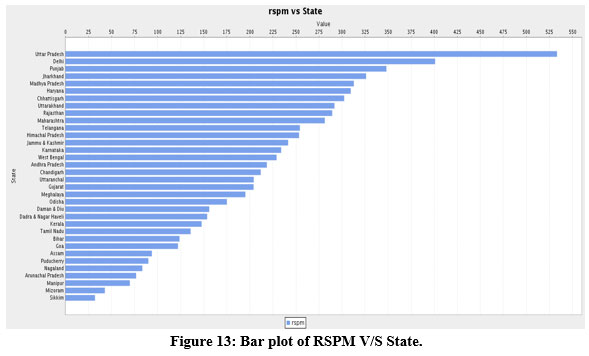 | Figure 13: Bar plot of RSPM V/S State.
|
As shown in the above plot, it has been clear that the state of Uttar Pradesh is at the highest level of rspm concentration, which is followed by Delhi, Punjab, Jharkhand, and Madhya Pradesh. The state of Sikkim is at the lowest level in the case of RSPM concentration level. The bar plot also shows that about 20 states of India are at the highest and most critical levels of RSPM pollution [29]. This means that India is at elevated risk of RSPM ambient air pollution. The government of India must act by making new policies to control the air pollution in affected states.
Now let's look at a more thorough representation with a bar plot of location (city) vs. higher levels of RSPM concentration, but in decreasing order to find the city with the highest RSPM concentration. The dataset's field location additionally contains data of several types (residential, industrial, sensitive, and other areas). So, to acquire the overall result for a specific location (city) or state, it averages the respective pollutant concentrations at the same site. Figure 14 shows the highest value of RSPM concentration level in different cities of India.
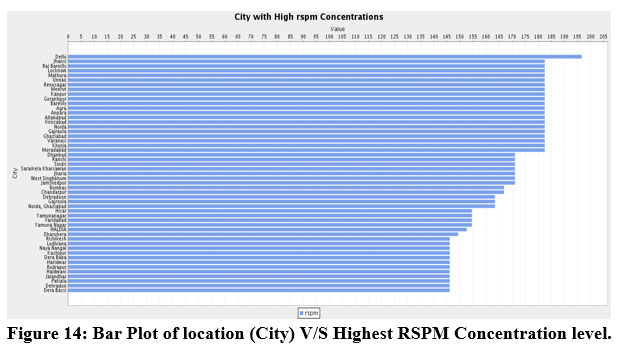 | Figure 14 Bar Plot of location (City) V/S Highest RSPM Concentration level.
|
As shown in the above figure it is clear that the location Delhi has the highest concentration of RSPM which is followed by the city Jhansi (Uttar Pradesh), Raebareli (Uttar Pradesh), Lucknow (Uttar Pradesh), Mathura (Uttar Pradesh). Here it can see that majority of the contaminated cities linked to RSPM are found in the state of Uttar Pradesh.
It uses a bar plot of least RSPM concentration vs. location to see which locations have the lowest rspm concentration or are free of rspm pollution. Figure 15 shows the Least value of RSPM concentration level in different cities in India
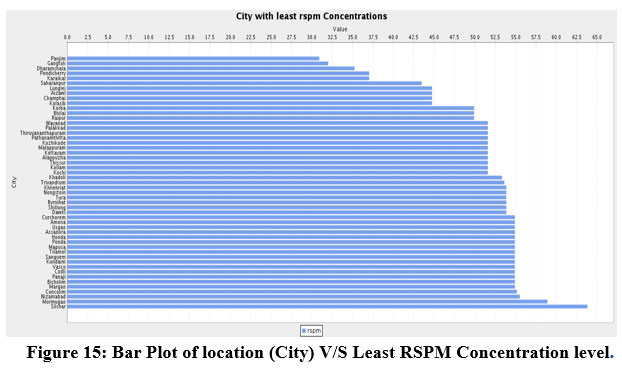 | Figure 15: Bar Plot of location (City) V/S Least RSPM Concentration level.
|
As shown in the above figure the location Panjim (Goa) has the lowest rspm concentration followed by the locations Gangtok (Sikkim), Dharamshala (Himachal Pradesh), Pondicherry (Union Territory), Karaikal (belongs to Union Territory of Pondicherry). It can conclude that the states where these locations are located are free of RSPM contamination. Figure 16 shows the least value of RSPM concentration level in different states of India.
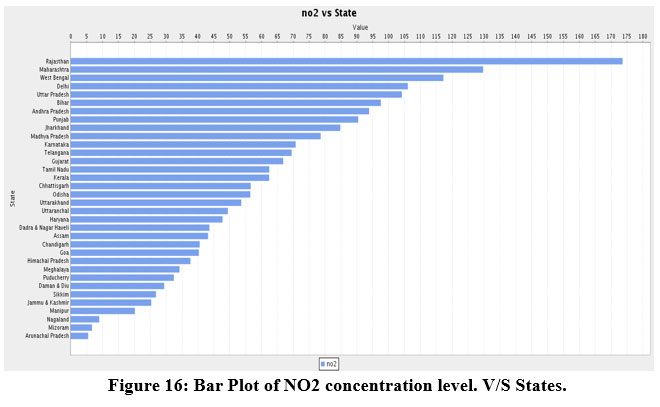 | Figure 16: Bar Plot of NO2 concentration level. V/S States.
|
The above bar plot shows that the state Rajasthan has the first rank in the case of NO2 concentration whereas the state Arunachal Pradesh is at the lowest level. Maharashtra is also facing the problem of NO2 pollution as it is ranked second in NO2 concentration level. West Bengal state and Delhi (National Capital Territory) follow Maharashtra in terms of NO2 concentration levels, ranking third and fourth, respectively. On the other hand, the states Arunachal Pradesh, Mizoram, Nagaland, and Manipur are free of NO2 contamination. Figure 17 shows the highest value of NO2 concentration level in different cities of India.
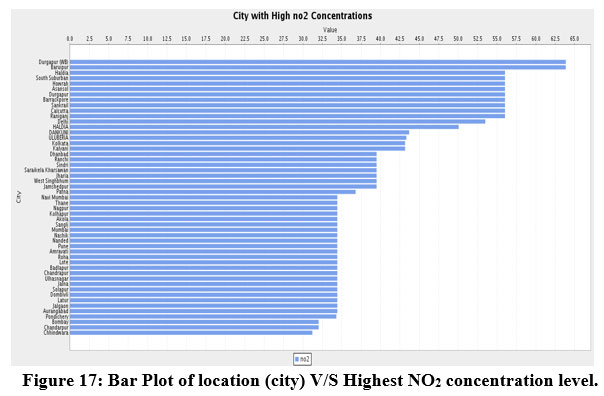 | Figure 17: Bar Plot of location (city) V/S Highest NO2 concentration level.
|
As shown in the above bar plot location Durgapur (West Bengal) has the highest concentration value of NO2 which is followed by Baruipur (West Bengal), Haldia (West Bengal), South Suburban (West Bengal), Hawrah (West Bengal). It is evident that all of the extremely polluted areas are located in the same state, West Bengal, which is also among the top three states for NO2 concentration levels. The majority of West Bengal's locations were affected by NO2 pollution. Figure 18 shows the least value of NO2 concentration level in different cities of India.
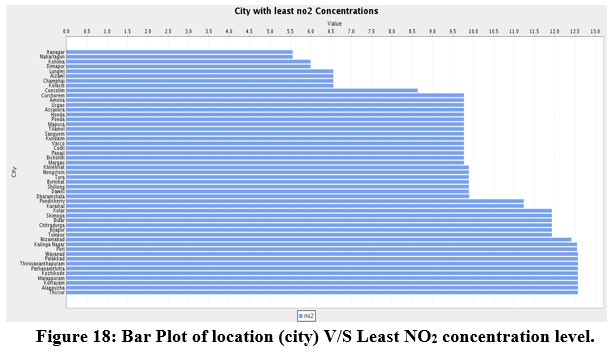 | Figure 18: Bar Plot of location (city) V/S Least NO2 concentration level.
|
According to the bar plot, the lowest NO2 concentration level is found in Itanagar (Arunachal Pradesh), followed by Naharlagun (Arunachal Pradesh), Kohima (Nagaland), and Dimapur (Nagaland). Figure 19 demonstrated the value of SPM in different states of India.
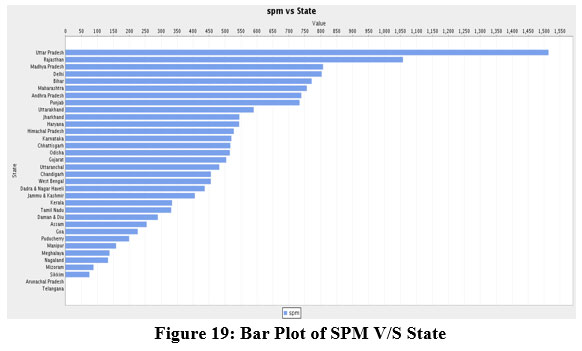 | Figure 19: Bar Plot of SPM V/S State.
|
Again, the state of Uttar Pradesh is at the first rank in terms of SPM concentration level which is followed by Rajasthan, Madhya Pradesh, and Delhi. Here the state of Sikkim is at the lowest level. For the states of Arunachal Pradesh and Telangana, there are no SPM concentration values available. There are null values for SPM in these states, not zero values. Figure 20 shows the highest value of SPM concentration level in different states of India.
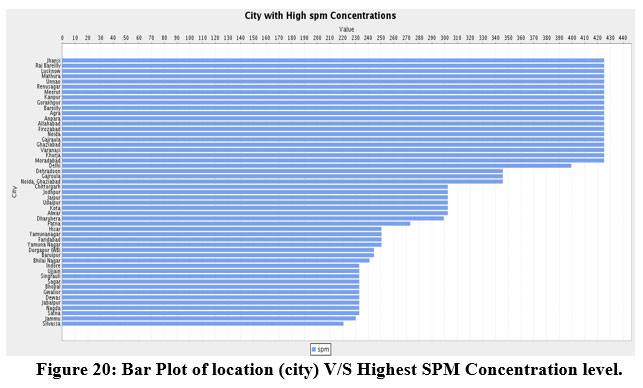 | Figure 20: Bar Plot of location (city) V/S Highest SPM Concentration level.
|
As shown in the above bar plot, the locations Jhansi (Uttar Pradesh), Raebareli (Uttar Pradesh), Lucknow (Uttar Pradesh), Mathura (Uttar Pradesh), and Unnao (Uttar Pradesh) are the top five locations with the highest SPM concentration values and all belong to the same state Uttar Pradesh, which is ranked first in terms of SPM pollution (as shown in bar plot of state vs. spm concentration level). This indicates that Uttar Pradesh is suffering from a serious SPM pollution problem. Figure 21 shows the least value of SPM concentration level in different cities of India.
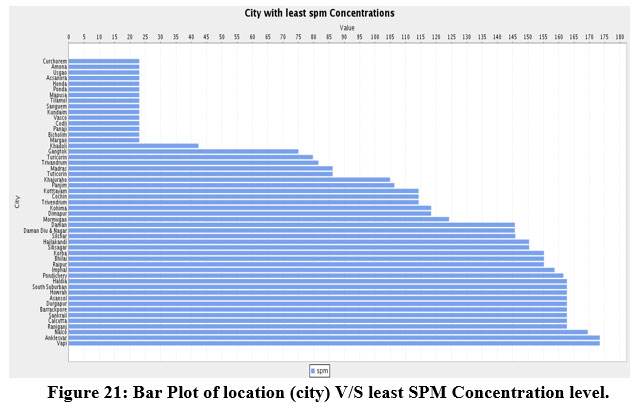 | Figure 21: Bar Plot of location (city) V/S least SPM Concentration level.
|
Looking at the results shown in the above bar plot, it can observe that the areas Curchorem (Goa), Amona (Goa), Usgao (Goa), Assonora (Goa), and Honda (Goa) have the lowest SPM concentration levels, and it all belong to the same state Goa. This means that the state of Goa is free from SPM contamination. Figure 22 demonstrated the value of SO2 in different states of India.
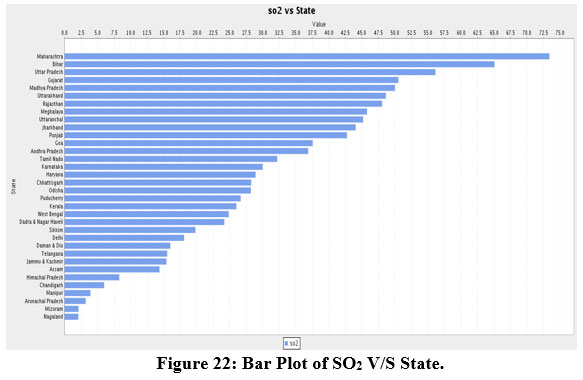 | Figure 22: Bar Plot of SO2 V/S State.
|
As per the bar plot, Maharashtra has the highest concentration level of SO2 followed by Bihar, Uttar Pradesh, Gujarat, and Uttarakhand. Surprisingly, Delhi does not rank among the top five states in terms of SO2 concentrations, despite being among the top five states in terms of other pollutants. Among all the states, Nagaland has the lowest SO2 concentration. Figure 23 shows the highest value of SO2 concentration levels in different cities of India.
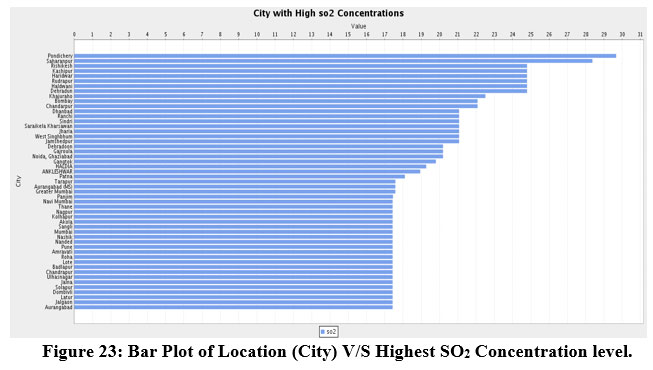 | Figure 23: Bar Plot of Location (City) V/S Highest SO2 Concentration level.
|
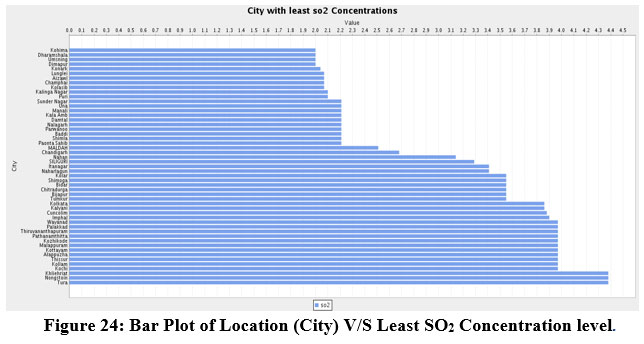
According to the bar plot above, the top five locations with greater SO2 concentration levels are Pondicherry (Union Territory), Saharanpur (Uttar Pradesh), Rishikesh (Uttarakhand), Kashipur (Uttarakhand), and Haridwar (Uttarakhand). Figure 24 shows the least value of SO2 concentration level in different cities of India.
.jpg) | Figure 24: Bar Plot of Location (City) V/S Least SO2 Concentration level.
|
The top five cities with the lowest SO2 concentration readings are Kohima in Nagaland, Dharamshala in Himachal Pradesh, Umpling in Meghalaya, Dimapur in Nagaland, and Konark in Odisha. Figure 25 demonstrated the value of PM2.5 in different states of India.
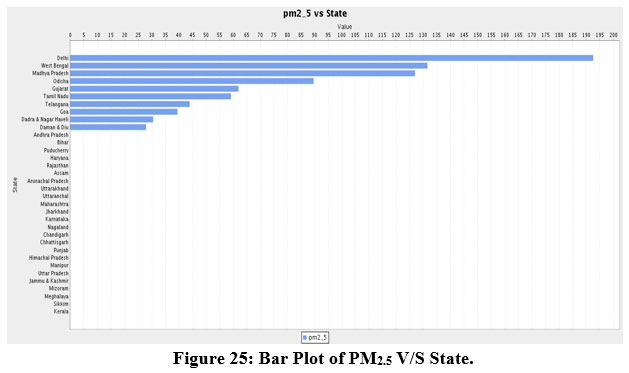 | Figure 25: Bar Plot of PM2.5 V/S State.
|
There are a lot of null values of PM2.5 in the dataset, as demonstrated in the bar plot. For all states of India, the data of PM2.5 is not available. Only the states Delhi (NCT), West Bengal, Madhya Pradesh, Odisha, Gujarat, Tamil Nadu, Telangana, Goa, Dadra and Nagar Haweli, and Daman and Diu have the data for PM2.5. Again, Delhi came out on top among these states. Figure 26 shows the highest value of PM2.5 concentration level in different cities of India.
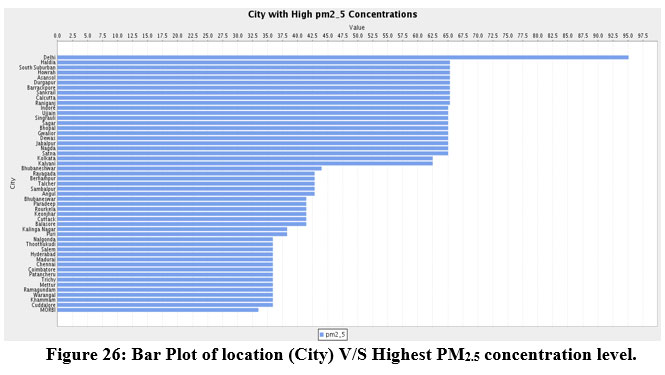 | Figure 26: Bar Plot of location (City) V/S Highest PM2.5 concentration level.
|
According to the above bar plot, Delhi has the highest PM2.5 concentration level which is not surprising as Delhi ranks first among the top 10 most polluted cities in the world (Hindustan Times News 2021), followed by Haldia in the state of West Bengal, South Suburban in the state of West Bengal, and Hawrah in the state of West Bengal. The state of West Bengal has the most locations with elevated PM2.5 levels. Figure 27 shows the least value of PM2.5 concentration level in different cities of India.
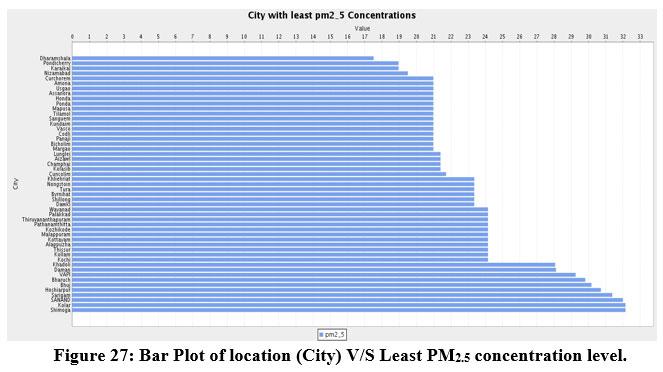 | Figure 27: Bar Plot of location (City) V/S Least PM2.5 concentration level.
|
Dharamshala, Pondicherry, Karalka, Nizamabad, Curchorem in Goa, Amona in Goa, Usgao in Goa, and Assonora in Goa are the localities with the lowest PM2.5 concentration readings. The accompanying bar plot, as well as bar plots of various contaminants, show the consequences that Goa is the state where most outdoor air pollutants are not present.
Conclusion
According to a report published in the Hindustan Times on November 13, 2021, India has three cities in the top ten most polluted cities in the world, with Delhi at the top of the list. This suggests that India has a significant problem with pollution in the atmosphere. Furthermore, air pollution has major health consequences in India, potentially leading to a high mortality and morbidity rate. Pollution was not a severe concern from the years 1988 to 2004 according to a graph of all pollutants vs. year. However, between the years 2005 and 2011, there was a considerable increase in air pollution concentration levels, particularly PM2.5. The states of Delhi, Uttar Pradesh, West Bengal, and Maharashtra have the highest levels of pollution, while Andhra Pradesh, Sikkim, Mizoram, and Manipur are the least polluted states of India. The government of India should take immediate action against the highly polluted states. From the perspective of the negative health effects of air pollution, it can investigate the relationship between air pollution data and morbidity and death statistics owing to various diseases in the future.
Conflict of Interest
The authors declare no conflict of interest.
Funding Sources
The authors received no financial support for the research, authorship, and/or publication of this article.
References
- L. L. Chen, J. Xu, Q. Zhang, Q. H. Wang, Y. Q. Xue, and C. R. Ren, “Evaluating impact of air pollution on different diseases in Shenzhen, China,” IBM J. Res. & Dev., vol. 61, no. 6, p. 2:1-2:9, Nov. 2017, doi: 10.1147/JRD.2017.2713258.
CrossRef - X. Xia and L. Yao, “Spatio-Temporal Differences in Health Effect of Ambient PM 2.5 Pollution on Acute Respiratory Infection Between Children and Adults,” IEEE Access, vol. 7, pp. 25718–25726, 2019, doi: 10.1109/ACCESS.2019.2900539.
CrossRef - Qiumin Zhai, Lei Li, Yuan Yuan, and Zhiyong Guo, “Correlation analysis of air pollution and respiratory disease in City A,” in 2011 International Conference on Remote Sensing, Environment and Transportation Engineering, Nanjing, China, Jun. 2011, pp. 197–200. doi: 10.1109/RSETE.2011.5964249.
CrossRef - J. P. Keller et al., “A Unified Spatiotemporal Modeling Approach for Predicting Concentrations of Multiple Air Pollutants in the Multi-Ethnic Study of Atherosclerosis and Air Pollution,” Environmental Health Perspectives, vol. 123, no. 4, pp. 301–309, Apr. 2015, doi: 10.1289/ehp.1408145.
CrossRef - T. S. Brisimi, T. Xu, T. Wang, W. Dai, W. G. Adams, and I. Ch. Paschalidis, “Predicting Chronic Disease Hospitalizations from Electronic Health Records: An Interpretable Classification Approach,” Proc. IEEE, vol. 106, no. 4, pp. 690–707, Apr. 2018, doi: 10.1109/JPROC.2017.2789319.
CrossRef - D. Lee, A. Rushworth, and S. K. Sahu, “A Bayesian localized conditional autoregressive model for estimating the health effects of air pollution: A Bayesian Localized Conditional Autoregressive Model,” Biom, vol. 70, no. 2, pp. 419–429, Jun. 2014, doi: 10.1111/biom.12156.
CrossRef - N. T. T. Nhung, C. Schindler, T. M. Dien, N. Probst-Hensch, L. Perez, and N. Künzli, “Acute effects of ambient air pollution on lower respiratory infections in Hanoi children: An eight-year time series study,” Environment International, vol. 110, pp. 139–148, Jan. 2018, doi: 10.1016/j.envint.2017.10.024.
CrossRef - R. Beelen et al., “Effects of long-term exposure to air pollution on natural-cause mortality: an analysis of 22 European cohorts within the multicentre ESCAPE project,” The Lancet, vol. 383, no. 9919, pp. 785–795, Mar. 2014, doi: 10.1016/S0140-6736(13)62158-3.
CrossRef - M. Medina-Ramón, A. Zanobetti, and J. Schwartz, “The Effect of Ozone and PM10 on Hospital Admissions for Pneumonia and Chronic Obstructive Pulmonary Disease: A National Multicity Study,” American Journal of Epidemiology, vol. 163, no. 6, pp. 579–588, Mar. 2006, doi: 10.1093/aje/kwj078.
CrossRef - J. Loy-Benitez, P. Vilela, Q. Li, and C. Yoo, “Sequential prediction of quantitative health risk assessment for the fine particulate matter in an underground facility using deep recurrent neural networks,” Ecotoxicology and Environmental Safety, vol. 169, pp. 316–324, Mar. 2019, doi: 10.1016/j.ecoenv.2018.11.024.
CrossRef - M. Franklin, P. Koutrakis, and J. Schwartz, “The Role of Particle Composition on the Association Between PM2.5 and Mortality,” Epidemiology, vol. 19, no. 5, pp. 680–689, Sep. 2008, doi: 10.1097/EDE.0b013e3181812bb7.
CrossRef - H. Tsangari et al., “Extreme weather and air pollution effects on cardiovascular and respiratory hospital admissions in Cyprus,” Science of The Total Environment, vol. 542, pp. 247–253, Jan. 2016, doi: 10.1016/j.scitotenv.2015.10.106.
CrossRef - Z. Liu et al., “Does utilize WHO’s interim targets further reduce the risk - a meta-analysis on ambient particulate matter pollution and mortality of cardiovascular diseases,” Environmental Pollution, vol. 242, pp. 1299–1307, Nov. 2018, doi: 10.1016/j.envpol.2018.07.041.
CrossRef - J. P. Keller, M. Drton, T. Larson, J. D. Kaufman, D. P. Sandler, and A. A. Szpiro, “Covariate-adaptive clustering of exposures for air pollution epidemiology cohorts,” Ann. Appl. Stat., vol. 11, no. 1, Mar. 2017, doi: 10.1214/16-AOAS992.
CrossRef - W. Zhu, J. Wang, W. Zhang, and D. Sun, “Short-term effects of air pollution on lower respiratory diseases and forecasting by the group method of data handling,” Atmospheric Environment, vol. 51, pp. 29–38, May 2012, doi: 10.1016/j.atmosenv.2012.01.051.
CrossRef - Y. Chen, A. Ebenstein, M. Greenstone, and H. Li, “Evidence on the impact of sustained exposure to air pollution on life expectancy from China’s Huai River policy,” Proceedings of the National Academy of Sciences, vol. 110, no. 32, pp. 12936–12941, Aug. 2013, doi: 10.1073/pnas.1300018110.
CrossRef - Y.-C. Hong, J.-T. Lee, H. Kim, and H.-J. Kwon, “Air Pollution: A New Risk Factor in Ischemic Stroke Mortality,” Stroke, vol. 33, no. 9, pp. 2165–2169, Sep. 2002, doi: 10.1161/01.STR.0000026865.52610.5B.
- “Air Pollution and Health in India: A review of the current evidence and opportunities for the future”.
- A. Roy, T. Chandra, and A. Ratho, “Finding Solutions to Air Pollution in India: The Role of Policy, Finance, and Communities,” p. 20, 2020.
- “A Comprehensive Study of Air Pollution in India”, [Online]. Available: https://www.youthkiawaaz.com/2017/10/a-comprehensive-study-of-air-pollution-in-india/
- “Air Pollution in India Impact, policy analysis and remedial measures by governments”.
- K. P. Aparajita Chattopadhyay, “Household Energy Use and CO2 Emission: Differentials and Determinant in India”.
- Manisha Jain, “Drivers of change in India’s energy-related carbon dioxide emissions during 1990-2017,” WP-2020-019.
- K. R. Smith, S. Mehta, and M. Maeusezahl-Feuz, “Indoor air pollution from household use of solid fuels,” p. 60.
- Sumi Mehta Kalpana Balakrishnan and Priti Kumar, “Indoor Air Pollution Associated with Household Fuel Use in India.” The International Bank for Reconstruction and Development.
- A. Ghorani-Azam, B. Riahi-Zanjani, and M. Balali-Mood, “Effects of air pollution on human health and practical measures for prevention in Iran,” J Res Med Sci, vol. 21, no. 1, p. 65, 2016, doi: 10.4103/1735-1995.189646.
CrossRef - “Ambient Air Pollution by particulate matter position paper”.
- “Carbon Monoxide Poisoning,” p. 3.
- “Air Pollution in Delhi – An Analytical Study” http://www.cpcbenvis.nic.in/envis_newsletter/Air%20Quality%20of%20Delhi.pdf.
- Phukan, sagarmoy. "air quality monitoring in dehradun city and its impacts on health." phd diss., teri university, 2017.
- “Explore the Data | State of Global Air.” 2020. 2020. https://www.stateofglobalair.org/data/#/health/plot.
- “India Air Quality Data.” https://www.kaggle.com/datasets/shrutibhargava94/india-air-quality-data.


