Spatial and Temporal Rainfall Analysis of the Bidi Tobacco Growing Areas of India.
D. Damodar Reddy1
 , Chandrasekhara Rao1
, L. K. Prasad1
*
, J. Poorna Bindu1
, B. Krishna Kumari2
and T. Anuhya Jayapradha3
, Chandrasekhara Rao1
, L. K. Prasad1
*
, J. Poorna Bindu1
, B. Krishna Kumari2
and T. Anuhya Jayapradha3
1
Divided of Crop Chemistry and Soil Science,
ICAR CTRI,
Rajahmundry,
Andhra Pradesh
India
2
AINPT and PME Cell,
ICAR CTRI,
Rajahmundry,
Andhra Pradesh
India
3
AINPT,
ICAR CTRI,
Rajahmundry,
Andhra Pradesh
India
http://dx.doi.org/10.12944/CWE.18.1.7
Copy the following to cite this article:
Reddy D. D, Rao C, Prasad L. K, Bindu J. P, Kumari B. K, Jayapradha T. A. Spatial and Temporal Rainfall Analysis of the Bidi Tobacco Growing Areas of India. Curr World Environ 2023;18(1). DOI:http://dx.doi.org/10.12944/CWE.18.1.7
Copy the following to cite this URL:
Reddy D. D, Rao C, Prasad L. K, Bindu J. P, Kumari B. K, Jayapradha T. A. Spatial and Temporal Rainfall Analysis of the Bidi Tobacco Growing Areas of India. Curr World Environ 2023;18(1).
Download article (pdf)
Citation Manager
Publish History

Introduction
The largest commercial crop in India is tobacco, which is grown on 0.45 million hectares of land and yields 804 million kilogrammes yearly. Tobacco exports provide $5,540 billion in revenue for the country's economy, and excise taxes generate 22,737 billion and 28,277 crores respectively. It also ensures the livelihood of 45.7 million people. The unique feature of Indian tobacco is that different tobacco type’s viz., Flue-Cured Virginia, Burley, HDBRG, Oriental, Bidi, Cheroot, Natu, Pikka, Lanka, Chewing, Cigar Wrapper & Filler, and Hookah. Indian tobacco enjoys a competitive advantage on the global market thanks to its low production costs and offers consumers more "value for money" and to the availability of several tobacco leaf varieties. Besides its conventional use, tobacco is also exploited for phytochemicals and other value-added products such as Solanesol, proteins from green leaf, and oil from the seed.
Among the several types of tobacco, Bidi tobacco is a smoking type that occupies an area of 1,80,759 ha and with a production of 3,72,220 tons, cultivated in Gujarat (89.84 %), Karnataka (3.93 %), and Andhra Pradesh (6.23 %). There was a surge in Bidi tobacco cultivation from the year 2010-2011 i.e ? 60 % increase in area and production. (Fig. 1 and 2) because of an increase in demand for its various end uses. About 68% of the land in India is used to grow crops, which provide food for 60% of the country's animals and 40% of its people1. Monsoon adversities, such as heavy rainfall, drought, and cyclones are becoming frequent with varying intensities across India and causing crop damage. Extreme deviations from the typical monsoon pattern can have an impact on the economy, livelihoods, and food production. Unlike other commercial crops, tobacco leaf is the economic part, and its productivity is in danger to weather aberrations, and change in climate associated with raise in temperature, CO2, and changes rainfall distribution. In the recent past, extreme weather events such as prolonged drought, erratic rainfall, and unprecedented heavy rains led to floods posing a serious threat to Bidi tobacco production. The present investigation was taken up to study the variation and trend in rainfall, its impact on crop growth or yield to formulate suitable strategies and research initiatives to mitigate /overcome its impact on the Bidi tobacco productivity.
To understand the hydro-meteorological aspects of a region or the entire world, climate trend analysis is used. Numerous studies 2, 3, 4, 5, 6, were conducted to assess rainfall distribution and trend spatially and temporally throughout the world, and various regions in India 7,8,9,10,11,12. Parametric and non-parametric techniques were employed to analyse trend of the rainfall. The non-parametric test is appropriate for independent datasets with outliers while the parametric test presupposes that the data are normal.Slope estimator (Sen's test - SSE)13and the Mann-Kendall trend test 13, 14 are employed to analyse local & regional rainfall trends 15. The local level rainfall dynamics especially is unique and novel approach which helps in developing strategies to prove production while escaping the stress due to moisture in season.
 | Figure 1: Bidi tobacco area trends in India.
|
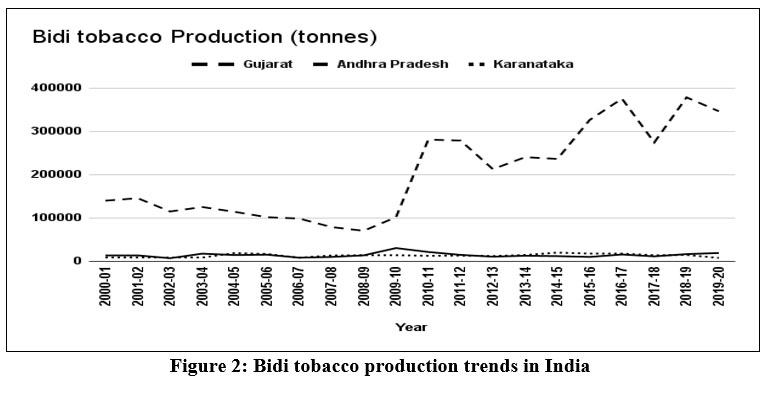 | Figure 2: Bidi tobacco production trends in India.
|
Materials and methods
The trend in regular rainfall of Bidi tobacco growing areas of Gujarat, Andhra Pradesh, and Karnataka was studied for detecting any aberration over the years. The statistical methods employed were Mann-Kendall analysis to establish or detect trend and Sen’s technique for assessing the slope in a rainfall trend. The data sets of monthly rainfall from a time series of 1990 – 2020 (30 years) and 1980-2020 (40 years) were collected from the research centres Nandyal, Anand and Nippani situated in Bidi tobacco growing regions of Andhra Pradesh, Gujarat and Karnataka, respectively.
Trend analysis of rainfall
Periodical rainfall data from the above mentioned three Bidi tobacco growing areas was analysed to detect the dynamics. The Mann–Kendall technique was employed to identify the presence of any rainfall trend in a time series16 and to establish the magnitude of change the Sen’s slope method was employed. 90, 95 and 99 % confidence levels (p < 0.10, p < 0.05 and p < 0.01) were tolerance levels to categorise the significance of +ve and -ve rainfall variation. Numerous scholars employed this approach to find variations in temporal hydrological data (groundwater level), rainfall and stream flow, etc 17,18,19, 20, 21,22,23,24,25,26,27,28.
The ranks that every data point received were used in the test. The initial and final values of Mann-Kendall statistic's (S) is the result derived from deviations increases and decreases 29, 30

Signum function (sgn) (x) = 1 for x > 0; Signum function (x) = 0 for x = 0; Signum function (x) = -1 for x < 0. The z-statistic = | S | /s 0.5. A positive value of S implies an increasing trend while a negative value a decreasing trend.
Test significance (z) was compared with table values at confidence intervals 99 % (2.576), 95 % (1.960), and 90 % (1.645), respectively.
The real magnitude of change per year of an existing trend estimated using Sen’s slope 31 following formula:
f (t) = Slope (Q) t + B(Constant) --------- (1)
Determined slopes of each pair of data to get the slope estimate(Q): When j>k, Q = xj-xk/ j-k: If the time series has n values for xj, then the number of N = n (n-1)/2, and slope estimations Qi are obtained.
The average of N readings of Qi serves as Sen's estimate of the slope. Qi (N values) is ranked from smallest to highest.
The Sen’s estimator calculated using the formula given as under:
Q = if N number is odd then it is Q [(N + 1) / 2]
(or else)
Q = if N number is even then it is ½ (Q [N / 2] + Q [(N + 2)]
Results and discussion
Periodical rainfall of three distinctive Bidi production zones of Gujarat, Karnataka, and Andhra Pradesh, where Bidi tobacco is grown have shown different trends.
Rainfall analysis of Bidi growing regions of Gujarat:
Monthly rainfall distribution in Bidi tobacco growing areas of Gujarat was depicted graphically (Fig. 3) taking the percentage of total monthly rainfall against the years from 1990 to 2020. The maximum rainfall is observed throughout June, July, August, and September whereas lowest rainfall was observed during January, February, March, April, November, and December.
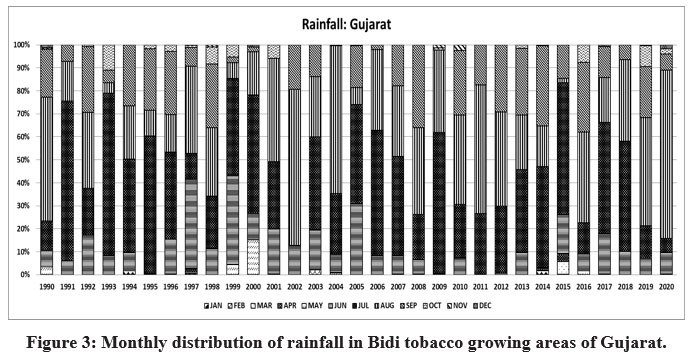 | Figure 3: Monthly distribution of rainfall in Bidi tobacco growing areas of Gujarat.
|
Based on Mann-Kendall trend analysis, it was observed that a positive trend was obtained in March, April, August, September, November, and December, in other months negative trends were observed. The -ve trends in June and July will affect the nursery raising. During the crop growth period, the trend is mostly positive except in October, the magnitude of change was negligible. However, alternative supplemental irrigation is essential and is to be planned during water deficit periods of October. (Table 1, Fig. 4 -5).
At the harvesting stage i.e., from January to April the Mann-Kendall constants (Z) were negative during January and February, however, they are not going to influence significantly as the magnitude of change was zero.
Table 1: Rainfall trend and Slope estimates of regular rainfall (1990-2020) at Bidi tobacco growing centre Anand, Gujarat.
Month | Starting Year | End Year | Mean (mm) | Standard Deviation (n-1) | Z value for Mann-Kendall Trend (S) | Q (Estimate of Sen slope) (mm per year) | B (Constant) |
|---|---|---|---|---|---|---|---|
JAN | 1990 | 2020 | 1.6 | 4.9 | -0.65 | 0.000 | 0.00 |
FEB | 1990 | 2020 | 0.8 | 4.2 | -0.44 | 0.000 | 0.00 |
MAR | 1990 | 2020 | 1.3 | 5.4 | 0.25 | 0.000 | 0.00 |
APR | 1990 | 2020 | 1.5 | 4.6 | 0.59 | 0.000 | 0.00 |
MAY | 1990 | 2020 | 5.0 | 14.0 | -0.36 | 0.000 | 0.00 |
JUN | 1990 | 2020 | 108.0 | 112.8 | -0.44 | -0.600 | 104.80 |
JUL | 1990 | 2020 | 309.0 | 183.0 | -0.03 | -0.321 | 254.27 |
AUG | 1990 | 2020 | 295.0 | 190.7 | 1.56 | 5.336 | 226.94 |
SEP | 1990 | 2020 | 161.9 | 124.0 | 0.42 | 0.900 | 144.50 |
OCT | 1990 | 2020 | 15.8 | 28.8 | -0.51 | 0.000 | 0.80 |
NOV | 1990 | 2020 | 1.8 | 4.7 | 0.24 | 0.000 | 0 |
DEC | 1990 | 2020 | 1.4 | 4.1 | 0.17 | 0.000 | 0 |
Note: * Confidence interval for level of significance is at 99 %.
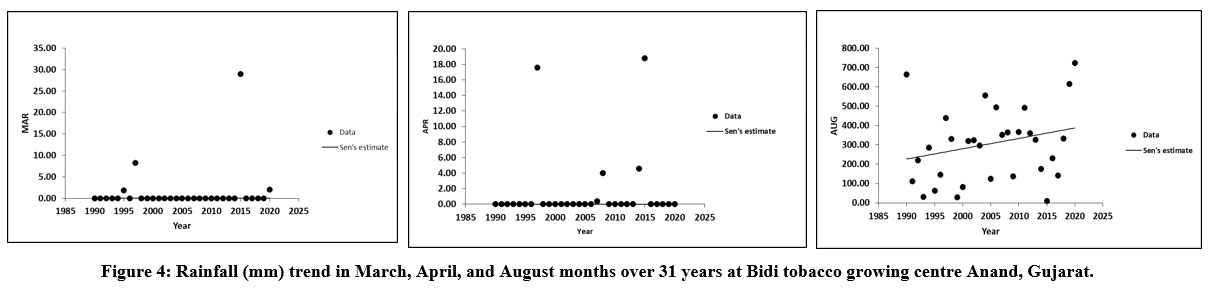 | Figure 4: Rainfall (mm) trend in March, April, and August months over 31 years at Bidi tobacco growing centre Anand, Gujarat.
|
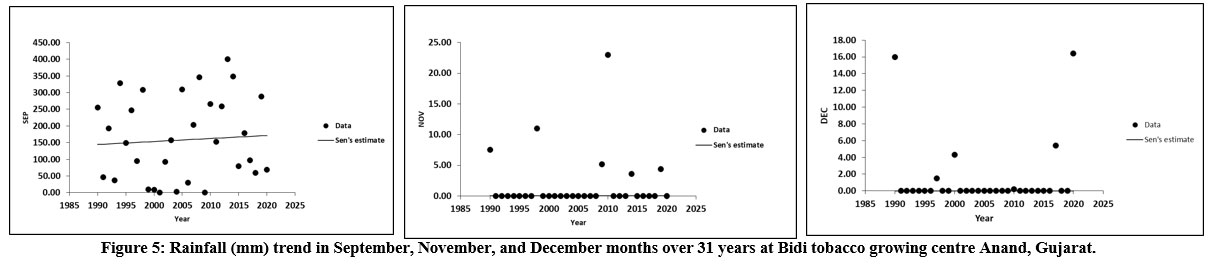 | Figure 5: Rainfall (mm) trend in September, November, and December months over 31 years at Bidi tobacco growing centre Anand, Gujarat.
|
Rainfall analysis of the Bidi growing region of Karnataka
The monthly distribution of rainfall in Bidi tobacco growing areas of Karnataka was analyzed and illustrated graphically (Fig. 6) by taking the percentage of total monthly rainfall against the years from 1990 to 2020. The maximum rainfall was observed in June, July, August, September, and October whereas lowest rainfall was observed in January, February, and December.
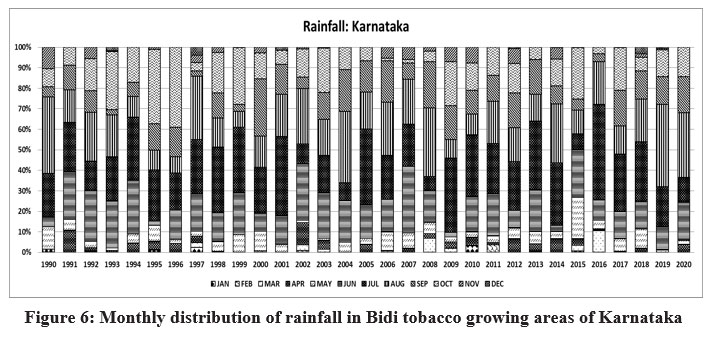 | Figure 6: Monthly distribution of rainfall in Bidi tobacco growing areas of Karnataka
|
The Mann-Kendall analysis (Z-test) detected a positive trend from February to October and negative during November, December and January. The magnitude of the negative trend was high in January while the positive trend was high in September and significant. (Table.2., Fig.7 & 8). The period of negative trend has coincided with the harvesting and hence the crop may not be affected significantly. However, high rainfall during the crop growth period causes a detrimental effect on crop growth. To mitigate the inundation proper drainage facility should be created through field channels to flush out excess water to avoid saturation at the root zone of the plant as this crop is extremely sensitive to poor aeration and anaerobic conditions.
Table 2: Rainfall trend and Slope estimates of regular rainfall (1980-2020) at Bidi tobacco growing centre Nipani, Karnataka.
Time series | First year | Last Year | Mean (mm) | Standard Deviation (n-1) | Z value for Mann-Kendall Trend (S) | Q (Estimate of Sen slope) (mm per year) | B (Constant) |
|---|---|---|---|---|---|---|---|
JAN | 1980 | 2020 | 2.5 | 6.9 | -1.19 | 0.000 | 0.00 |
FEB | 1980 | 2020 | 0.9 | 4.3 | 0.21 | 0.000 | 0.00 |
MAR | 1980 | 2020 | 8.5 | 19.5 | 0.86 | 0.000 | 0.00 |
APR | 1980 | 2020 | 24.4 | 25.6 | 0.54 | 0.116 | 15.87 |
MAY | 1980 | 2020 | 43.7 | 31.6 | 0.35 | 0.125 | 34.80 |
JUN | 1980 | 2020 | 141.2 | 78.7 | 0.66 | 0.836 | 117.22 |
JUL | 1980 | 2020 | 205.4 | 105.6 | 1.80+ | 2.545 | 146.80 |
AUG | 1980 | 2020 | 170.5 | 103.7 | 1.77+ | 1.832 | 106.29 |
SEP | 1980 | 2020 | 105.1 | 62.2 | 2.28* | 1.954 | 55.97 |
OCT | 1980 | 2020 | 105.1 | 85.0 | 1.94+ | 1.927 | 44.04 |
NOV | 1980 | 2020 | 20.3 | 26.3 | -0.56 | 0.000 | 6.3 |
DEC | 1980 | 2020 | 4.4 | 10.3 | -0.25 | 0.000 | 0 |
Note: * Confidence interval for level of significance is at 99 %
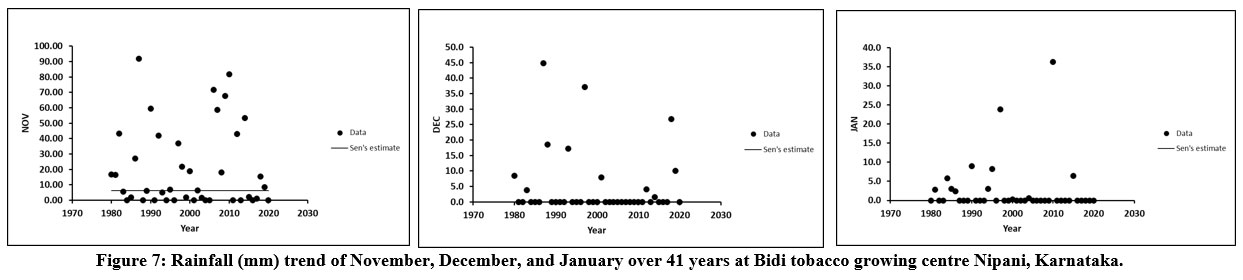 | Figure 7: Rainfall (mm) trend of November, December, and January over 41 years at Bidi tobacco growing centre Nipani, Karnataka.
|
 | Figure 8: Rainfall (mm) trend of August, Septembe,r and October over 41 years at Bidi tobacco growing centre Nipani, Karnataka.
|
Rainfall analysis of Bidi growing regions of Andhra Pradesh
The monthly distribution of rainfall in Bidi tobacco growing areas of Andhra Pradesh was observed and was depicted graphically (Fig.9) taking the percentage of total monthly rainfall against the years from 1990 to 2020. The maximum rainfall was recorded in June, July, August, September and October whereas lowest rainfall was recorded in January, February, March and December.
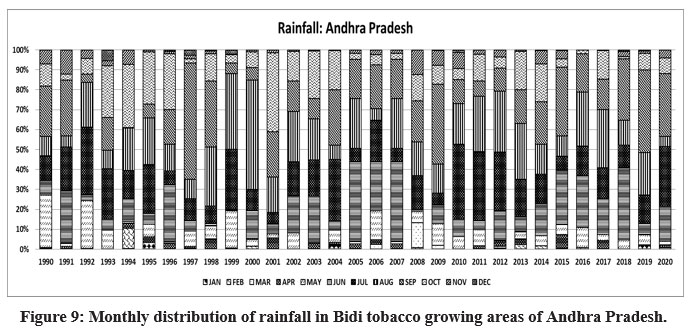 | Figure 9: Monthly distribution of rainfall in Bidi tobacco growing areas of Andhra Pradesh.
|
The trend analysis of rainfall in Bidi tobacco growing Andhra Pradesh revealed that, the +ve trend was observed in January, February, March, June, August and September, whereas negative trends were recorded in April, May, July, October, November and December. The negative ‘Z’ values were very much high in October and November which coincided crop growth period. The negative trend in July will coincide with Bidi tobacco nursery, however the magnitude was less. The positive trend in rainfall during June is high and the same can be utilized for nursery during July-August through proper moisture conservation measures. The negative trends in September and October, might significantly affect the crop growth as they coincided with crop growth (Table.03, Fig.10 and 11).
Table 3: Rainfall trend and Slope estimates of regular rainfall (1990-2020) at Bidi tobacco growing centre Nandyal, Andhra Pradesh
Time series | First year | Last Year | Mean (mm) | Standard Deviation (n-1) | Z value for Mann-Kendall Trend (S) | Q (Estimate of Sen slope) (mm per year) | B (Constant) |
JAN | 1990 | 2020 | 2.6 | 7.2 | 0.87 | 0.000 | 0.00 |
FEB | 1990 | 2020 | 4.4 | 14.2 | 0.05 | 0.000 | 0.00 |
MAR | 1990 | 2020 | 5.4 | 18.6 | 0.88 | 0.000 | 0.00 |
APR | 1990 | 2020 | 15.9 | 18.6 | -0.02 | 0.000 | 11.00 |
MAY | 1990 | 2020 | 54.7 | 53.5 | -1.29 | -1.073 | 59.91 |
JUN | 1990 | 2020 | 131.3 | 129.3 | 1.48 | 2.540 | 50.84 |
JUL | 1990 | 2020 | 152.6 | 99.1 | -0.10 | -0.090 | 137.23 |
AUG | 1990 | 2020 | 181.5 | 146.0 | 0.19 | 0.429 | 138.49 |
SEP | 1990 | 2020 | 181.2 | 126.9 | 1.14 | 3.000 | 98.40 |
OCT | 1990 | 2020 | 107.5 | 83.5 | -1.33 | -2.473 | 137.13 |
NOV | 1990 | 2020 | 28.6 | 30.3 | -0.76 | -0.243 | 20.1 |
DEC | 1990 | 2020 | 4.1 | 8.8 | -0.41 | 0.000 | 0.8 |
Note: * Confidence interval for level of significance is at 99 %
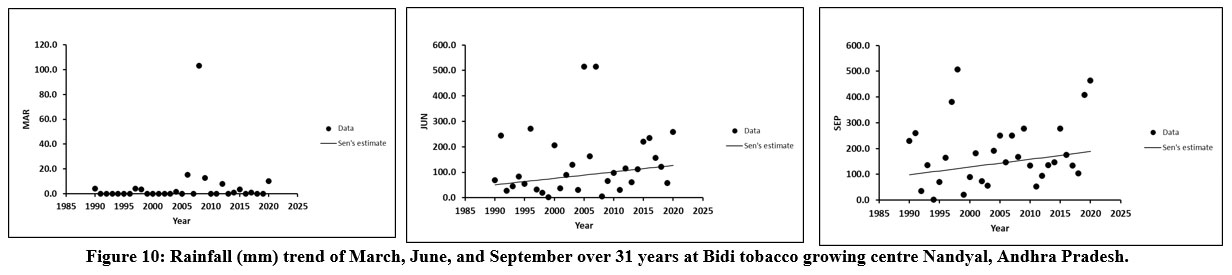 | Figure 10: Rainfall (mm) trend of March, June, and September over 31 years at Bidi tobacco growing centre Nandyal, Andhra Pradesh.
|
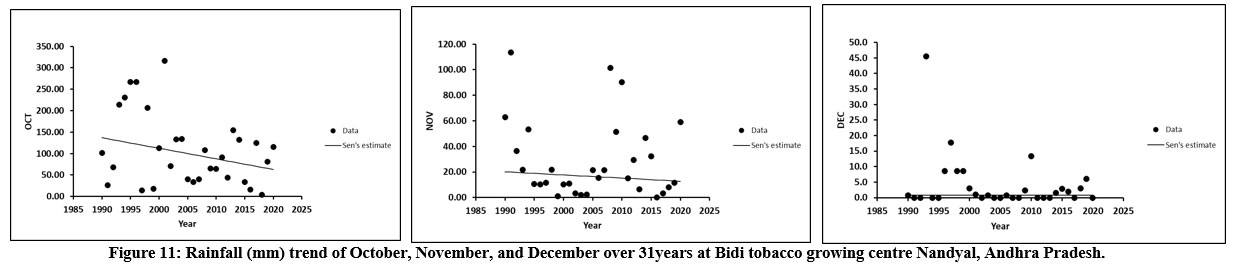 | Figure 11: Rainfall (mm) trend of October, November, and December over 31years at Bidi tobacco growing centre Nandyal, Andhra Pradesh.
|
Effect of Rainfall trends on Bidi tobacco nursery
Nursery in Bidi tobacco is raised from July- August in Gujarat and Karnataka and July to September in Andhra Pradesh. A graph (Fig. 12, 13 and 14) was depicted by taking the average rainfall obtained during the nursery period of Bidi tobacco over the years (1990 to 2020). In Gujarat, a negative rainfall trend is noticed in July, whereas a positive rainfall trend is observed in August. Even though the extent of deviation is negligible in July, it suggests raising the nursery in the second fortnight of July. In Karnataka, the trend is positive in July and August. The extent of positive deviation is more in these months. They may fail of nurseries sometimes. Given this management interventions to mitigate the excess rainfall through protected nursery raising, provision to drain out excess moisture, raised seed beds, and mulches are to be followed invariably during nursery. In Andhra Pradesh, the trend is positive during August and September. However, September month may witness excess rainfall as evidenced by a high ‘S’ value, which needs to be addressed through mitigation of excess moisture conditions.
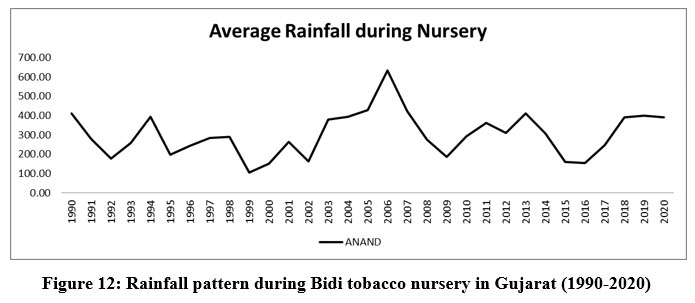 | Figure 12: Rainfall pattern during Bidi tobacco nursery in Gujarat (1990-2020).
|
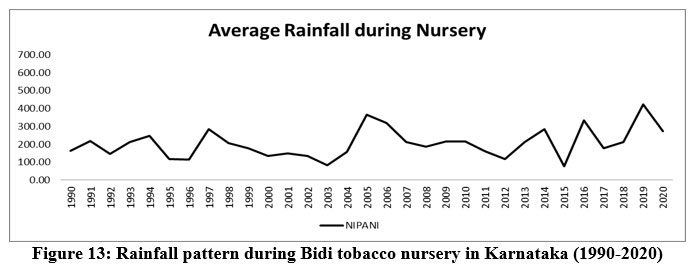 | Figure 13: Rainfall pattern during Bidi tobacco nursery in Karnataka (1990-2020)
|
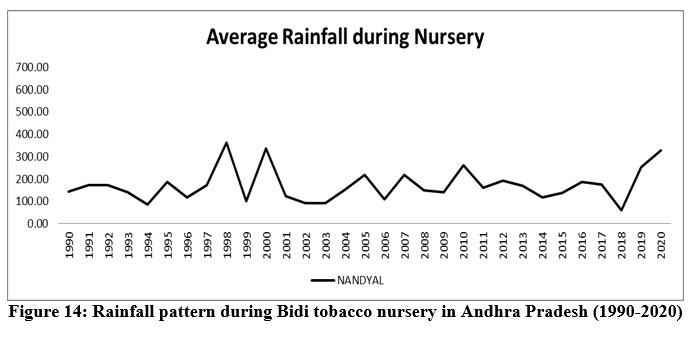 | Figure 14: Rainfall pattern during Bidi tobacco nursery in Andhra Pradesh (1990-2020)
|
Effect of Rainfall trends on Bidi tobacco crop growth:
The active crop growth periods in Bidi tobacco are September-November in Gujarat and Karnataka and October to December in Andhra Pradesh. A graph (Fig. 15, 16 and 17) was depicted by taking the average rainfall obtained during the crop growth period of Bidi tobacco over the years (1990 to 2020). Among the three Bidi tobacco zones, the rainfall trend is positive during the crop growth period in Karnataka, it is inferred that, extent of deviation is extreme highly during August, September and October which results in crop failure occasionally. The soils being heavy, excess rainfall will cause inundation and affects root growth. Hence contingency measures are to be prepared and kept ready for managing the excess water stress. In Gujarat, the active growth stage coincides with positive rainfall pattern except in October. However, the extent of deviation is negligible and is not going to affect crop growth. Among the three distinctive Bidi tobacco zones, Bidi tobacco in Andhra Pradesh experienced moisture stress during the crop growth period. Hence moisture conservation/ drought mitigation strategies are to be followed to reduce the impact of the moisture stress. The extent of deviation is more during October and November, when the crop growth is between 40 to 70 days. Drought mitigation strategies viz., in-situ moisture conservation, mulching and, deep planting are to be followed for reducing the impact of stress.
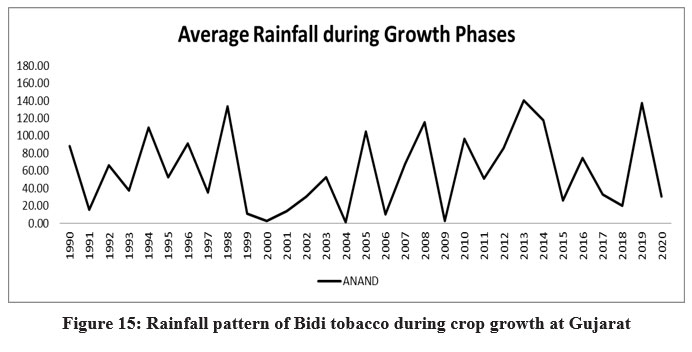 | Figure 15: Rainfall pattern of Bidi tobacco during crop growth at Gujarat
|
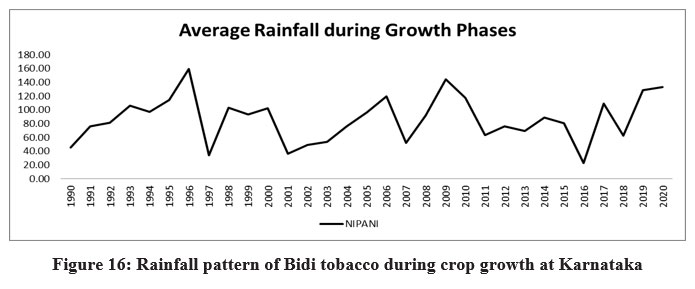 | Figure 16: Rainfall pattern of Bidi tobacco during crop growth at Karnataka.
|
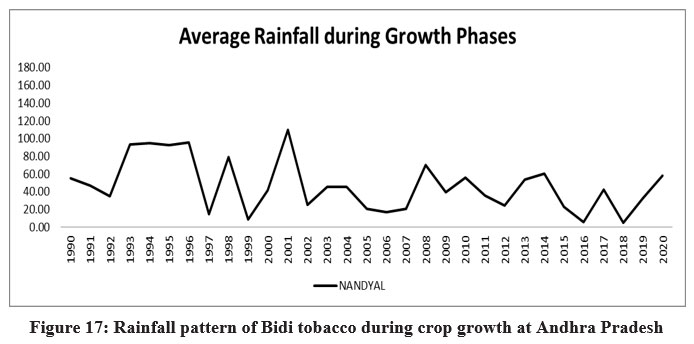 | Figure 17: Rainfall pattern of Bidi tobacco during crop growth at Andhra Pradesh.
|
Conclusion
The study concludes that, among the three Bidi tobacco production zones, the rainfall trend in Gujarat is congenial to the Bidi crop. However, an excess rainfall trend in Karnataka, and a negative rainfall trend in Andhra Pradesh during nursery and main crop were detected.
The interventions i.e., improving field drainage for mitigating the effect of excess rainfall such as waterlogging leading to the prolonged saturated root zone and giving critical irrigation using stored rainwater in a farm pond to avoid moisture stress during the Bidi crop growth in Karnataka and Andhra Pradesh respectively must be taken up by the Bidi growers to avoid the yield loss and poor leaf quality.
Acknowledgements
Authors are very much thankful to ICAR, Ministry of agriculture and farmers welfare, Government of India for providing facilities through AINPT, ICAR - CTRI, Rajahmundry for the study. We are grateful to all the Unit Heads of the Bidi tobacco research centres viz., Anand, Gujarat; Nipani, Karnataka and Nandyal, Andhra Pradesh for providing the meteorological data for the study.
Conflict of Interest
On behalf of all authors, the corresponding author states that there is no conflict of interest.
Funding Sources
There is no funding or financial support for this research work.
References
- Praveen, B., & Sharma, P. Climate change and its impacts on Indian agriculture: An econometric analysis. Journal of Public Affairs, 2020; 20(1), e1972.
CrossRef - Bari, S. H., Rahman, M. T. U., Hoque, M. A., & Hussain, M. M. Analysis of seasonal and annual rainfall trends in the northern region of Bangladesh. Atmospheric Research, 2016; 176, 148-158.
CrossRef - Hasan, M. K., & Kumar, L. Yield trends and variabilities explained by climatic change in coastal and non-coastal areas of Bangladesh. Science of The Total Environment, 2021; 795, 148814.
CrossRef - Huang, S., Krysanova, V., & Hattermann, F. Projections of climate change impacts on floods and droughts in Germany using an ensemble of climate change scenarios. Regional Environmental Change, 2015; 15(3), 461-473.
CrossRef - Miró, J. J., Estrela, M. J., Caselles, V., & Gomez, I. Spatial and temporal rainfall changes in the Júcar and Segura basins (1955–2016): Fine?scale trends. International Journal of Climatology, 2018; 38(13), 4699-4722.
CrossRef - Wang, H., Liu, H., Cao, G., Ma, Z., Li, Y., Zhang, F., ... & He, J. S.S. Alpine grassland plants grow earlier and faster, but biomass remains unchanged over 35 years of climate change. Ecology Letters, 2020; 23(4), 701-710.
CrossRef - Malik A, Kumar A, Guhathakurta P, Kisi O. Spatial-temporal trend analysis of seasonal and annual rainfall (1966–2015) using innovative trend analysis method with significance test. Arab J Geosci 2019; 12:328. https://doi. org/10.1007/s12517-019-4454-5.
CrossRef - Mondal, A., Khare, D., & Kundu, S. Spatial and temporal analysis of rainfall and temperature trend of India. Theoretical and applied climatology, 122(1), 2015; 143-158.
CrossRef - Sharma, C. S., Panda, S. N., Pradhan, R. P., Singh, A., & Kawamura, A.A Precipitation and temperature changes in eastern India by multiple trend detection methods. Atmospheric research, 180, 2016; 211-225.
CrossRef - Prasad, L. K, S. Ramakrishnan, M. Mahadeva Swamy and D. Damodar Reddy. Trend analysis if Rainfall in FCV tobacco growing area of Hunsur under Karnataka Light Soils. Tobacco Res. 2019:45(1):1-5.
- Mehta, D., & Yadav, S. M. (2022). Temporal analysis of rainfall and drought characteristics over Jalore District of SW Rajasthan. Water Practice and Technology, 17(1), 254-267.
CrossRef - Mehta, D., Waikhom, S., Yadav, V., Lukhi, Z., Eslamian, S., & Furze, J. N. (2022). Trend Analysis of Rainfall: A Case Study of Surat City in Gujarat, Western India. In Earth Systems Protection and Sustainability: Volume 2 (pp. 191-202). Cham: Springer International Publishing.
CrossRef - Sen P.K. Estimates of the regression coefficient based on Kendall’s tau. J Am Stat Assoc 1968; 63:1379–1389.
CrossRef - Kendall MG. Rank correlation methods, 1975; 4th eds. Charles Griffin, London.
- Mann, H. B. Nonparametric tests against trend. Econometrica: Journal of the econometric society, 1945; 245-259.
CrossRef - Gajbhiye, S., Meshram, C., Mirabbasi, R., & Sharma, S. K. Trend analysis of rainfall time series for Sindh River basin in India. Theoretical and applied climatology, 2016; 125(3), 593-608.
CrossRef - Ogunrinde, A. T., Oguntunde, P. G., Akinwumiju, A. S., & Fasinmirin, J. T. Analysis of recent changes in rainfall and drought indices in Nigeria,1981–2015. Hydrological Sciences Journal, 2019; 64(14), 1755-1768.
CrossRef - Sneyers, R. On the Statistical Analysis of series of observation. 1990: WMO Tech. Note No. 143, Geneva.
- Serrano, A., V. L. Mateos and J. A. Garcia. Trend analysis of monthly precipitation over the Iberian Peninsula for the period 1921– 1995. Physics and Chemistry of the Earth. 1999: 24: 85–90.
CrossRef - Brunetti, M., L. Buffoni, M. Maugeri and T. Nanni. Precipitation intensity trends in northern Italy. Int. J. Climatology. 2000: 20: 1017– 1031.
CrossRef - Subash, N. and H. S. Ram Mohan. Trend detection in rainfall and valuation of standardized precipitation index as a drought assessment index for rice–wheat productivity over IGR in India. Int J. Climatol. 2010: 31: 1694– 1709. DOI: 10.1002/joc.2188.
CrossRef - Mehta, D. J., & Yadav, S. M. (2023). Meteorological drought analysis in Pali District of Rajasthan State using standard precipitation index. International Journal of Hydrology Science and Technology, 15(1), 1-10.
CrossRef - Shaikh, M. M., Lodha, P., Lalwani, P., & Mehta, D. (2022). Climatic projections of Western India using global and regional climate models. Water Practice & Technology, 17(9), 1818-1825.
CrossRef - Jana, S., Das, M., Roy, D., Das, S., & Mazumdar, A. (2015). Simulation of climate change impact in a river basin in Eastern India. International Journal of Hydrology Science and Technology, 5(4), 314-332.
CrossRef - Zam, P., Shrestha, S., & Budhathoki, A. (2021). Assessment of climate change impact on hydrology of a transboundary river of Bhutan and India. Journal of water and climate change, 12(7), 3224-3239.
CrossRef - Subash, N., A. K. Sikka and H. S. Ram Mohan. An investigation into observational characteristics of rainfall and temperature in Central Northeast India—a historical perspective 1889 – 2008. Theor. and Appl. Climatol. 2010: DOI: 10.1007/s00704-010- 0299-2.
CrossRef - Chiew, F. and L. Sirivardena. Trend: trend/ change detection software manual, www.toolkit.net.au/trend, CRC for Catchment Hydrology, 2005: 29.
- Shahid, S. Rainfall variability and the trends of wet and dry periods in Bangladesh. International Journal of Climatology, 2010; 30(15), 2299-2313.
CrossRef - Sahoo, S., Dey, S., Dhar, A., Debsarkar, A., & Pradhan, B. (2019). On projected hydrological scenarios under the influence of bias-corrected climatic variables and LULC. Ecological Indicators, 106, 105440.
CrossRef - Prasad, L. K., R. Srinivasulu, A. R. Panda, K. C. Chenchaiah and M. Prabhakar. Rainfall trend, distribution, and its role on crop yield in rainfed areas of Prakasam district of Andhra Pradesh-A Case study. J. Agromet. 2013: 15(1): 183-186.
- Kundzewicz, Z. W. and A. Robson Detecting Trend and Other Changes in Hydrological Data. World Climate Program – Water, WMO/ UNESCO, WCDMP-45, WMO/TD 1013, Geneva: 2000:157.


