Evaluation of Health Risk and Heavy Metal Pollution Status in the Bhima River Water Kalaburagi, Karnataka, India
Rajshekar Chinmalli
*
 and Katepaga Vijayakumar
1
Department of Post Graduate Studies and research in Zoology,
Gulbarga University,
Kalaburagi,
Karnataka
India
http://dx.doi.org/10.12944/CWE.18.1.17
Copy the following to cite this article:
Chinmalli R. Vijayakumar K. Evaluation of Health Risk and Heavy Metal Pollution Status in the Bhima River Water Kalaburagi, Karnataka, India. Curr World Environ 2023;18(1). DOI:http://dx.doi.org/10.12944/CWE.18.1.17
Copy the following to cite this URL:
Chinmalli R. Vijayakumar K. Evaluation of Health Risk and Heavy Metal Pollution Status in the Bhima River Water Kalaburagi, Karnataka, India. Curr World Environ 2023;18(1).
Download article (pdf)
Citation Manager
Publish History

Introduction
Water is a fundamentally occurring substance that is essential for all living creatures to live and also serves as a life supporter, accounting for 70–90% of all living cells.1 Natural freshwater layers like rivers, lakes, and wetlands are the chief water supply sources for meeting the regular needs of water required by households, agriculture, and industries.2,3 It is a universal solvent and has been widely consumed by all living creatures. So, it’s often turned out to be a source of innumerable infections.4 According to the World Health Organisation (WHO), people worldwide must be provided with clean and safe drinking water. The availability of safe water has become the biggest concern for people in most developing countries.5
A river is world's significant natural resources because it supports a diverse range of aquatic species and aids in biodiversity protection.6 Because of the easy access to essential resources, the river banks have drawn inhabitants since prehistoric times. As a result, rivers are regarded as the lifeline of human civilization.7 Unplanned urbanization and industrial growth grew along the river’s bank.8 A considerable volume of industrial and agricultural waste is being thrown into rivers with the hope that the toxic agents will be diluted and detoxified by the action of numerous detoxifying agents.9 Water pollution has risen at an alarming rate in India as a consequence of severe industrialization along with urbanization, with around 70% of rivers in India being contaminated.9-11
Heavy metals have been one of the significant pollutants of surface water in recent decades.12 The use of heavy metal contaminated water for agricultural and other field activities, not only the soil and productivity of crops are affected, but also the health of animals and humans are affected by the food and water.13 Heavy metals contamination is a protracted and irrevocable process.14 High amounts of heavy metals like zinc, cadmium, arsenic, cobalt, copper, chromium, nickel, mercury, and lead were often found in the environment as a consequence of anthropogenic activity.15
In the industrialized human society, metals have sundry applications and play an important role.16 A few heavy metals like Cu, Fe, Zn, and Mn are vital to the physiological and biochemical systems. However, toxicity ensues when the concentration of metals increases beyond a specific limit.17 In recent years, a variety of methods have been used for assessing heavy metal pollution in water along with its effects of it on human health, including the use of polluting manifestations like heavy metal pollution index (HPI), degree of contamination (Cd), heavy metal evaluation index (HEI), & health risk assessments like non-carcinogenic and carcinogenic.18 These are valuable tools for water quality decision-makers, ecologists, and civil authorities. Since they provide an overall pollution level index and surface water quality status.19 Indices are used to calculate the potability of water. As a result, it has been regarded as one of the most valuable methods for determining water contamination.20 International Agency for Research on Cancer (IARC) considers metals like Cd, Cr, Ni, and Pb to be carcinogenic.21 Numerous studies on the heavy metal pollution indices & risk assessing in ground and surface water have been published in various parts of the world. 3, 18, 22, 23, 24
Ganiyu18 sought to assess the contamination status of hand-dug wells along the Ona River in terms of human and ecological health threats. All examined water samples were found to be "practically unpolluted" to "somewhat contaminated" in terms of integrated pollution indexes. In regards of the ecological risk index (ER), cadmium had a significant to very high risk in all collected water samples, but manganese and zinc had a low risk in all collected samples. The order of contributing ratios by examined metals for non-carcinogenic risk was Cd>Pb>Zn>Fe>Mn. The computed target hazard quotient owing to ingested HMs exceeds the acceptable limit in the order of adults for three human demographic groupings, and urged to enhance hygiene habits, pre-treating of water before usage being most critical, provision of potable pipe-borne water supply to the inhabitants.
Khan24 assessed heavy metal contamination in the Ganga Alluvial Plain, India, concentrating on six metals: As, Fe, Cd, Pb, Mn, and Cr. They concluded that the river's hazardous status is visible from the HPI values, with 60% of the sites falling in the critically contaminated portion, 30% in the highly contaminated sector, and just 10% in the slightly contaminated segment and reported that untreated sewage system discharge from domestic and industrial wastewater, as well as agricultural runoff, is recognised latent source of heavy metal contamination in river water and Mishra and Kumar3 assessed the NSFWQI, CPI, & HPI were used foe assessing overall water pollution quality of Narmada River. The river's average NSFWQI, HPI, and CPI were determined to be 70.35, 1.35, & 1.98, respectively, indicating as river water is moderately contaminated & unfit for drinking. Furthermore, RAI and CRI are used to assess the likelihood of cancer risk to human health from river water exposure. Significantly, RAI and CRI values less than one indicate a significant risk of cancer owing to higher concentrations of copper (Cu > 50 µg/L), lead (Pb > 10 µg/L), & manganese (Mn > 100 µg/L).
River Bhima, one of the most important water bodies in North Karnataka, is embellished with stories from religion and mythology and is worshipped at several locations along its banks. It is currently polluted as a result of human activity. Many researchers, including Kumar,25 Pawar,26 Saikiran and Patil,27 Pardeshi,28 Patil,29 and Prabhavati,30 have studied the Bhima river's water quality using physio-chemical characteristics. They found that sewage runoff, agricultural discharge, industrial effluents, and anthropogenic interferences are the main causes of the river's declining water quality. Studies on the effects of heavy metals from the Bhima River on water, fish, and sediment have been done by a few authors, including Vaishnavi and Gupta,31 assessed metal contamination in Mula, Mutha and Pavana, a tributary of Bhima river, Shindhe,32 investigated buildup of heavy metal concentrations in various body parts of Chillapi fish from the Ujjani Reservoir, which receives water from a number of rivers including the Mula, Mutha, and Bhima, and Chinmalli and Vijaykumar,33 worked on the heavy metal contamination in Bhima river sediment from Kalaburagi region. Thus, now it’s essential to know the current status of metal pollutants in the river water. No inclusive study on water contamination was directed into Bhima River of Kalaburagi region. Present study inspects metals like Cd, Cr, Cu, Ni, Pb, Mn, and Zn & evaluates various findings to compile a complete database. To estimate the surface water quality of river, pollution indices like HPI, HEI, Cd, & health-risk assessment are computed.
Materials and Methods
Study Area
The Bhima River flows through the district of Kalaburagi in Karnataka (Fig. 1), which is located into Northern region of Karnataka state (76° 04" to 77° 42" Longitude and 16° 12" to 17° 46" Latitude) and is located 454 meter above mean sea level (MSL). The river is one of tributaries of the river Krishna. It originates in the Bhimashankar foothills of Maharashtra's Western Ghats and flows for approximately 75 kilometres along the shared state boundary of Karnataka and Maharashtra before entering Karnataka near the town of Sheshgiri, and flows for a distance of about 294 km entirely in Karnataka and joins the Krishna River near Yadgir district.34 The study area covers Aflazpur and Jevargi talukas of the Kalaburagi district, through which the Bhima River passes. Eight sampling locations were chosen to assess the heavy metal concentration.
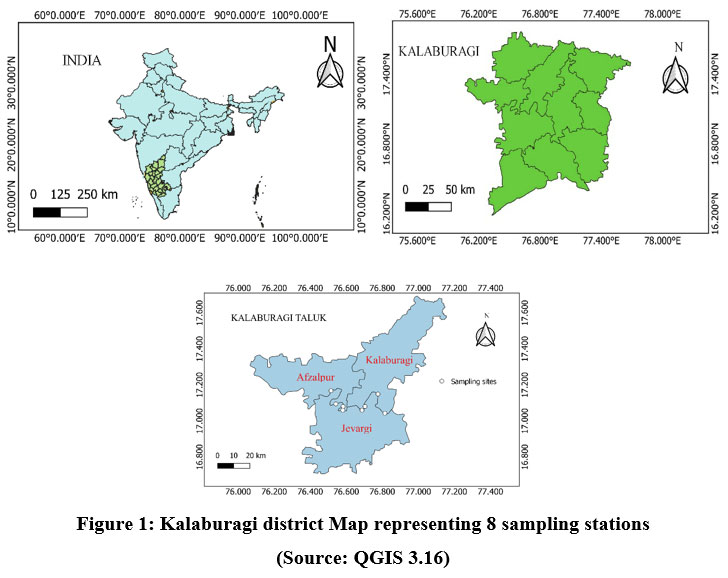 | Figure 1: Kalaburagi district Map representing 8 sampling stations (Source: QGIS 3.16).
|
Sample Collection
Surface water samples were collected monthly into 1 litre pre-rinsed polyethylene bottles from eight distinct, pre-determined places over a year, from October 2021 to September 2022. Site S1, S3, and S6 were situated near the temple region, especially Site S1 have the high religious practices and anthropogenic activities. Site S2 is selected based upon on less human interferences. Site S4, S7, and S8 have followed with recent bridge construction activities. Whereas, S6 have the highest human interferences and have direct sewage disposed region. The different sampling locations are represented in (Table 1). The samples had been acidified with concentrated HNO3 (Nitric acid) and stored in an icebox at 4°C. A GPS device has been utilized for recording the coordinates of sample collection locations.
Table 1: Site and geographic coordinates of sampling location
| Names of study sites | Study site codes | Latitude | Longitude |
| Gangapur | S1 | 17° 10' 06'' | 76° 30' 57'' |
| Sagnur | S2 | 17° 05' 57'' | 76°32' 34'' |
| Chinmalla | S3 | 17° 04' 53'' | 76° 34' 57'' |
| Nelogi | S4 | 17° 03' 45'' | 76° 34' 02'' |
| Harwal | S5 | 17° 03' 39'' | 76° 41' 12'' |
| Rasangi | S6 | 17° 04' 51'' | 76° 42' 15'' |
| Saradgi -B | S7 | 17° 09' 02'' | 76° 46' 39'' |
| Jevargi | S8 | 17° 02' 34'' | 76° 48' 50'' |
Sample digestion and analysis.
A volume of a 100ml sample of water was obtained into a beaker and digested by adding 5ml of concentrated nitric acid (HNO3) on a hot plate until the quantity was reduced to 25 ml. Later, samples were filtered in a 100ml volumetric flask utilizing Whatman No.44 filter paper, filling it to optimum volume with distilled water.12 Heavy metal analysis for copper (Cu), zinc (Zn), nickel (Ni), chromium (Cr), manganese (Mn), lead (Pb), & cadmium (Cd) were performed using an atomic absorption spectrophotometer (AAS).
Heavy metal pollution index
By associating it with the desirable limit of drinking water given by various organizations, HPI is utilized for estimating the total quality of water depending upon heavy metal concentration.35 The unit weight of each metal is assigned a range of 0 to 1, and it reflects the comparative significance of one metal over another.36 The HPI has been deliberated upon by the below equations.37 The unit weight of each parameter was determined by equation 1 and 2.

Wi signifies the unit weight of heavy metal was assigned according to the formula,18,23 K represents proportionality constant, and Si denotes the recommended standard range for each parameter.
A quality rating for heavy metals was obtained using Eq. 3 (Table 2).

Where Qi is the quality rating score, Mi stands for measured concentration of an ith heavy metal, Ii represents ideal standard range of an ith parameter, and n indicates total number of heavy metals measured for this study.
HPI was estimated using Eq. 4

Table 2: Standard range, Ideal range, and Highest admissible range for the analysed elements (mg/L).38
Parameters | Recommended Standard range (Si) | Ideal range (Ii) | Highest admissible range (HAR) |
Cu | 1.5 | 0.05 | 1.5 |
Ni | 0.02 | 0 | 0.02 |
Cr | 0.05 | 0 | 0.05 |
Mn | 0.3 | 0.1 | 0.3 |
Cd | 0.003 | 0 | 0.003 |
Pb | 0.01 | 0 | 0.01 |
Zn | 15 | 5 | 15 |
Cu-copper, Cd-cadmium, Cr-chromium, Pb-lead, Mn-manganese, Ni-nickel, Zn-zinc
Degree of contamination
A degree of contamination (Cd) was proposed by Backman39 to valuate heavy metals into groundwater and stated that same method could be followed to verify the contamination degree for surface water. The element with analytical values less than the maximum allowable concentration has not been considered. The current study approved a modified version of Edet and offiong.40 The degree of contamination in gathered samples was calculated by Eq. 5 and 6.39,40
Calculating the contamination parameter (Cfi) by the relation below

Here, Cfi defines the factor of contamination for an ith metal, CAi denotes the observed concentration of an ith metal, CNi represented the higher allowable concentration of an ith metal, (N signifies normal values).
Degree of contamination (Cd)
.jpg)
Heavy metal evaluation index
The HEI index is utilized as a heavy metal pollution indicator, which indicates the pollution in the region to its maximum permissible heavy metal in potable water.41 HEI was calculated by the equation.40

Hc is the obtained heavy metal concentration, and Hmac is the maximum permissible range of heavy metals.
Risk assessment for human health
The United Agency for Environmental Protection (USEPA)42 for human health risk valuation prototypical is used to estimate carcinogenic and non-carcinogenic risk for heavy metals with a concentration over the Bureau of Indian Standards tolerable level (BIS).38 Three main ways for humans to get exposed to trace metals are inhalation, dermal absorption, and direct ingestion. For water exposure, dermal absorption as well as ingestion, are the commonly anticipated ways.43 In this study, ingestion of water is taken into consideration for the calculation of risk assessment. Non-carcinogenic & carcinogenic risks related to heavy metals were estimated with use of equation 8-11.18,44,45
Lifetime average daily dose
The assessment of the expected magnitude of a negative health effect and its likelihood of happening as a result of exposure to hazardous chemicals over a certain time period is required when dealing with heavy metals in drinking water.46 The Lifetime average daily dose (LADD is quantified by the equations.45

LADD represents lifetime typical daily dosage of heavy metal intake by potable water (mg/kg/day), Cobt is obtained heavy metal concentration of sample (mg/L), IR signifies the water consumption amount, which is 250ml per-day for infants (new-borns), aged 0 to 12 months, 1.5L per-day for children, and 3L per-day for adults,44,45,47
EF indicates the exposed rate (days/year), ED is the exposure duration, i.e., 68.8 years,48 BW is regarded as body weight, 6.9kg for infants, 18.7kg for children, & 57.5kg for adults, respectively,49 AT denotes the average time (days).
Non-carcinogenic risk
A hazard quotient (HQ) is used to assess heavy metals potential non-carcinogenic risk, and is assessed by using the following equation.44,45,50

Here, HQ represents the hazard quotient towards heavy metal ingestion through drinking water for each age group, LADD represents the lifetime typical everyday dosage of heavy metal intake by potable water (mg/kg/day), and RfD represents the oral reference dosage of heavy metal that a person could be exposed to throughout their life without experiencing any adverse effect upon health (mg/kg/day).45 For Cd, Cr, Zn, and Mn, RfD values were derived from USEPA,51 whereas for Ni and Pb, they were obtained by referring to Raja23 and the Cu value was referred to by Vetrimurugan,44 0.0005, 0.003, 0.3, 0.14, 0.1, 0.0035, and 0.005 respectively.
Hazard index
The sum of all hazardous quotients associated with heavy metals absorbed through the consumption of water is termed the hazard index (HI). The hazard index was calculated using equation 10.18

Carcinogenic risk
Cancer risk is assessed as the cumulative chances of an individual in an environmental scenario acquiring cancer as a consequence of exposure to heavy metals throughout of their lifetime 18, 46. The carcinogenic risk was calculated using following equation.23

Here, CR is a carcinogenic risk, LADD is a lifetime average daily dosage, and CSF is a carcinogenic risk factor,51 The risk produced by specific heavy metals is indicated by CSF. The values of CSF attained by the Risk Assessment Information System (RAIS)52 for Pb and Ni were 0.0085 and 0.91, respectively.52 Cd had a CSF value of 0.38.23
Multivariant statistical analysis and spatial plots
Cluster analysis (CA), as well as principal component analysis (PCA), have been carried out on PAST-4.03 to analyze the connection of water samples from these areas based on heavy metal levels. QGIS 3.16 software was utilized for creating spatial distribution plots of studied heavy metals.
Result and discussion
The standard, monitored, average, minimum, and maximum ranges of heavy metal concentration into water samples of eight different locations were summarised in Table 3, which follows order Mn>Zn>Cu>Pb>Ni>Cr>Cd. All surface samples contained Pb, Ni, and Cd values greater than the BIS acceptable limit of 0.01mg/L, 0.02mg/L, & 0.003mg/L, respectively.38 In all analyzed water samples, the Zn concentration has been observed well within the maximum desired range of 15 mg/L,38 i.e., ranging from 0.0486 to 0.0887mg/L by typical range of 0.0639mg/L. Zn distribution scheme displays that the highest concentration was found at sampling stations like S5 and S6 (Fig.2a). The average concentration of Cu in sample of water into study region was 0.0631 mg/L & fluctuated from 0.0428-0.1547 mg/L within BIS range of 1.5 mg/L. A maximum concentration was observed at sampling station S6 (Fig.2b). The observed Mn value oscillated from 0.0414 to 0.1850 mg/L, having a typical range of 0.0928 mg/L less than BIS standards of 0.3mg/L. Spatial distribution of Mn shows that the highest level was seen at sampling stations like S4 and S5 (Fig.2c). All the analyzed samples indicate the Cr value of 0.0043 to 0.0219 mg/L, having an average of 0.0133mg/L within permitted range of 0.05 mg/L.38 Maximum Cr values were observed in sampling stations S5, S7, and S8 (Fig.2d).
Recorded Pb concentration data shows that five of 8 sampling stations were observed to be marginally higher than the desirable range of 0.01 mg/L38 at the stations like S4, S5, S6, S7, & S8 (Fig.2e). The Pb range was 0.0072 to 0.1073mg/L, having average of 0.0579 mg/L. Except for S3 site, remaining sampling stations exceed the desirable limit of Cd value of 0.003 mg/L38 (Fig. 2f), having a mean of 0.0099 mg/L ranging from 0.0029 to 0.0145 mg/L. Ni values were higher than permissible limit of 0.02 mg/L at 75% of sampling stations, averaging 0.0368 mg/L, with concentrations oscillating from 0.0169 to 0.0617 mg/L. The maximum concentrations of Ni were reported at the S4, S5, and S6 sites (Fig.2g). The distribution plot (Fig. 2) of heavy metals shows that sites like S4, S5, S6, S7 and S8 were highly contaminated with Pb, Cd, and Ni. The prime non-point causes of heavy metals in Bhima River were lead & cadmium, which was the main causes of lead and cadmium due to immoderate use of fertilizers, pesticides, and lead batteries.53 (b) sewage disposal and household waste may be the source of Ni, Cr, Pb, Cd, Zn, and Cu.54 (c) Bridge construction is the major contamination source of most of the heavy metals.
Spatial distribution
The spatial distribution maps give baseline data to prevent and regulate heavy metal pollution of water and assist in identifying safe and risky zones.55 Ni, Pb, and Cd in river water had a similar pattern of distribution, with greater concentrations near the S4, S5 and S6 of the research region and lower concentrations towards the S1, S2, and S3. The Spatial comparative concentration of heavy metal are represented in Fig. 2.
Table 3: Concentration of heavy metals in different sampling stations (mg/L)
Metals | Zn | Cu | Mn | Cr | Pb | Cd | Ni
|
Sites | |||||||
S1 | 0.0551 | 0.0546 | 0.0637 | 0.0043 | 0.0087 | 0.0116 | 0.0143 |
S2 | 0.0486 | 0.0428 | 0.0414 | 0.0046 | 0.0072 | 0.0033 | 0.0169 |
S3 | 0.0488 | 0.0490 | 0.0527 | 0.0062 | 0.0081 | 0.0029 | 0.0242 |
S4 | 0.0603 | 0.0540 | 0.1728 | 0.0142 | 0.0442 | 0.0143 | 0.0527 |
S5 | 0.0887 | 0.0603 | 0.1850 | 0.0219 | 0.0991 | 0.0145 | 0.0617 |
S6 | 0.0842 | 0.1547 | 0.0859 | 0.0144 | 0.0948 | 0.0083 | 0.0498 |
S7 | 0.0687 | 0.0447 | 0.0538 | 0.0197 | 0.0940 | 0.0141 | 0.0313 |
S8 | 0.0569 | 0.0450 | 0.0874 | 0.0212 | 0.1073 | 0.0105 | 0.0442 |
Average | 0.0693 | 0.0631 | 0.0928 | 0.0133 | 0.0579 | 0.0099 | 0.0368 |
Minimum | 0.0486 | 0.0428 | 0.0141 | 0.0043 | 0.0072 | 0.0029 | 0.0169 |
Maximum | 0.0887 | 0.1547 | 0.1850 | 0.0219 | 0.1073 | 0.0145 | 0.0617 |
WHO (2012) | 5 – 15 | 0.05– 1.5 | 0.1 – 0.3 | 0.05 | 0.01 | 0.003 | 0.02 |
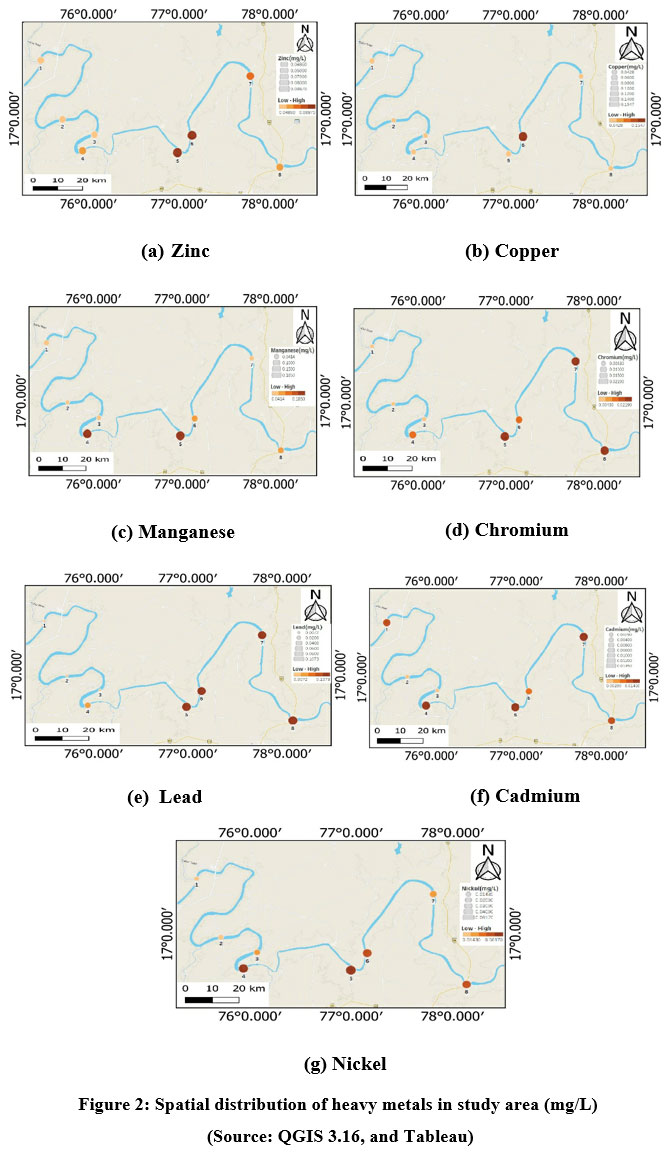 | Figure 2: Spatial distribution of heavy metals in study area (mg/L) (Source: QGIS 3.16, and Tableau).
|
Pollution indexes
The calculated HPI, Cd, HEI, non-carcinogenic, and carcinogenic risks are given in Table 4. HPI values ranged from 92 to 589, where most were above the critical limit of 100.56 According to Ghaderpoori,57 water quality in HPI is categorized into three categories: 100 low threshold risk, equivalent to 100 threshold risk, and > 100 high threshold risk. If the HPI number is greater than 100, the water is deemed unsafe to drink.57 Site S2 and S3 water samples were classified as low threshold risk and can be used for drinking purposes only after some specific treatment, like simple filtration. High threshold risks were assigned to sites S1, S4, S5, S6, S7, and S8.S5 recorded the highest HPI value of 589, whereas the lowest HPI value, i.e., 92, was observed at S3. The average HPI value was found to be 355.25. Khan24 followed the same trend of higher HPI (22.6 to 263.9) in the Gomti river. Table 5 represents the Assessment of heavy metal pollution index range with earlier studies carried out in the different countries.
Backman38 classified the degree of contamination of surface water into three grade scales, Cd=1 (less contaminated), Cd=1-3 (average contaminated), and Cd > 3 (highly contaminated). The Cd value attained in the current analysis varies from -4 to 12, having a mean value of 4.62. The highest Cd values were found at S5 and S8 sampling sites. Both Ukah,58 and Rahman59 reported comparable results with degrees of contamination ranging from negative to highly positive. Ukah58 in Nigeria and Rahman59 in Bangladesh measured contamination levels ranging from -3.2 to 50.7 and -1.43 to 8.12, respectively. Table 6 compares the findings to earlier studies conducted in other sites of the countries.
The heavy metal evaluation index value obtained in the present study varies from 3–19, with an average value of 5. The highest HEI value was reported at site S5, whereas the lowest was found at sites S2 and S3. Prasanna61 have sorted HEI values into consideration of pollution levels. The distinct values of pollution are delineated with several mean values. Projected HEI values are reclassified for sample trails; lower (HEI 5), average (HEI 10), and higher (> 10). These values were consistent with Herojeet60 values ranging between 9.45 and 29.08 in Himachal Pradesh. Table 7 contrasts the outcomes with past research carried out in various places around the globe. The comparative concentration of heavy metal pollution indices are represented in Fig. 3.
Table 4: Values of HPI, Cd, HEI, Non-carcinogenic and carcinogenic risks
Indices | HPI | Cd | HEI | Non-carcinogenic risk Infant Children Adult | Carcinogenic risk Infant Children Adult | ||||
Sites | |||||||||
S1 | 279 | -1 | 6 | 1 | 3 | 2 | 6.3x10⁻⁴ | 1.4x10⁻³ | 9.1x10⁻⁴ |
S2 | 95 | -4 | 3 | 1 | 2 | 1 | 6x10⁻⁴ | 1.3x10⁻³ | 8.7x10⁻⁴ |
S3 | 92 | -4 | 3 | 1 | 2 | 1 | 8x10⁻⁴ | 1.8x10⁻³ | 1.2x10⁻³ |
S4 | 428 | 6 | 13 | 2 | 5 | 3 | 1.9x10⁻³ | 4.3x10⁻³ | 2.8x10⁻³ |
S5 | 545 | 12 | 19 | 3 | 6 | 4 | 2.2x10⁻³ | 5x10⁻³ | 3.2x10⁻³ |
S6 | 394 | 8 | 15 | 3 | 7 | 4 | 1.7x10⁻³ | 3.9x10⁻³ | 2.5x10⁻³ |
S7 | 511 | 9 | 16 | 3 | 6 | 4 | 1.2x10⁻³ | 2.7x10⁻³ | 1.8x10⁻³ |
S8 | 465 | 10 | 17 | 3 | 6 | 4 | 1.6x10⁻³ | 3.6x10⁻³ | 2.3x10⁻³ |
Minimum | 545 | -4 | 3 | 1 | 2 | 2 | 6x10⁻⁴ | 1.3x10⁻³ | 8.7x10⁻⁴ |
Maximum | 92 | 12 | 19 | 3 | 7 | 4 | 2.2x10⁻³ | 5x10⁻³ | 3.2x10⁻³ |
Average | 351 | 5 | 12 | 2 | 5 | 3 | 1.3x10⁻³ | 3x10⁻³ | 1.9x10⁻³ |
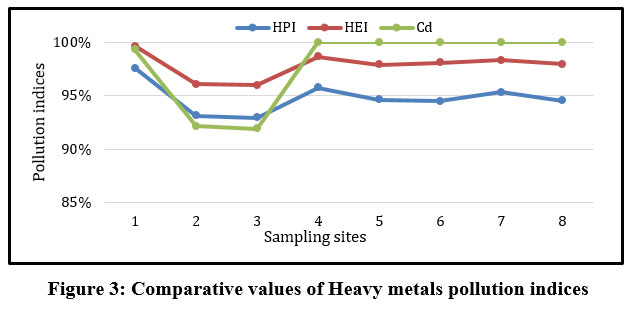 | Figure 3: Comparative values of Heavy metals pollution indices.
|
Table 5: Assessment of heavy metal pollution index range with earlier studies carried out in the different countries.
Sl. No | Site | Heavy metal pollution index Minimal Maximal | Reference | |
1 | Tamil Nadu, India | 999 | 3232 | Raja23 |
2 | Uttar Pradesh, India | 22.6 | 263.9 | Khan24 |
3 | Lagos, Nigeria | 0.035 | 2.84 | Ukah58 |
4 | Narayanganj City, Bangladesh | 99.98 | 100.01 | Rahman59 |
5 | Himachal Pradesh, India | 0.61 | 16.78 | Herojeet60 |
6 | Karnataka, India | 92 | 545 | Current study |
Table 6: Assessment of degree of contamination range with earlier studies carried out in the different countries.
Sl. No | Site | Degree of contamination Minimal Maximal | Reference | |
1 | Tamil Nadu, India | 25 | 133 | Raja23 |
2 | Lagos, Nigeria | -3.24 | 50 | Ukah58 |
3 | Narayanganj City, Bangladesh | -1.43 | 8.12 | Rahman59 |
4 | Himachal Pradesh, India | 0.23 | 19.43 | Herojeet60 |
5 | Karnataka, India | -4 | 12 | Current study |
Table 7: Assessment of heavy metal evaluation index range with earlier studies carried out in the different countries.
Sl. No | Site | Heavy metal evaluation index | Reference | |
Minimal Maximal | ||||
1 | Tamil Nadu, India | 42 | 140 | Raja23 |
2 | Lagos, Nigeria | 0.7 | 59.7 | Ukah58 |
3 | Narayanganj City, Bangladesh | 16.40 | 273.43 | Rahman59 |
4 | Himachal Pradesh, India | 9.45 | 29.08 | Herojeet60 |
5 | Karnataka, India | 3 | 19 | Current study |
Health Risk Assessments
The non–carcinogenic risk for infants, children & adults was calculated for each of the seven heavy metals for which RfD standards were accessible. If HI?1, is safe, & HI?1 might pose risk. For infants, children, and adults, the derived HI values ranged from 1-3 with a mean value of 2, 2-7 with an average of 5, and 1-4 with a mean value of 3, indicating that children have been at higher risk than adults and infants. The locations with the greatest HI values were sites S4 and S5. The non-carcinogenic risk is represented as children > adults > infants (Fig. 4). A similar result was observed by Vetrimurugan44 and Wagh.62 The assessment of non-carcinogenic range with past research conducted in several regions of the globe is shown in Table 8.
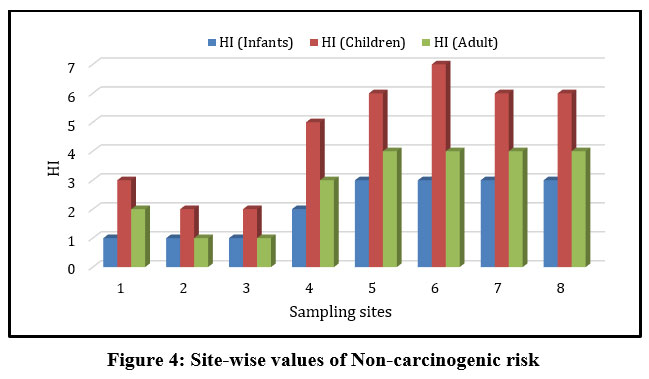 | Figure 4: Site-wise values of Non-carcinogenic risk.
|
Cd, Ni, and Pb concentrations surpass the permissible range at most sampling stations. Carcinogenic elements categorized by IARC include these three metals. The Carcinogenic risk related to these three metals was deliberated. The calculated carcinogenic risk for infants was 6 x 10⁻⁴ to 2.210-3, with a mean value of 1.310-3. The highest CR for infants was recorded at the S5 sampling site. The range of CR for children was 1.3 x 10⁻³ to 5 x 10⁻³, with an average of 3 x 10⁻³. The highest CR value for children was found to be at S5. While the CR value for adults ranged between 8.7x10⁻⁴ and 3.2x10⁻³, an average value of 1.9x10⁻³ was obtained. A high CR value for adults was found at the S5 site (Fig 5). Usually, a risk value higher than 10-4 shows an unbearable carcinogenic health risk, whereas a risk range of 10-6 might be regarded as the maximal permissible level. If the risk value ranges from 10-6 or 10-4, the health risk is accepted as bearable, and ranging from 10-8 or 10-7 is considered insignificant.8.63 Considering risk assessment outcomes, it’s clear that children are more susceptible to carcinogenic effects than adults & infants. Similar findings were observed by Zahm and Devesa.64 Table 9 compares the carcinogenic results with prior study done in various parts of the globe.
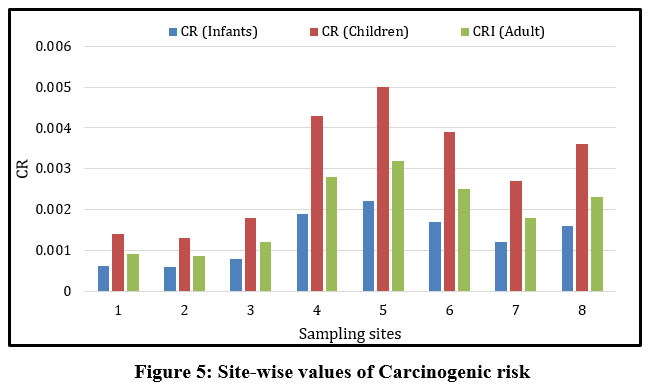 | Figure 5: Site-wise values of Carcinogenic risk.
|
Table 8: Assessment of non-carcinogenic range with earlier work carried out in the different sites of the globe.
Sl. No | Site | Non-carcinogenic risk Infants Children Adult | Reference | ||
1 | Southwest, Nigeria | 0.061 | 0.046 | 0.0135 | Ganiyu18 |
2 | Tamil Nadu, India | 8.3 | 18.3 | 11.9 | Vetrimurugan44 |
3 | Nasik, India | 10.41 | 23.05 | 14.99 | Wagh62 |
4 | Ebonyi, Nigeria | - | 5.69 | 2.45 | Ugbede65 |
5 | Karnataka, India | 2 | 5 | 3 | Present study |
Table 9: Assessment of carcinogenic range with earlier work carried out in the different sites of the globe.
Sl. No | Site | Carcinogenic risk
Infants Children Adult | Reference | ||
1 | Southwest, Nigeria | 4.41 | 2.76 | 0.92 | Ganiyu18 |
2 | Karnataka, India | 1.3x10⁻³ | 3x10⁻³ | 1.9x10⁻³ | Present study |
Principal components analysis
Principal component analysis separated into two major components (Table 10) with an eigenvalue greater than one was used to account for 81.60% of the total variance. PC1 accounting to 63.49% of the total variance is donated by the succeeding variables like Mn, Zn, Cr, Cd, Ni, and Pb. Lead, Ni, Pb, as well as Cd are sourced from lead batteries, bridge construction, and vehicle gas emissions from traffic through bridges. Zn, Mn, and Cr sourced from agricultural runoff and sewage sludge. PC2 shows good relations with copper. Components contribute to 18.11% of the total variance. This characterizes anthropogenic activities (Fig. 6).
Table 10: Principal components values of analysed heavy metals
Heavy metals | PC1 | PC2 |
Zn | 0.411 | 0.312 |
Cu | 0.172 | 0.797 |
Mn | 0.358 | -0.263 |
Cr | 0.424 | -0.173 |
Pb | 0.415 | 0.078 |
Cd | 0.351 | -0.399 |
Ni | 0.442 | 0.021 |
Eigen value | 4.444 | 1.268 |
Total variance (%) | 63.49 | 18.11 |
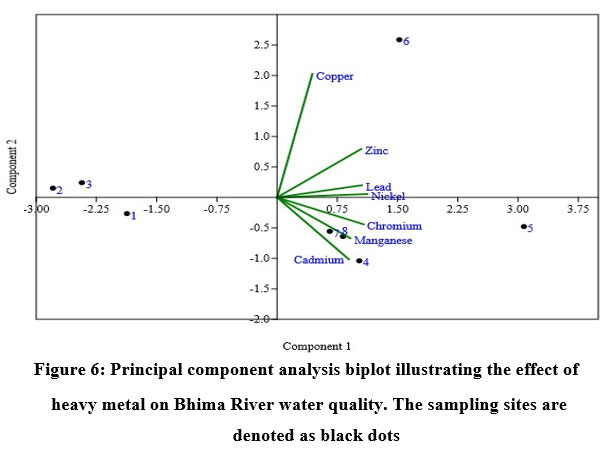 | Figure 6: Principal component analysis biplot illustrating the effect of heavy metal on Bhima River water quality. The sampling sites are denoted as black dots
|
Cluster analysis
The primary purpose of hierarchical cluster analysis is to figure out the best tactic to assemble items with comparable attributes into clusters. The dendrogram shows two primary groups for the research area sample locations: The eight river water sample locations were designated by eight sampling points and are divided into two groups (Fig. 7). Cluster one comprises three sampling points 1, 2, and 3 all of which have been polluted as a result of human activity. Cluster two includes five sampling points 4, 5, 6, 7, and 8 which were contaminated due to agricultural runoff, sewage sludge, lead batteries, and bridge construction.
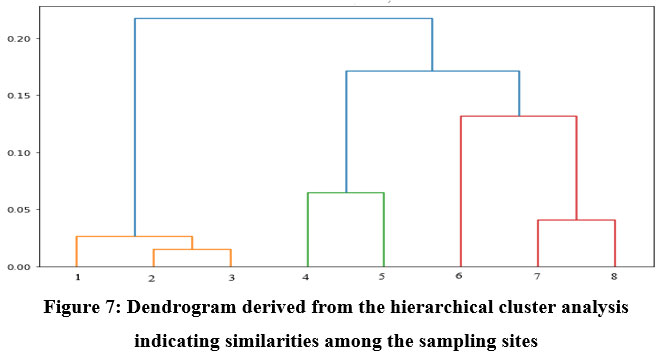 | Figure 7: Dendrogram derived from the hierarchical cluster analysis indicating similarities among the sampling sites.
|
Conclusion
The present study reveals that the Bhima River in the Kalaburagi district is contaminated by numerous metals, and the possible pollutant sources are agricultural runoff, sewage sludge, use of lead batteries, and bridge construction located in the study area. Determined pollution indices indicate that 5 out of 8 sampling stations are extremely contaminated. According to the data assembled by calculating non-carcinogenic and carcinogenic risks, the sampling stations like S1, S2, and S3 appeared to have the low health risk potential. In contrast, the remaining stations were approved to hold higher health risk potential. It indicates that children within this region consuming the contaminated water will pose high health hazards compared to infants and adults. Surface water samples taken near bridges and sewage runoff contain significant Cd, Pb, and Ni content, as shown by the geographic distribution plots. The conclusions of our analysis can be used as a preliminary point for additional study into the effects of heavy metal concentrations in drinking water. The high metal content in the river is chief source of worry. Consistent water quality monitoring in this area is crucial for preserving the river's scenic value and fostering aquatic biodiversity.
Acknowledgment
We extremely thank Omkar Jadhav USIC Department Gulbarga University, Kalaburagi for providing equipment facilities. The authors would like to express gratitude to the Department of Zoology, Gulbarga University, Kalaburagi for providing laboratory facilities.
Conflict of Interest
The authors declare no conflict of interest.
Funding Sources
No funding was received for current study.
References
- Khan FA, Ansari AA. Eutrophication: an ecological vision. Bot Rev 2005;71(4)449-482.
- Eliku T, Leta S. Spatial and seasonal variation in physicochemical parameters and heavy metals in Awash River, Ethiopia. Appl Water Sci 2018;8(6)1-13.
- Mishra S, Kumar A. Estimation of physicochemical characteristics and associated metal contamination risk in the Narmada River, India. Environ Eng Res 2021;(26)1-11.
- Haseena M, Malik MF, Javed A, Arshad S, Asif N, Zulfiqar S, Hanif J. Water pollution and human health. Environ Risk Assess Remediat 2018;1(3).
- WHO Guidelines for drinking-water quality: fourth edition incorporating the first addendum Geneva. 2017.
- Singh H, Pandey R, Singh SK, Shukla DN. Assessment of heavy metal contamination in the sediment of the river Ghaghara, a major tributary of the River Ganga in Northern India. Appl Water Sci 2017;7(7)4133-4149.
- Sen H. Eternal relation of human emotions and rivers in Hindi literature. In: Singh DS (ed) The Indian rivers scientific and economic aspects. Springer hydrogeology, Singapore. 2018;35-45.
- Dong W, Zhang Y, Quan X. Health risk assessment of heavy metals and pesticides: a case study in the main drinking water source in Dalian, China. Chemosphere 2020;(242)125113.
- Jindal R, Sharma C. Studies on water quality of Sutlej River around Ludhiana with reference to physicochemical parameters. Environ Monit Assess 2011;74(1)417-425.
- Rao SM, Mamatha P. Water quality in sustainable water management. Curr sci. 2004;942-947.
- Gupta N, Pandey P, Hussain J. Effect of physicochemical and biological parameters on the quality of river water of Narmada, Madhya Pradesh, India. Water Sci 2017;31(1)11-23.
- Bhuyan MS, Bakar MA, Rashed-Un-Nabi M, Senapathi V, Chung SY, Islam MS. Monitoring and assessment of heavy metal contamination in surface water and sediment of the Old Brahmaputra River, Bangladesh. Appl Water Sci 2019;9(5)1-13.
- Singh S, Parihar P, Singh R, Singh VP, Prasad SM. Heavy metal tolerance in plants: role of transcriptomics, proteomics, metabolomics, and ionomics. Front plant sci. 2016;(6)1-36.
- Majagi SH, Vijaykumar K, Vasanthkaumar B. Concentration of heavy metals in Karanja reservoir, Bidar district, Karnataka, India. Environ Monit and Assess. 2008;138(1)273-279.
- Khan T, Muhammad S, Khan B, Khan H. Investigating the levels of selected heavy metals in surface water of Shah Alam River (A tributary of River Kabul, Khyber Pakhtunkhwa). J HimalEarth Sci 2011;44(2)71-79.
- Ali H, Khan E, Ilahi I. Environmental chemistry and ecotoxicology of hazardous heavy metals: environmental persistence, toxicity, and bioaccumulation. J Chem. 2019;1-14.
- Kavcar P, Sofuoglu A, Sofuoglu SC. A health risk assessment for exposure to trace metals via drinking water ingestion pathway. Int J Hyg and Environ Health 2009;212(2)216-227.
- Ganiyu SA, Mabunmi AA, Olurin OT, Adeyemi AA, Jegede OA, Okeh A. Assessment of microbial and heavy metal contamination in shallow hand-dug wells bordering Ona River, Southwest Nigeria. Environ Monit and Assess 2021;193(3)1-22.
- Anitha BH, Naik SM, Nanjundaswamy C, Divyanand MS. Application of Heavy Metal Pollution Index and Metal Index for the Assessment of Groundwater Quality in Peenya Industrial Area. In IOP Conference Series: Earth Environ Sci 2021;822(1)012033.
- Rezaei A, Hassani H, Hassani S, Jabbari N, Mousavi SB, Rezaei S. Evaluation of groundwater quality and heavy metal pollution indices in Bazman basin, southeastern Iran. Groundw sustain dev 2019;(9)1-14.
- Beyersmann D, Hartwig A. Carcinogenic metal compounds: recent insight into molecular and cellular mechanisms. Arch Toxicol 2008;82(8)493-512.
- Chaudhary M, Mishra S, Kumar A. Estimation of water pollution and probability of health risk due to imbalanced nutrients in River Ganga, India. Int J River Basin Manag 2017;15(1)53-60.
- Raja V, Lakshmi RV, Sekar CP, Chidambaram S, Neelakantan MA. Health risk assessment of heavy metals in groundwater of industrial township Virudhunagar, Tamil Nadu, India. Arch Environ Contam Toxicol 2021;80(1)144-163.
- Khan R, Saxena A, Shukla S. Evaluation of heavy metal pollution for River Gomti, in parts of Ganga Alluvial Plain, India. SN Appl Sci 2020;2(8)1-12.
- Kumar V, Majaji S, Jadesh M, Kumar VB. Pollution studies of Bheema river at Gulbarga. Ecol Environ Conserv 2005;11(3-4)467-469.
- Pawar RM. Physicochemical analysis of Bhima river water in jurdication of Khed tahsil, Pune (MS) India. IJAPRR2014;65-73.
- Saikiran and Patil S. Water quality analysis of back water and flow water of Saradgi barrage on Bhima River Karnataka. J Eng 2017:7(8)1-8.
- Pardeshi BM, Bhor GL, Salve AN, Sardesai MM. Study on seasonal variations in the water quality of Bhima river flowing through Khed Tehsil. Int J Sci Dev Res 2018;4(5)405-408.
- Patil SV, Patil PS, Tamhankar BV, Kolekar GB. Assessment of water quality analysis using Physico-chemical parameters: a case study of Bhima river in Daund tahsil, Pune district, Maharashtra. Innovare J Sci 2020;8(7)24–26.
- Prabhavati A, Somanathreddy C. Patil B, Shivakumar KC. Assessment of physicochemical parameters and water quality (Rotifera diversity) of Bhima River at Katti Sanghavi bridge (Karnataka, India). UPJOZ 2021;42(23)20-28.
- Vaishnavi MVS, and Shelly Gupta. Study of levels of heavy metals in the river waters of regions in and around Pune City, Maharashtra, India. Int J Ecol Ecosolution 2015;2(3)36-40.
- Shinde, D, Kamble P, Mahajan DM, Devkar V, & Chakane S. Analysis of Accumulated Heavy Metal Concentrations in Various Body Parts of Chillapi (Oreochromis mossambicus) Fish from Ujjani Reservoir. Advances in Zoology and Botany 2020;8(2) 37-44.
- Chinmalli R, Vijaykumar K. Assessment of Heavy Metal Pollution Associated With Surface Sediment Concentration in the Bhima River, Karnataka, India. Curr World Environ 2022;17(2)456-466.
- Vijaylaxmi C, Vijaykumar K. Biodiversity of fish fauna of the Bheema River in Gulbarga district of Karnataka. Ecoscan 2011;5(1&2)21-25.
- Kaur J, Kaur V, Pakade YB, Katnoria JK. A study on water quality monitoring of Buddha Nullah, Ludhiana, Punjab (India). Environ Geochem Health 2021;43(7)2699-2722.
- Matta G, Kumar A, Naik PK, Kumar A, Srivastava N. Assessment of heavy metals toxicity and ecological impact on surface water quality using HPI in Ganga river. INAE Lett 2018;3(3)123-129.
- Mohan SV, Nithila P, Reddy SJ. Estimation of heavy metals in drinking water and development of heavy metal pollution index. J Environl Sci Health A 1996;31(2)283-289.
- BIS. Indian standard drinking water specification. Second Revision ISO: Bureau of Indian Standards, Drinking Water Sectional Committee, FAD 25. BIS, New Delhi. 10500:2012.
- Backman B, Bodis D, Lahermo P, Rapant S, Tarvainen T. Application of a groundwater contamination index in Finland and Slovakia. Environ Geol 1998;36(1)55-64.
- Edet AE, Offiong OE. Evaluation of water quality pollution indices for heavy metal contamination monitoring. A study case from Akpabuyo-Odukpani area, Lower Cross River Basin (Southeastern Nigeria). GeoJournal 2002;57(4)295-304.
- Mokarram M, Saber A, Sheykhi V. Effects of heavy metal contamination on river water quality due to release of industrial effluents. J Clean Prod 2020;(277)1-14.
- USEPA. Exposure Factors Handbook: 2011 Edition. Environmental Protection Agency, National Centre for Environmental Assessment, Washington, DC. EPA/600/R-09/052F;2011.
- Sarikar S, Vijaykumar K. Assessment of water quality index and non-carcinogenic risk for ingestion of nitrate for drinking purpose of Bhosga Reservoir, Karnataka, India. Curr World Environ 2022;17(2)467-479.
- Vetrimurugan E, Brindha K, Elango L, Ndwandwe OM. Human exposure risk to heavy metals through groundwater used for drinking in an intensively irrigated river delta. Appl Water Sci 2017;7(6)3267-3280.
- Paul R, Brindha K, Gowrisankar G, Tan ML, Singh MK. Identification of hydrogeochemical processes controlling groundwater quality in Tripura, Northeast India using evaluation indices, GIS, and multivariate statistical methods. Environ Earth Sci 2019;78(15)1-16.
- Egbueri JC, Mgbenu CN. Chemometric analysis for pollution source identification and human health risk assessment of water resources in Ojoto Province, southeast Nigeria. Appl Water Sci 2020;10(4)1-18
- Planning Commission. Report of the working group on rural domestic water and sanitation, Twelfth five-year plan- 2012–2017, Ministry of Drinking Water and Sanitation, Government of India. 2011;220.
- WHO. World health statistics: Monitoring Health for the SDGs, Sustainable Development Goals Geneva. 2019.
- ICMR. Indian Council of Medical Research. Dietary guidelines for Indians. A manual, National Institute of Nutrition, Hyderabad, India. 2011.
- USEPA. Risk assessment guidance for superfund, volume 1: human health evaluation manual (part A). Washington DC: Office of Emergency and Remedial Response. EPA/540/1-89/002;1989.
- USEPA. Edition of the Drinking Water Standards and Health Advisories Office of Water U.S. Environmental Protection Agency Washington, DC. EPA 822-F-18-001;2018.
- RAIS: Risk Assessment Information System (2020) From http://www.rais.ornl.gov. Accessed 27 October 2022.
- Atafar Z, Mesdaghinia A, Nouri J, Homaee M, Yunesian M, Ahmadimoghaddam M, Mahvi AH. Effect of fertilizer application on soil heavy metal concentration. Environ Monit Assess 2010;(1)83–89.
- Prasad S, Saluja R, Joshi V, Garg JK. Heavy metal pollution in surface water of the Upper Ganga River, India: human health risk assessment. Environ Monit Assess 2020;192(11)1-15.
- Bhat NA, Ghosh P, Ahmed W, Naaz F, & Darshinee AP. (2022). Heavy metal contamination in soils and stream water in Tungabhadra basin, Karnataka: environmental and health risk assessment. Int J Environ Sci Tech 2023;(20)3071–3084.
- Prasad B, Bose J. Evaluation of the heavy metal pollution index for surface and spring water near a limestone mining area of the lower Himalayas. Environ Geol 2001;41(1)183-188.
- Ghaderpoori M. Heavy metals analysis and quality assessment in drinking water–Khorramabad city, Iran. Data Br 2018;(16)1-14.
- Ukah BU, Egbueri JC, Unigwe CO, Ubido OE. Extent of heavy metals pollution and health risk assessment of groundwater in a densely populated industrial area, Lagos, Nigeria. Int J Energy and Water Resour 2019;3(4)291-303.
- Rahman MA, Paul M, Bhoumik N, Hassan M, Alam MK, Aktar Z. Heavy metal pollution assessment in the groundwater of the Meghna Ghat industrial area, Bangladesh, by using water pollution indices approach. Appl Water Sci 2020;10(8)1-15.
- Herojeet R, Rishi MS, Kishore N. Integrated approach of heavy metal pollution indices and complexity quantification using chemometric models in the Sirsa Basin, Nalagarh valley, Himachal Pradesh, India. Chin J Geochem 2015;34(4)620-633.
- Prasanna MV, Praveena SM, Chidambaram S, Nagarajan R, Elayaraja A. Evaluation of water quality pollution indices for heavy metal contamination monitoring: a case study from CurtinLake, Miri City, East Malaysia. Environ Earth Sci 2012;67(7)1987-2001.
- Wagh VM, Panaskar DB, Mukate SV, Gaikwad SK, Muley AA, Varade AM. Health risk assessment of heavy metal contamination in groundwater of Kadava River Basin, Nashik, India. Model Earth Syst Environ 2018;4(3)969-980.
- Wang D, Wang Y, Singh VP, Zhu J, Jiang L, Zeng D, Zeng C. Ecological and health risk assessment of PAHs, OCPs, and PCBs in Taihu Lake basin. Ecol Indic 2018;(92)171-180.
- Zahm SH, Devesa SS. Childhood cancer: overview of incidence trends and environmental carcinogens, Environ Health Perspect 1995;103(6)177-184.
- Ugbede FO, Aduo BC, Ogbonna ON, & Ekoh OC. Natural radionuclides, heavy metals and health risk assessment in surface water of Nkalagu river dam with statistical analysis. Sci African 2020;(8)1-13.


