Delineation of Spring Potential Zones using Geospatial Techniques: Arunachal Pradesh, India
Prem Ranjan
*
 , Pankaj Kumar Pandey
and Vanita Pandey
, Pankaj Kumar Pandey
and Vanita Pandey
1
Department of Agricultural Engineering,
North Eastern Regional Institue of Science and Technology,
Nirjuli,
Arunachal Pradesh
India
http://dx.doi.org/10.12944/CWE.18.1.8
Copy the following to cite this article:
Copy the following to cite this URL:
Download article (pdf)
Citation Manager
Publish History

Introduction
Spring is a natural occurrence where water emerges from an underground source and flows to the earth surface. A difference in elevation between the aquifer hydraulic head and the ground surface usually causes this.1 However, in recent times, it has become apparent that the springs in the Indian Himalayan region are drying up or becoming seasonal due to various factors, including human activities and climate change.2-4 The drying up of springs can be attributed to increased temperature, more intense rainfall, reduced temporal distribution, and a significant decline in winter rain. Unfortunately, there has been a lack of data collection, resulting in inadequate information and data regarding springs in the region.4,30-34
In the Himalayan region, assessing the potential and yield of springs is crucial due to the challenging terrain, high elevation variations, and dense forest cover. The potential of springs refers to the likelihood of their occurrence in areas with sufficient water supply, which is crucial for estimating groundwater productivity.5 To manage groundwater resources, technologies like RS and GIS can help overcome various challenges. They provide rapid and cost-effective analysis by offering multispectral, multitemporal, and multisensor data on the earth's surface.6 However, RS techniques alone cannot determine groundwater availability accurately. Combining satellite data with conventional data in a GIS environment can identify and extract potential groundwater zones. The multicriteria decision-making (MCDM) framework, particularly the AHP, is commonly used to manage groundwater resources. AHP, developed by Saaty in 1979, is a prominent MCDM model for handling socio-economic decision-making problems.7,8 This study uses the AHP method to rank the significance of different aspects of groundwater exploration.9,10
The integration of AHP and GIS methods can be used to identify SPZ, which can aid in locating springs and in the rejuvenation, protection, and management of water resources within a region. The AHP model emphasizes clusters of components, which are often necessary for water resource management.11 Numerous researchers have utilized RS-GIS and MCDM methods to identify potential groundwater zones at a global level.8,12,13 However, there has been minimal research on identifying SPZ, particularly in the Himalayan region.5 Thus, the study main goal is to define the SPZ of the Papum Pare district using GIS, AHP, and eight spring governing elements.
Study Area
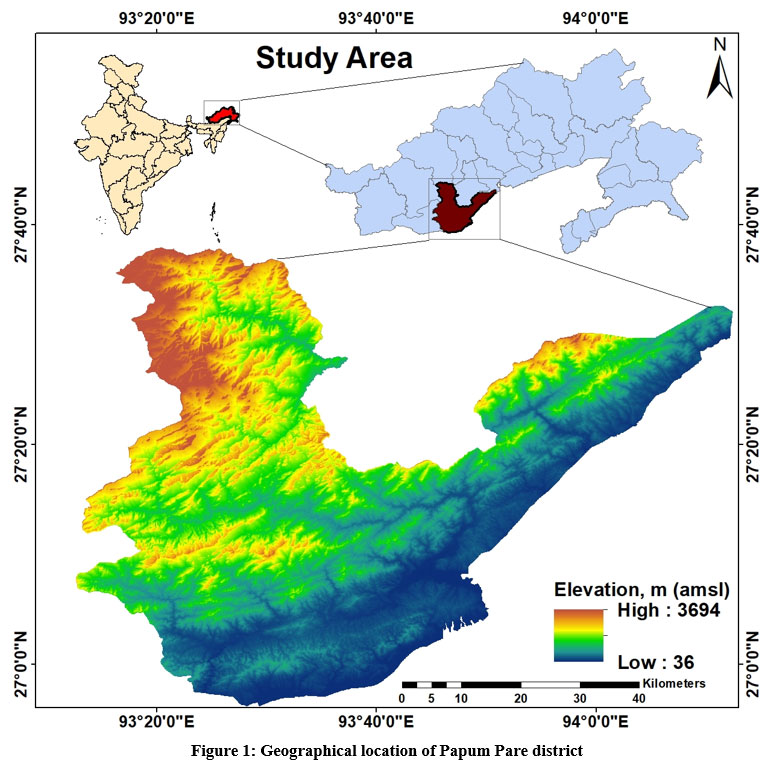
Papum Pare is a district situated in the Northeastern region of Arunachal Pradesh, with coordinates ranging from 26°55' to 28°40' N and 92°40' to 94°21' E (as shown in Figure 1). The district falls under the mid-tropical hill zone and is mainly characterized by mountains ranging from 36 to 3694 m, dense forests, river basins, and beautiful plateaus. Almost 75% of the region is covered with thick, dense forests. The southern part of the region experiences a wet and humid climate, while some places such as Naharlagun, Doimukh, and Itanagar face extremely hot weather during summer. In contrast, temperatures fall below freezing point in many places, such as Sagalee and Northern Mengio, making the environment cold during winters. The temperature during this time ranges from 10 to 32oC and the average annual relative humidity is about 82%. The rainy season usually begins in May and lasts until late fall (approx. September or October) and the annual average rainfall received in the region is 3037.3 mm.
.jpg) | Figure 1: Geographical location of Papum Pare district
|
Materials and Method
Various data sources, including satellite imagery, indexed maps, and information from multiple organizations, delineated the spring potential zone (SPZ) in the area under investigation. The thematic layers used in the analysis included soil texture, geomorphology, lithology, rainfall, slope, drainage density, lineament density, and a spring proximity map. The ArcGIS software weighted overlay (WOA) tool combined these thematic layers and generated potential zones. The complete process of generating the SPZ is illustrated in Figure 2.
Influential thematic layers of the SPZ map generation.
The following section explains the influential factors contributing to the SPZ map generation.
Slope (Sl)
The study area slope impacts its topography and water availability for recharging groundwater.9 The infiltration and runoff rate at the surface depends on the slope gradient, where steeper slopes lead to less time for groundwater recharge, resulting in increased surface runoff and reduced groundwater recharge. On the other hand, gentle slopes have high groundwater recharge. Hence, slopes are crucial in sustainable water management in the Himalayan region.5 The slope was calculated from a 30m resolution DEM (https://earthexplorer.usgs.gov/), and the ArcGIS spatial analyst tool was employed to generate a slope map then categorized into five classes for further processing as input for developing the SPZ illustrated in Figure 3(a). The slope values were classified as nearly level (<15%), very gently sloping (15-35%), gently sloping (35-55%), moderately sloping (55-75%), and strongly sloping (>75%). Higher weights were assigned to slopes with lower values, while those with higher values were given lower weights.6 Slopes with lower values suggest more gentle or flat terrain, while higher values indicate steep terrain.
 | Figure 2: Flowchart of spring potential zone identification
|
Drainage Density (Dd)
The amount of runoff and the amount of infiltration are both dependent on the drainage density (Dd). For example, a low Dd shows high infiltration and low drainage, whereas a high Dd shows high runoff and less infiltration.14,10 The Dd of the study area was determined using a 30-meter-resolution DEM (https://earthexplorer.usgs.gov/). The Dd of the region was categorized into five different classes, as illustrated in Figure 3b. The five distinct categories are very low: <0.15; low: 0.15- 0.35; medium: 0.35- 0.55; high: 0.55- 0.75; and very high: >0.8 (in km/km2). The Dd area in these five distinct categories is 1.09% for the very low class, 12.72% for the low class, 34.46% for the medium class, 34.76% for the high class, and 16.96% for the very high class.
Lineament Density (Ld)
Lineament analysis is a valuable technique that enhances understanding of the relationship between fracture systems and the percolation of surface water. It also helps control the infiltration and movement of water.9,10 Thus, a higher density of lineaments relates to a higher prospect of groundwater potential.8,15 The data for the lineament map used in this study was obtained from Bhuvan (https://bhuvan.nrsc.gov.in/) and was collected at a resolution of 1:50000. It was divided into five distinct categories, as illustrated in Figure 3c. The five distinct categories are very high: >0.42; high: 0.32-0.42; moderate: 0.22-0.32; very low: 0.12-0.22; and low: <0.12 (in km/km2). The area falls into the following categories based on their respective proportions very high (9.66%), high (12.09%), moderate (17.04%), very low (36.82%), and low (24.38%).
Soil Texture (St)
Groundwater recharge is influenced by the type of soil, which affects the amount of water percolates into underground formations. 16,17 The soil effective porosity, which is determined by the ratio of voids in the soil, its texture, and its saturation level, controls its permeability. Fine-textured soil has low infiltration, while coarse-grained soil has high infiltration, which depends on the soil grains average particle size. The soil texture map (Department of Agriculture, Govt. of Arunachal Pradesh) was grouped into six types, which include coarse loamy (12.27%), fine loamy/gravelly subsurface (49.48%), loamy (17.70%), fine loamy (18.26%), fine (0.48%), and coarse loamy/gravelly subsurface (1.69%) as shown in Figure 3(d). The study area was predominantly composed of fine loamy/gravelly subsurface soil, covering an area of 1685.37 km2, followed by fine loamy and loamy soil at 621.77 km2 and 602.70 km2. The soil type, infiltration rate, and water holding capacity primarily determine the weights allocated to each soil unit. As a result, soils that are fine and loamy have been given the least weight, while surface soils that are gravelly and coarse loamy have been given the highest weight.
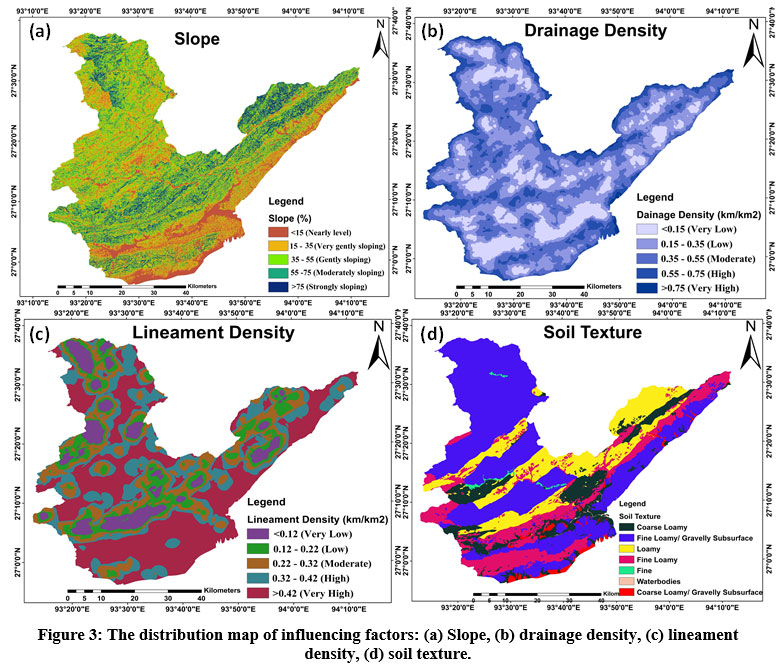 | Figure 3: The distribution map of influencing factors: (a) Slope, (b) drainage density, (c) lineament density, (d) soil texture.
|
Geomorphology (Gm)
Geomorphology studies the research zones topography, landforms, and processes, such as water flow, geochemical reactions, temperature changes, and freezing and thawing.18 The geomorphology map used in this study was obtained from Bhukoosh (https://bhukosh.gsi.gov.in/) at a resolution of 1:50000. The geomorphological formations were divided into distinct categories shown in Figure 4(a). The alluvial plains cover an area of 47.19 km2 (1.38%), the flood plain covers 53.02 km2, and severely dissected structural hills and valleys cover 685.48 km2 (20.13%). The river occupies an area of 52.26 km2 (1.54%), while ponds and other water bodies cover 0.14 km2 (0.004%), which plays a significant role in groundwater storage. These features were given higher importance in allowing water to infiltrate at a high rate. The other structural hill features, characterized by complex bending and faulting with multiple joints and cracks, primarily function as a runoff zone and allow for limited infiltration, resulting in a medium to low infiltration rate.15
Lithology (Li)
The presence of springs is not only dependent on the local geology but also in hydrogeology. Tectonic faults and rock types play a critical role in determining the occurrence of springs. 1 Rock types and their connection to aquifer properties such as porosity, permeability, and transmissivity significantly impact an aquifer's water-holding capacity, recharge and discharge rates, and geological formation. This study utilized a lithology map obtained from Bhukoosh (https://bhukosh.gsi.gov.in/) at a scale of 1:50000 resolution. The study area includes various lithologic features, such as sandstone, clay, conglomerate, coal, fossil wood (=11.62%); garnetiferous mica schist (=7.75%); sst, calcareous nodules, carbonized wood, coal seam (=16.95%); augen gneiss, biotite gneiss, granite gneiss (=23.46%); sandstone, nodular clay beds, plant fossils (=11.35%); unmapped region (=16.18%); and granitoid gneiss (=7.66%). Each formation's weight was determined based on its compaction characteristics, primary porosity, and permeability. Formations with greater porosity and permeability contribute to a higher rate of groundwater recharge and water output. Therefore, it is essential to understand the lithologic features of an area to predict the occurrence of springs and their hydrogeological characteristics.
Rainfall (Rf)
Precipitation plays a significant role in both surface water and groundwater resources. Thus, rainfall characteristics significantly affect groundwater potential. The average annual rainfall map used in this study was obtained from WorldClim (https://www.worldclim.org/) with a resolution of 30 seconds (~1 km2). The map was categorized into five sections depending on the quantity of precipitation: very low (<1000 mm/year), low (1000-1500 mm/year), moderate (1500-2000 mm/year), high (2000-2500 mm/year), and very high (>2500 mm/year), illustrated in Figure 4c. The area covered by high and very high rainfall is 20.32% and 40.24%, respectively, indicating higher water availability in these regions. Consequently, a higher weight was assigned to these areas. The areas that fall under the medium, low, and very low rainfall categories are 23.94%, 10.72%, and 4.78%, respectively, with a lower weight allocated to these regions.
 | Figure 4: The distribution map of influencing factors: (a) Geomorphology, (b) lithology, (c) rainfall and (d) spring proximity.
|
Spring Proximity (Sp)
A spring proximity map was prepared to identify SPZ. Thus, spring locations were identified throughout the area using handheld GPS. The areas closer to the spring locations are more likely to have springs, while those farther away are less sensitive. The map was created by generating buffers around the spring locations and dividing them into five distinct classes: 0-2500m, 2500-7500m, 7500-15000m, 15000-30000m, and above 30000m, as shown in Figure 4d. The assigned weights were inversely proportional to the distance from the spring.
Thematic layers weight calculation
Application of AHP
The AHP model was developed by Saaty (1979) as an MCDM approach to solving complex decision-making problems. Every groundwater-related element is given a standard weight in this model. Thus, the principal eigenvalue of the resulting matrix was used to determine how much weight should be placed on each feature. So, to evaluate the output consistency, the estimated consistency index (CI) and consistency ratio (CR) values were computed shown in Equation (1) and Equation (2), respectively. AHP is a widely used model for groundwater management.19
The h represents the principal eigenvalue of the matrix, while the quantity 'n' indicates the count of factors influencing spring. The consistency of the matrix is evaluated by calculating the CR using Eq. (2)
The RCI value of 1.41 was utilized in the study (Table 1). For the output to be consistent, the CR value should be less than 0.1.
Generation of pairwise-matrix
Comparison matrices were assigned based on the groundwater influencing factors in evaluating the weight of each element. A pairwise comparison matrix (PCM) (Table 3) was used to compare the governing characteristics. The comparison rating was assigned using the Saaty scale (Table 2).
Table 1: Different ‘n values were evaluated using Saaty's consistency indices.20
| N | 10 | 9 | 8 | 7 | 6 | 5 | 4 | 3 | 2 | 1 |
| Value | 1.49 | 1.45 | 1.41 | 1.32 | 1.24 | 1.12 | 0.89 | 0.58 | 0 | 0 |
Table 2: The scale of relative importance38
| Scale | 9 | 8 | 7 | 6 | 5 | 4 | 3 | 2 | 1 |
| Importance | Extreme | Very very strong | Very strong | Strong | Strong plus | Moderate plus | Moderate | Weak | Equal |
Table 3: The PCM used in the study to evaluate the weight of each element.
| Variables | Dd | Ld | Rf | Sl | Gm | Li | St | Sp | Weight (%) |
| Dd | 1 | 1/2 | 1 | 1/2 | 1/3 | 1 | 1 | 2 | 10 |
| Ld | 2 | 1 | 1 | 1/3 | 1/2 | 1 | 2 | 1 | 11 |
| Rf | 1 | 1 | 1 | 1 | 1 | 3 | 2 | 2 | 16 |
| Sl | 2 | 3 | 1 | 1 | 1 | 2 | 1/2 | 1 | 15 |
| GM | 3 | 2 | 1 | 1 | 1 | 2 | 1 | 2 | 17 |
| Li | 1 | 1 | 1/3 | 1/2 | 1/2 | 1 | 1/2 | 3 | 10 |
| St | 1 | 1/2 | 1/2 | 2 | 1 | 2 | 1 | 1/2 | 12 |
| Sp | 1/2 | 1 | 1/2 | 1 | 1/2 | 1/3 | 2 | 1 | 9 |
n = 8; hmax = 8.912; CI = (hmax - n)/(n - 1) = 0.130; RCI = 1.41; CR = CI/RCI = 0.092. | |||||||||
Spring Potential Zone Using Weighted Overlay Analysis (WOA)
The SPZ was formed using various thematic layers, and their values were contrasted during the process. WOA was then used to overlay all thematic layers with the exact geographic dimensions using the reclassified cation parameter.18 This process was carried out using Equation (3).
Where Wi is the weight of potential layers, Ri is the sub-criteria score of ith criteria, and n is the total number of layers.

The potential zone was generated by comparing several thematic layers with relative values and employing WOA on the reclassified parameters. After the generation of SPZ, it was categorized into five distinct groups based on its characteristics, which is high, very high, very low, low, and moderate. Each group was assigned a specific rating and weight denoted by r and w, respectively.
Results
Weight Assigning and Normalisation
The research examined eight variables associated with spring occurrence based on expert opinion and the available literature. The ranking of each influencing factor was determined with the help of expert knowledge (Table 4). In the study, the least important sub-criteria related to groundwater recharge was given the lowest rank (1), while the most favourable sub-parameters were assigned the highest rank (5), and the moderately acceptable sub-parameters were given intermediate ranks. The Table 3 depicts details of eight factors used to construct comparison matrix. The matrix CI and the CR were computed and examined. Furthermore, CR value obtained for the present study was 0.092 for n=8, which is less than 0.1, indicating satisfactory consistency in the pairwise comparison matrix.10,21,22
Table 4 The weight and ranking of influencing parameters of the SPZ:
Slope (%) | Wt | Drainage Density (km/km2) | Wt | ||||||||||||||||
| SC | <15 | 15-35 | 35-55 | 55-75 | >75 | 15 | <0.15 | 0.15-0.35 | 0.35-0.55 | 0.55-0.75 | >0.75 | 10 | |||||||
| Rank | 1 | 2 | 3 | 4 | 5 | 1 | 2 | 3 | 4 | 5 | |||||||||
Lineament Density (km/km2) |
| Rainfall (mm) | |||||||||||||||||
| SC | <0.12 | 0.12-0.22 | 0.22-0.32 | 0.32-0.42 | >0.42 | 11 | <20 | 20-40 | 40-60 | 60-80 | >80 | 16 | |||||||
| Rank | 5 | 4 | 3 | 2 | 1 | 5 | 4 | 3 | 2 | 1 | |||||||||
Spring Proximity |
| ||||||||||||||||||
| SC | <2500 | 2500-7500 | 7500-15000 | 15000-30000 | >30000 | 9 |
| ||||||||||||
| Rank | 5 | 4 | 3 | 2 | 1 |
|
|
|
|
| |||||||||
Lithologic |
| ||||||||||||||||||
SC | Uussc | Bv | Wgsspc | Scccfw | Psoc | Cprdbs | Gms | Fscsc | Scncsc | Agbgg | Gbkksg |
| |||||||
| Rank | 1 | 3 | 1 | 1 | 3 | 1 | 3 | 3 | 2 | 4 | 5 | 10 | |||||||
SC | Snpf | Gs | Ossc | Hdodb | Qz | Fqz | Um | Gg | Qic | Py | Gqpsc | ||||||||
| Rank | 2 | 3 | 3 | 1 | 4 | 4 | 5 | 5 | 3 | 4 | 2 | ||||||||
Geomorphology | |||||||||||||||||||
| SC | Mdshv | Ldshv | Ps | Mwp | Oap | Ppc | Yap | Ofp | Afp | Pap | R | 17 | |||||||
| Rank | 5 | 5 | 4 | 5 | 1 | 3 | 1 | 2 | 2 | 1 | 1 | ||||||||
| SC | Hdshv | P | Wbl | ||||||||||||||||
| Rank | 1 | 1 | 1 | ||||||||||||||||
Soil Texture | |||||||||||||||||||
| SC | Cl | Fl/Gs | Lo | Fl | Fi | Wb | Cl/Gs | 12 | |||||||||||
| Rank | 2 | 1 | 4 | 3 | 5 | 1 | 1 | ||||||||||||
Where, subclass= Sc, AHP weight= Wt; Unstabilised and Unoxidised Sand, Silt and Clay= Uussc; Basic Volcanics= Bv; White to Greyish Sand, Silt, Pebble and Clay= Wgsspc; Sandstone, Clay, Conglomerate, Coal and Fossil Wood= Scccfw; Phyllite, Slate, Orthoquartzite and Conglomerate= Psoc; Cobble Pebble Rich Dark Brown to Reddish Brown SST =Cprdbs; Gneiss/Quartzite Pebbles in Oxidized Sand, Silt, Cl*= Gqposs; Garnetiferous Mica Schist= Gms; Feldspathic Sandstone, Carbonaceous Shale and Coal= Fscsc; Feldspathic Sandstone, Carbonaceous Shale and Coal= Scncsc; Augen Gneiss, Biotite Gneiss and Granite Gneiss= Agbgg; Garnet-Biotite-Kyanite-Sillimanite Gneiss= Gbkksg; Sandstone, Nodular Clay Beds and Plant Fossils= Snpf; Graphite Schist= Gs; Oxidised to Feebly Oxidized Sand Silt and Clay =Ossc; Highly Oxidized Dark Brown to Rd Brown Loamy Sand= Hdodb; Quartzite= Qz; Feldspathic Quartzite =Fqz, Unmapped= Um; Granitoid Gneiss= Gg; Quartzite With Intercalations of Conglomerate= Qic; Phyllite= Py; Moderately Dissected Structural Hills and Valleys= Mdshv; Low Dissected Structural Hills and Valleys= Ldshv; Piedmont Slope= Ps; Mass Wasting Products= Mwp; Older Alluvial Plain= Oap; Pediment Pediplain Complex= Ppc; Younger Alluvial Plain= Yap; Older Flood Plain= Ofp; Active Flood Plain= Afp; Piedmont Alluvial Plain=Pap; River= R; Highly Dissected Structural Hills and Valleys= Hdshv; Pond= P; Water Bodies – Lake= Wbl; Cl= Coarse Loamy; Fl/Gs= Fine Loamy/ Gravelly Subsurface; Lo=Loamy, Fine Loamy= Fl, Fine= Fi, Waterbodies= Wb; Coarse Loamy/ Gravelly Subsurface= Cl/Gs. | |||||||||||||||||||
Mapping of Spring Potential Zone
The AHP method was employed in this study to distinguish the SPZ by combining eight thematic layers in a GIS and classifying the regions where they are most likely to occur. Each characteristic was given a weight based on how it affected the occurrence of springs and groundwater. Thus, the total weights of all variables were added to determine the representative weight for a particular attribute of a prospective zone. The weight value assigned to each attribute indicates the degree of its influence on the SPZ, with a higher weight value indicating a more significant impact and a lower weight value indicating a lesser impact. The selection of the weight value for each attribute is a crucial step in the integrated analysis as it significantly affects the results. It is possible to obtain a more accurate depiction of the actual ground condition or contribution to aquifer recharge by considering each attribute relative significance. The SPZ for the Papum Pare district was created using a weighted overlay analysis of various layers (as shown in Table 4). The combined area falling under the high, medium, and very high zones was 2724.11 km2 (81.2%). The study found that areas with very high, high, and medium SPZ described for 1.3%, 24.3%, and 55.6% of the total area, respectively. In contrast, areas with low to very low potential accounted for 18.804% of the total study area, as shown in Table 5.
Table 5: The categories of identified spring potential zone of the study area.
Potential Zones | Area (km2) | Area (%) |
Very Poor | 0.14 | 0.004 |
Poor | 631.32 | 18.8 |
Medium | 1866.79 | 55.6 |
High | 814.79 | 24.3 |
Very High | 43.53 | 1.3 |
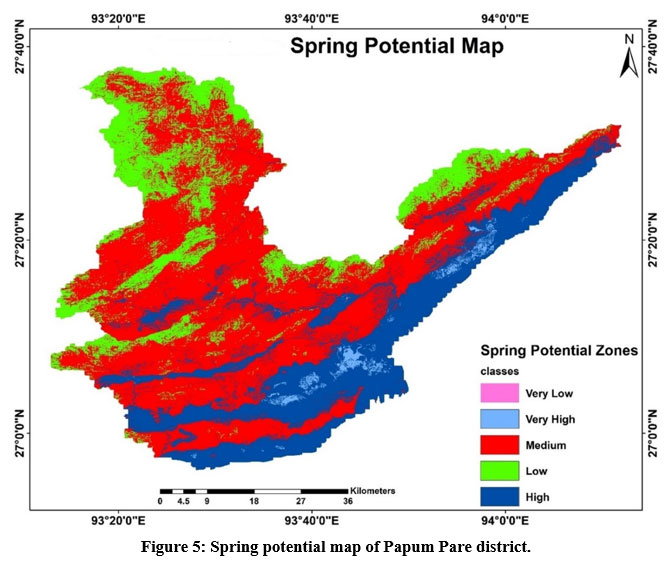 | Figure 5: Spring potential map of Papum Pare district.
|
Validation of Spring Potential Map
In modelling, the validation approach is critical for evaluating the accuracy of analyzed results. Therefore, the spring location data was used to verify the present study. The area under the curve (AUC) of a receiver operating characteristic (ROC) graph is a widely used method for evaluating a model predictive performance. The ROC curve is a graphical representation that shows the relationship between the True Positive Rate (TPR) and False Positive Rate (FPR). The TPR is plotted on the y-axis, while the FPR is on the x-axis. Figure 6 displays the AUC value from the study, which is 0.714 (71.40%), showing high prediction accuracy. These findings suggest that the AHP method is effective in the study area of SPZ. The results also indicate that 63.73% of spring locations fall under very high and high potential zones, while the area that falls under medium potential zones is 29.67%, as shown in Table 6.
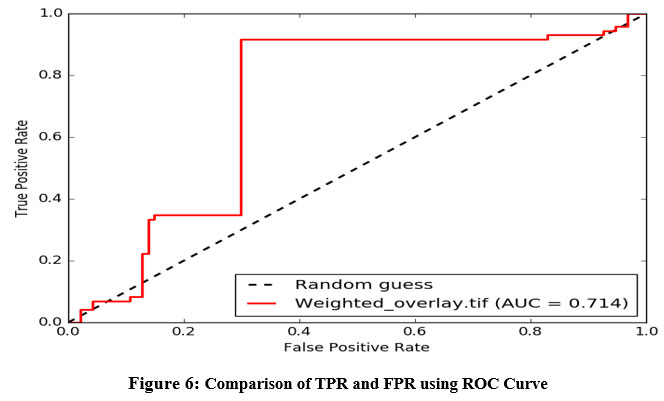 | Figure 6: Comparison of TPR and FPR using ROC Curve.
|
Table 6: Springs under different potential zones
SPZs | Number of Spring | Spring (%) |
Very Poor | -- | -- |
Poor | -- | -- |
Medium | 27 | 29.67 |
High | 51 | 56.04 |
Very High | 7 | 7.69 |
Discussion
The study used RS and a GIS-based AHP approach to delineate potential zones, a cost-effective and efficient way to gather geospatial information.15 Although this approach is limited in the Himalayas and primarily focuses on spring potential, it has significant potential for identifying groundwater recharging zones in similar settings without conducting a hydrogeological or geophysical survey.5-6,11,27 The optimal parameters for analyzing hydrological, geological, and physiographical factors may vary depending on the specific conditions of a given location. There is no universal approach to determining these parameters.25 Researchers may utilize a range of standard thematic layers, such as relief, slope, altitude, lineament density, drainage density, geology, geomorphology, lithology, flow accumulation, aquifer thickness, rainfall, and land use.7-8,24-27 Therefore, experts depend on their local field experience and professional opinions to allocate weights to these thematic layers and their characteristics. This assigning process is typically normalized using the AHP developed by Saaty. By using this method, the subjectivity associated with weighting the different thematic layers and their features can be reduced.28,29,35 According to Saaty (1990), it is recommended that the consistency ratio (CR) should be <0.1. If the calculated CR is > 0.1, reviewing and adjusting the judgments is essential until the CR< 0.1. Analysis of similar studies depicted that it was found that various studies on groundwater potential mapping have used different CR values, such as 0.07,23 0.0342,21 0.0977,26 0.0848,9 and 0.0642.36. The accuracy of the final potential map was verified using groundwater level data,23 borehole-yield data,9,10,28 groundwater well locations,6 the specific capacity of wells,37 and spring location data.5
In the present study, eight thematic layers were used in the Papum Pare district, i.e., lithology, soil texture, geomorphology, rainfall, lineament density, slope, drainage density, and spring proximity map. These layers were weighted, normalized, and assigned features based on local field experience, professional judgment, and Saaty's AHP. 9,10,14,37 The study obtained a CR value of 0.09, which is acceptable to continue the AHP-based potential mapping analysis. The study found that 81.2% of the area falls under very high to moderate SPZs, while 18.804% falls under very low to low SPZs. It indicated that the Papum Pare district has a high potential for spring occurrence. In a similar study region, Mahato et al. (2022) found that the southern foothill plains and river valleys of the district have moderate to very good groundwater potential (approximately 35.59%), while the northern, western side and high elevation range have very low to low potential (64.41%). Comparing the results of the SPZ mapping study, it was observed that the potential for high (24.3%) and very high (1.3%) spring occurrence is more significant near the bottom of the valley. The highest area falls under the medium (55.6%) potential zone in the central part of the district at medium to high elevation ranges. The presence of perennial rivers in the region further indicates the potential for spring occurrence.
The study revealed that the northern side of the district, which includes high-elevation ranges and river valleys, has a high concentration of poor and very poor (18.804%) potential areas. The accuracy of this result was confirmed by analyzing spring locations using the ROC curve, which yielded an AUC value of 0.714 and a prediction accuracy of 71.40%, indicating good predictive accuracy within the range of 0.7-0.8. Previous studies of groundwater also found that ROC results above 0.7 were satisfactory.6,10,23 The SPZ validation results were satisfactory, with 93.4% of spring locations falling under the very high to medium potential zones. Therefore, it is recommended that measures be taken to harvest water and protect water sources in these zones to ensure a sustainable long-term water supply. The construction of new artificial recharge structures in these areas could help recharge and restore aquifers and store water, reducing the stress on water demand and mitigating future water crises in the district.
Conclusions and Future Directions
In the present context of climate change, it has been observed that the vanishing and seasonal changes of springs are leading to water scarcity, thereby threatening the region's future water security. It is essential to adopt springshed development practices. In this regard, this study was conducted to map the spring potential zones, which can assist planners and policymakers in locating springs and implementing rejuvenation and protection measures. A GIS technique was utilized to obtain accurate results as an effective spatial and visual interpretation tool, which was integrated with the AHP. The SPZ map was generated using a suitable set of spring influencing parameters, including soil texture, rainfall, lithology, geomorphology, lineament density, slope, drainage density, and spring proximity map, through an RS-GIS-based approach.
The results showed that the area of SPZ is very high (=1.3%), high (=24.3%), medium (=55.6%), very poor and poor (=18.804%). Findings suggest significant potential for developing springs to provide water throughout the year. The validation statistics for the SPZ show satisfactory results, as indicated by the ROC curve analysis with an AUC of 0.714 (71.4%), indicating good prediction accuracy. Also, the identified spring locations were compared with the SPZ map, revealing that most of the area fell under the medium to very high potential zone of 93.4%. These results suggest that the layers analysed were important in determining spring occurrence and distribution. The validation of the results highlights the thematic layers significant role in the occurrence and distribution of springs. As a result, these findings can help to the conception of appropriate water management policies in the region. The study findings suggest appropriate measures for reviving springs and establishing a sustainable water supply in the medium to very high potential zones. To achieve this, the development of suitable water harvesting structures and protective measures will be explored. Furthermore, the construction of new artificial recharge structures could help to rejuvenate or replenish mountain aquifers, store water, alleviate water stress, and prepare the region for potential future water crises.
Acknowledgement
The authors would like to express their gratitude towards Govind Ballabh Pant, National Institute of Himalayan Environment (NIHE) (National Mission on Himalayan Studies under MoEF&CC India), for providing financial assistance for this research. They also acknowledge USGS Earth Explorer, Bhukoosh (Geological Survey of India), and Bhuvan (Indian Space Research Organisation) for freely providing the data used in this study.
Conflict of Interest
The authors declare that they have no competing interests relevant to the content of this article.
Funding Sources
This study is part of a scientific research project supported by G.B. Pant National Institute of Himalayan Environment and Sustainable Development, GBPNI/NMHS-2018-19/SG (National Mission on Himalayan Studies under MoEF&CC India).
References
- Kresic N, and Bonacci O. Spring discharge hydrograph. In: Kresic, N., and Stevanovic, Z., Groundwater Hydrology of Springs Engineering, Theory, Management, and Sustainability 2010; 129–163. https://doi.org/10.1016/B978-1-85617-502-9.00004-9
CrossRef - Verma R, and Jamwal P. Sustenance of Himalayan springs in an emerging water crisis. Environ Monit Assess 2022, 194(2), 1-18. https://doi.org/10.1007/S10661-021-09731-6
CrossRef - Barfal, S.S., Das, M.M., Joshi, M., Joshi, R., Kumar, K., Kumar, D., and Rai, Y.K. Response of water springs towards an earthquake: A case study from Sikkim Himalaya. J. Appl. Geophy 2022, 104792. https://doi.org/10.1016/j.jappgeo.2022.104792
CrossRef - Tambe S, Dhakal S, Dhakal D, Sharma G, Sherpa PN, Kulkarni H, Bhutia NT, Dhakal, D, Pradhan S, Sinha UK, Tiwari A, Kharel G, Phukan I, and Arrawatia ML. Scaling up Spring Revival in the Himalaya: Graduating from Spring-Centric to Aquifer-Centric Nature-Based Solutions. In: Dhyani S, Gupta A, Karki M (eds) Nature-based Solutions for Resilient Ecosystems and Societies. Disaster Resilience and Green Growth 2020; 29-50. https://doi.org/10.1007/978-981-15-4712-6_2
CrossRef - Ghimire M, Chapagain, PS, and Shrestha S. Mapping of groundwater spring potential zone using geospatial techniques in the Central Nepal Himalayas: A case example of Melamchi–Larke area. J Earth Syst Sci 2019; 128(2), 1–24. https://doi.org/10.1007/s12040-018-1048-7
CrossRef - Melese T, and Belay T. Groundwater Potential Zone Mapping Using Analytical Hierarchy Process and GIS in Muga Watershed, Abay Basin, Ethiopia. Glob Chall. 2022; 6(1), 2100068. https://doi.org/10.1002/gch2.202100068
CrossRef - Banerjee K, Kumar MS, and Tilak LN. Delineation of potential groundwater zones using Analytical hierarchy process (AHP) for Gautham Buddh Nagar District, Uttar Pradesh, India. Mater Today: Proc 2021; 44, 4976-4983. https://doi.org/10.1016/j.matpr.2020.12.917
CrossRef - Ankana and Dhanaraj G. Study of selected influential criteria on groundwater potential storage using geospatial technology and multicriteria decision analysis (MCDA) approach: A case study. Egypt. J. Remote. Sens Space Sci 2021; 24(3): 649–658. https://doi.org/10.1016/j.ejrs.2021.06.004
CrossRef - Das N, and Mukhopadhyay S. Application of multicriteria decision-making technique for the assessment of groundwater potential zones: a study on Birbhum district, West Bengal, India. Environ Dev Sustain 2020; 22(2):931–955. https://doi.org/10.1007/s10668-018-0227-7
CrossRef - Mukherjee I, and Singh UK. Delineation of groundwater potential zones in a drought-prone semi-arid region of east India using GIS and analytical hierarchical process techniques. Catena, 2020; 194:104681. https://doi.org/10.1016/j.catena.2020.104681
CrossRef - Jena S, Panda RK, Ramadas M, Mohanty BP, and Pattanaik SK. Delineation of groundwater storage and recharge potential zones using RS-GIS-AHP: Application in arable land expansion. Remote Sens Appl: Soc Environ 2020; 19:100354. https://doi.org/10.1016/j.rsase.2020.100354
CrossRef - Boufekane A, Meddi H, and Meddi M. Delineation of groundwater recharge zones in the Mitidja plain, north Algeria, using multicriteria analysis. J Hydroinformatics 2020; 22(6):1468–1484. https://doi.org/10.2166/HYDRO.2020.082
CrossRef - Jha MK, Chowdary VM, and Chowdhury A. Groundwater assessment in Salboni Block, West Bengal (India) using remote sensing, geographical information system and multicriteria decision analysis techniques. Hydrogeol J 2010; 18(7):1713–1728. https://doi.org/10.1007/s10040-010-0631-z
CrossRef - Rajasekhar M, Upendra B, Raju GS, and Anand. Identification of groundwater potential zones in southern India using geospatial and decision-making approaches. Appl Water Sci 2022: 12(4): 1–16. https://doi.org/10.1007/s13201-022-01603-9
CrossRef - Arulbalaji P, Padmalal D, and Sreelash K. GIS and AHP Techniques Based Delineation of Groundwater Potential Zones: a case study from Southern Western Ghats, India. Sci Rep 2019; 9(1), 1–18. https://doi.org/10.1038/s41598-019-38567-x
CrossRef - Bera A, Mukhopadhyay BP, and Barua S. Delineation of groundwater potential zones in Karha river basin, Maharashtra, India, using AHP and geospatial techniques. Arab J Geosci, 2020; 13(15): 1-21. https://doi.org/10.1007/s12517-020-05702-2
CrossRef - Das S. Delineation of groundwater potential zone in hard rock terrain in Gangajalghati block, Bankura district, India using remote sensing and GIS techniques. Model Earth Syst Environ 2017; 3(4):1589–1599. https://doi.org/10.1007/s40808-017-0396-7
CrossRef - Kumar P, Herath S, Avtar R, and Takeuchi K. Mapping of groundwater potential zones in Killinochi area, Sri Lanka, using GIS and remote sensing techniques. Sustain. Water Resour Manag 2016; 2(4): 419–430. https://doi.org/10.1007/s40899-016-0072-5
CrossRef - Waikar, ML, and Nilawar AP. Identification of Ground Water Potential Zone Using Remote Sensing and GIS Techniques. Int J Adv Res Publ 2014; 3(5):12163–12174. https://doi.org/10.21474/ijar01/7116.
CrossRef - Saaty TL. How to make a decision: The analytic hierarchy process. Eur J Oper Res 1990;48(1), 9–26. https://doi.org/10.1016/0377-2217(90)90057-I
CrossRef - Ahmadi H, Kaya OA, Babadagi E, Savas T, and Pekkan E. GIS-based groundwater potentiality mapping using AHP and FR models in central antalya, Turkey. Environ Sci Proc 2020; 5(1);11. https://doi.org/10.3390/IECG2020-08741
CrossRef - Goitsemang T, Das DM, Raul SK, Subudhi CR, and Panigrahi B. Assessment of Groundwater Potential in the Kalahandi District of Odisha (India) Using Remote Sensing, Geographic Information System and Analytical Hierarchy Process. J Indian Soc Remote Sens 2020; 48(12): 1739–1753,. https://doi.org/10.1007/s12524-020-01188-3
CrossRef - Mahato, R., Bushi, D., Nimasow, G., Nimasow, O.D., and Joshi, R.C, “AHP and GIS-based Delineation of Groundwater Potential of Papum Pare District of Arunachal Pradesh, India,” J Geol Soc India, 98(1), 102–112, 2022. https://doi.org/10.1007/s12594-022-1936-y
CrossRef - Hasanuzzaman M, Mandal MH, Hasnine M, and Shit PK. Groundwater potential mapping using multicriteria decision, bivariate statistic and machine learning algorithms: evidence from Chota Nagpur Plateau, India. Appl Water Sci 2022; 12(4):1-16. https://doi.org/10.1007/s13201-022-01584-9
CrossRef - Naghibi SA, Pourghasemi HR, Pourtaghi ZS, & Rezaei A. Groundwater qanat potential mapping using frequency ratio and Shannon's entropy models in the Moghan watershed, Iran. Earth Sci Inform 2015; 8(1):171-186. https://doi.org/10.1007/s12145-014-0145-7
CrossRef - Doke AB, Zolekar RB, Patel H, & Das S. Geospatial mapping of groundwater potential zones using multicriteria decision-making AHP approach in a hardrock basaltic terrain in India. Ecol. Indic., 2021; 127:1-16. https://doi.org/10.1016/j.ecolind.2021.107685
CrossRef - Saravanan S, Saranya T, Abijith D, Jacinth JJ, and Singh L. Delineation of groundwater potential zones for Arkavathi sub-watershed, Karnataka, India using remote sensing and GIS. Environ Chall 2021; 5: 100380. https://doi.org/10.1016/j.envc.2021.100380
CrossRef - Janarthanan G, & Thirukumaran V. Mapping of Groundwater Potential Zones In Pulampatti Watershed, Dharmapuri District – A Geospatial Approach. Indian J Sci 2020;13(66):1-9.
- Kumari A, and Dhanaraj G. Groundwater potential zone mapping through an integrated approach of GIS and AHP in Lalganj tehsil of Mirzapur district, Uttar Pradesh, India. Arab J Geosci 2021; 14(21): 1-15. https://doi.org/10.1007/s12517-021-08550-w.
CrossRef - Tambe S., Kharel G, Arrawatia ML, Kulkarni H, Mahamuni K, & Ganeriwala AK. Reviving dying springs: climate change adaptation experiments from the Sikkim Himalaya. Mountain Research and Development 2012; 32(1), 62-72. https://doi.org/10.1659/MRD-JOURNAL-D-11-00079.1
CrossRef - Vashisht AK., and Ranjan P. Intermittent Multi-column Sand Filter: A Unique Solution to Multiple Applications. J. Inst. Eng. India Ser. A 2020:101, 69–75. https://doi.org/10.1007/s40030-019-00408-5
CrossRef - Vashisht AK. Use of Mathematical Techniques for Determining the Reliability of Springs. In: Garg, V., Singh, V., Raj, V. (eds) Development of Water Resources in India. Water Science and Technology Library, 2017; 75: 113-124 https://doi.org/10.1007/978-3-319-55125-8_10.
CrossRef - Ranjan P, Pandey PK, Pandey V, Lepcha PT. Water Resources Assessment Issues and Application of Isotope Hydrology in North East India. In: Jha, R., Singh, V.P., Singh, V., Roy, L., Thendiyath, R. (eds) Water Resources Management and Reservoir Operation. Water Science and Technology Library 2021; 107: 103-116. https://doi.org/10.1007/978-3-030-79400-2_9.
CrossRef - Lepcha PT, Pandey PK, and Ranjan P. Hydrological significance of Himalayan surface water and its management considering anthropogenic and climate change aspects. IOP Conf Ser: Mater Sci Eng 2021; 1020(1,): 012013). https://doi.org/10.1088/1757-899X/1020/1/012013.
CrossRef - Shekhar S, & Pandey AC. Delineation of groundwater potential zone in hard rock terrain of India using remote sensing, geographical information system (GIS) and analytic hierarchy process (AHP) techniques. Geocarto Int 2015; 30(4):402–421. https://doi.org/10.1080/10106049.2014.894584
CrossRef - Biswas S, Mukhopadhyay BP, & Bera A. Delineating groundwater potential zones of agriculture dominated landscapes using GIS-based AHP techniques: a case study from Uttar Dinajpur district, West Bengal. Environ Earth Sci 2020; 79 (12):1–25. https://doi.org/10.1007/s12665-020-09053-9
CrossRef - Kumar SPJ, Elango L, & Schneider M. GIS and AHP Based Groundwater Potential Zones Delineation in Chennai River Basin (CRB), India. Sustainability 2022; 14(3):1-22. https://doi.org/10.3390/su14031830
CrossRef - Saaty TL. Applications of analytical hierarchies. Mathematics and Computers in Simulation. 1979 Mar 1;21(1):1-20.
CrossRef


