Assessment of Future Climate and Kharif Paddy Yields using CERES-Rice in the State of Andhra Pradesh
Katha Reddy Baswanth Kumar12
*
 , M. Anji Reddy1
, G.B Gohain3
, K. B. Shafeer4
, S. Sarathkumar5
and S. Sundaranayagi6
, M. Anji Reddy1
, G.B Gohain3
, K. B. Shafeer4
, S. Sarathkumar5
and S. Sundaranayagi6
1
Center for Environment,
Jawaharlal Nehru Technological University Hyderabad,
Telangana,
India
2
Andhra Pradesh State Disaster Management Authority (APSDMA),
Andhra Pradesh
India
3
SCOR SE India Branch,
Mumbai,,
Maharashtra
India
4
Vassar Labs,
Hyderabad,
Telangana
India
5
Department of Physics,
Rajiv Gandhi University of Knowledge Technologies – Nuzvid,
Andhra Pradesh
India
6
Department of Chemistry,
Periyar Maniammai University,
Vallam, Thanjavur,
Tamil Nadu
India
http://dx.doi.org/10.12944/CWE.18.1.16
Copy the following to cite this article:
Kumar K. R. B, Reddy M. A, Gohain G. B, Shafeer K. B, Sarathkumar S, Sundaranayagi S. Assessment of Future Climate and Kharif Paddy Yields using CERES-Rice in the State of Andhra Pradesh. Curr World Environ 2023;18(1). DOI:http://dx.doi.org/10.12944/CWE.18.1.16
Copy the following to cite this URL:
Kumar K. R. B, Reddy M. A, Gohain G. B, Shafeer K. B, Sarathkumar S, Sundaranayagi S. Assessment of Future Climate and Kharif Paddy Yields using CERES-Rice in the State of Andhra Pradesh. Curr World Environ 2023;18(1).
Download article (pdf)
Citation Manager
Publish History

Introduction
Rice is produced over 43.86 million hectares in India, the most significant area of any rice-growing country, with a paddy production of 157.2 million tonnes. The net irrigated area in India is 66.1 million hectares (2012–13). Only 25.12 million hectares of irrigated rice, accounting for 58 percent of the total rice acreage of 42.75 million hectares.1 Rice production in the kharif season was 4.94 million tonnes, with a mean yield of 3.35 t/ha. At the same time, the total cropped area for food grains was 2.09 million hectares, and the rice cropped area was 1.48 million ha (MOAFW-Ministry of Agriculture and Farmers Welfare, Govt. India 2017-18). The impact of climate changes is observed through temperature and rainfall changes. Inter-governmental Panel on Climate Change (IPCC-AR 6) indicates that by the 21st century, the projected mean annual temperature in South Asia will rise by 3–6 °C in the worst-case scenario (RCP8.5) and 2–3 °C in the low emission scenario (RCP 2.6).2 Floods may become more severe in Bangladesh and India as global temperature rise, urban sprawl and environmental degradation progress. The mean temperature in India is predicted to rise by 1.7 to 2°C by 2030 and by 3.3 to 4.8°C by 2080 under the business-as-usual RCP6 to RCP8.5 scenario. By the end of the century, heavy rain events will probably occur more frequently. While low and medium precipitation events will decline.3 In India, climatic change differs from region to region, affecting agricultural production.4 During the crop growing season, the temperature rise reduces yield, but the effect of CO2 fertilization can, to some extent, reduce their adverse effects.5
According to official statistics, approximately 49.82 million hectares, or 15% of India's total area, are highly vulnerable to floods. In Andhra Pradesh, the state's flood-affected paddy area (ha) is 58,571.68.6. It was canal irrigation that dominated the irrigation sector until the 1980s. After the 1990s, the switch to alternative irrigation sources began. The primary source of irrigation today accounting for 49% of net irrigation is groundwater including tube wells and wells. Groundwater accounts for 1.1 million ha, canals for 1.4 million ha, and tanks for 0.3 million ha. With the aid of 13,000 tanks and 90 irrigation projects, the state produced an irrigation potential of 4.84 million acres.7
The high-yielding cultivars currently available have a genetic yield potential that can be combined through hybrid technologies and new plant types, raising the production ceiling.8 The district-level information on land usage was acquired from the DES, focusing on kharif season rice farming (Directorate of Economics and Statistics), Andhra Pradesh Government,1988 to 2018. During the Kharif and Rabi seasons, data was collected on the area under paddy sown. During the kharif primary rice-growing season in Andhra Pradesh, 83% is under irrigation and 17% is rainfed during each season. Andhra Pradesh's total irrigated area of 39.85 lakh hectares. 62.51% was under paddy crop followed by maize with 5.47%, 4.22% under chilies & Groundnut respectively, 2.51 % under cotton and 1.93 % sugarcane crop. Kharif rice is sown when the monsoon begins in June–September, and it is harvested between November and January. This study is mostly concerned with the Kharif season. Furthermore, the study considers 13 districts for analysis in Andhra Pradesh.
It is critical for crop models to simulate how crop growth characteristics respond to various soil, agronomic management, and climatic conditions.9-10 Among Biophysical crop models, the DSSAT is one that scientists over the globe have used and evaluated for the past 30 years.11-13
The DSSAT model can estimate Biomass, Leaf Area Index, crop yield, crop water stress, nitrogen stress, soil water balance, etc. Studies on the stress on crop water requirement at the GRID level at a spatial resolution of 25km using DSSAT for sorghum crops have been conducted to understand the stress on crop water requirements during drought.14 The use of the random forest algorithm is applied in this study as a machine learning method to estimate the crop yield of wheat under present and future scenarios. 15-16 developed the RCYES tools in python to estimate the crop yield at the spatial level of 0.25° X 0.25° (25km). Two modules are included in the construction of the RCYES system, one of which prepares the DSSAT weather files from the IMD gridded data, and the other simulates the crop yield at a spatial resolution of 25 km. We have used the RCYES tools to estimate the crop yield in different climate change scenarios for this paper. Due to their superior representation of climatic changes over mounted changes in climate variables, future climate forecasts generated from climate models are frequently utilized for impact studies. To project climatic variables like precipitation, temperature, wind, and other factors depending on greenhouse gas emissions in the atmosphere, global climate models (GCMs) have been constructed. On a regional level, they cannot capture the system's traits and dynamics. The GCM output used to reveal the effects of climate change shows more significant uncertainty in predicting crop yield.17-20
Andhra Pradesh is a significant paddy-growing state in India. Crop simulation modelling is a research method that allows appropriate crop planning and implementing mitigation and adaptation measures to ensure food security by evaluating the transfer of these prospective difficulties on these crops. The CERES model predicts future agricultural yield changes and could help policymakers and the farming community develop measures for adaptation and mitigation.
Paddy yield at 0.25°× 0.25° spatial resolution in 13 districts in Andhra Pradesh for climate change scenarios during 2048– 2078 was assessed with the objectives given below:
- Spatial and temporal variability of rice yield during 1988–2018 as a baseline and 2048– 2078 as projected climate
- Assess rice yield in Andhra Pradesh and compare the results of various GCMs
Data and Methodology
Study area
The study region includes Andhra Pradesh, which has a geographical extent of 162,970 km2 and is located on the country's southeast coast between latitudes 12° 33' and 19° 09' N and longitude 76° 38' and 84° 42' E. The study area map representing Andhra Pradesh is shown in Figure 1. The study area is the state of Andhra Pradesh, with Karnataka and Telangana states towards the West, Odisha towards the North and Tamilnadu towards the South, with two regions, Coastal Andhra Pradesh and Rayalaseema, spread across 13 districts. Major rivers, viz., Godavari, Krishna, Penna, Vamsadhara and Nagavelli flow across the state and thus, the form is prone to recurring floods. The climate of Andhra Pradesh is hot and humid with a mean precipitation of 966 mm received in three seasons. The precipitation during the South-West Monsoon season which runs from June to September was 556 mm accounting for 58% of the total. The North-East Monsoon season from October to December 296 mm of precipitation equalling 31 % of the total. The winter-summer season from January to May had 114 mm of precipitation, which made up 11% of the total.
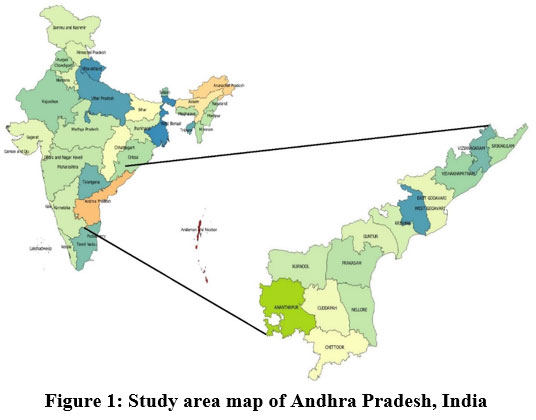 | Figure 1: Study area map of Andhra Pradesh, India
|
Methodology and Climate Data
Methodology
The study's approach is followed in 8 steps.
- Daily Rain (R) and the three variables measured are maximum temperature (T max), minimum temperature (T min) and Solar radiation (S rad) data from Indian Meteorological Department (IMD) was extracted 30 years (1988-2018) within the study area using 220 grids.
- Future projected climate scenarios under Representative Concentration Pathways (RCP8.5) mid-century climate scenarios (2048-2078) were created using the mean variability GCMs or Global circulation models derived from project for Coupled Model Inter-comparison (CMIP5). 21
- Five GCMs were selected to assess the mid-century climate conditions (cool/dry, cool/wet, hot/dry, hot/wet, and middle), which indicate the uncertainty through mean monthly rainfall and temperature variations which led to the creation of mean variability scenarios. Mean monthly precipitation and temperature data are applied to baseline data to develop mid-century scenarios and compared with the climate change scenarios developed using AgMIP 2013 (AgMIP, 2013).
- The DSSAT model's seasonal analysis module was implemented to gauge the influence of climate change on rice input using forecasted climate data derived using GCM models. During the baseline period (1988–2018), a CO2 concentration of 360 ppm was adopted, and for mid-century climate scenarios (2048-2078) with RCP 8.5, 571 ppm were used.22
- IMD gridded meteorological data for the baseline period is used to assess crop yields using python scripts from the (RCYES) within the study area.
- The future climate scenario of five GCMs for the forecast period is used to assess crop yields using python scripts from the (RCYES) within the study area.
- Directorate of Economics and Statistics (DES), Government of Andhra Pradesh, provided observed crop yield data.
- Correlation between recorded crop yield data obtained from DES and paddy yields computed using the baseline meteorological data.
- The approach adopted in this study is presented in figure 2. The RCYES system consists of two modules: one to prepare the DSSAT weather files from the IMD gridded data and the other to simulate the crop yield at a spatial level of 25 km. More details of these modules are given below.
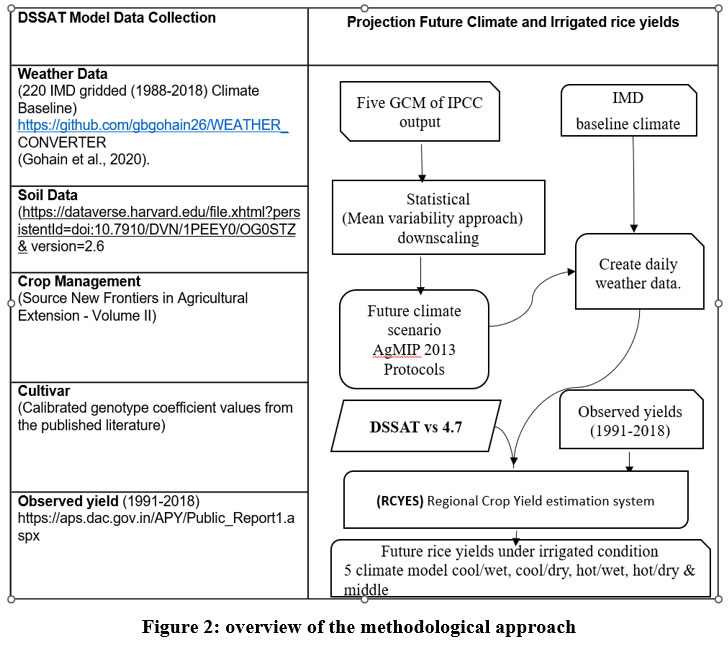 | Figure 2: overview of the methodological approach.
|
Climate data
The critical factor in driving the biophysical crop simulation model is weather data, which is obtained using the weather module. Observed daily gridded precipitation23, temperature data24 (maximum and minimum) available on the Indian Meteorological Department website was retrieved using WEATHER MODULE in the required format, i.e., GRD
GitHub users can access the module WEATHER MODULE at Source14. The simulated daily baseline and future climatic data were obtained from the (CMIP5). The future climate scenarios were generated by using twenty-nine Global Climate Models (GCMs). Out of these, five GCMs were selected through the Temperature and Precipitation (T&P) GCM Sub-setting approach. 25 As a result of this approach, twenty-nine GCMs were split into five quadrants following their deviations from the ensemble median for precipitation and temperature. The projected climate by a GCM was then classified as cool/hot and wet/dry. A mixture of those conditions makes four quadrants: cool/wet, cool/dry, hot/wet, and hot/dry. Another quadrant, middle, represents the nexus of the above four climate conditions. Table 1 presents the five GCMs used in the present study, namely CanESM2, CESM1-BGC, HadGEM2-CC, INMCM4.0 and MRI-CGCM3. Thus, the time period considered in this study are baseline period (1988-2018) and future climate scenarios at mid-century (2048-2078) based on a high representative concentration pathway (RCP 8.5), considering estimated radiative forcing reach 8.5 W/m2 by 2100. 26 Through the implementation of an enhanced-delta technique, mean and variability change scenarios were generated. 27 DSSAT's seasonal analysis module is suitable for simulating long-term growing season performance. For the first model of the season, this study utilized the CERES-Rice model to conduct a seasonal rice analysis, considering only initial soil conditions. The seasonal rice analysis component within DSSAT was employed to simulate for two periods, namely baseline (1988-2018) and mid-century (2048-2078). In addition, rice yield simulations were performed with a CO2 concentration of 360 ppm for baseline and 571 ppm for mid-century for the purpose of comprehending the effect of CO2 on the growth and yield of paddy. 28 Future mid-century simulations were performed using the 'R` script.29 Impact of climate change on rice yield was obtained spatially, using the RCYES within DSSAT (v 4.7). Table 1 provides the five GCMs selected, their spatial resolution, the CO2 conception considered, and the Climate Condition Quadrant in this study.
Table 1: The Impact of climate change on crop yield was assessed using five selected GCMs.
Name of GCMs | The institution which developed GCM | Spatial Resolution | 2x [CO2] Equivalent(°C) | Climate Condition Quadrant |
CanESM2 | Canadian Centre for Climate Modelling & Analysis | ~2.8° × 2.8° | 3.7 | Hot/Dry |
CESM1-BGC | US NSF-National Science Foundation, US DOE-Department of Energy, and the US NCAR-National Centre for Atmospheric Research | ~0.9° × 1.25° | n.a. | Middle |
HadGEM2-CC | UK Meteorological Office - Hadley Centre | 1.25° × 1.875° | n.a | Hot/Wet |
INMCM4.0 | Russian Institute for Numerical Mathematics (INM) | 1.5° × 2° | 2.1 | Cool/Dry |
MRI-CGCM3 | Japanese Meteorological Research Institute (MRI) | ~1.1° × 1.125° | 2.6 | Cool/Wet |
Soils
The soil properties needed by the DSSAT-Crop Simulation Module include soil-water balance, nutrient dynamics, and other factors that impact crop growth and development. These factors are determined by soil layer thickness, wilting point, water table depth, organic content, structure, field capacity, soil texture, root zone thickness, bulk density, soil depth, pH, saturated hydraulic conductivity, EC, soil slope, and others. The study area Andhra Pradesh State consists of six different soil textures dominated by loam. Soil data used in this study at 10-km spatial resolution is Harvard Dataverse and available at: Source
Crop type and Agronomic Management practice
Rice is a commonly cultivated cereal crop in Andhra Pradesh during the kharif season (June to September). It generally has long, short, and medium-duration rice varieties. Farmers stated that they would prefer to see features like drought resistance and more fertilizer-responsive varieties. In the present study, the three most popular cultivars grown in Andhra Pradesh are used to study how climate variability and change affect agriculture. The spread of varieties Samba Mahsuri (BPT 5204) is prevalent at around 68% and Swarna (MTU7029) is 14% and occupies the second position in Andhra Pradesh Pushyami (MTU 1075) is 2.5%. The current study focuses on medium-duration variety (150 days). Samba Mahsuri (BPT 5204), released in 1986, is the major fine grain rice and cooking quality variety grown in Kurnool, Kadapa, Chittoor, Anantapur and Guntur districts of Andhra Pradesh. Older types, MTU 7029 (Swarna), released in 1982, is the long duration (150-155 Days) short, bold grain variety grown in shallow lowland ecologies in an area of East Godavari, West Godavari. Swarna cultivar is a semi-dwarf plant type with profuse tillering variety resistant to Bacterial leaf blight with dark green foliage. Pushyami (MTU 1075) is a semi-dwarf plant with a height of 108 cm that is tolerant to leaf folder, leaf blast, BLB, BPH, WBPH and sheath blight. It is a medium-duration variety (135-140 days) with long, thin grains in Srikakulam, Vizianagaram and Visakhapatnam. The environment selected for a specific crop can change across time and space. It is crucial to comprehend the impact of climate change on rice productivity while maintaining uniformity in soil conditions, climate and crop management practices. In these impact assessment studies, it is essential to consider the effects of the climate's temporal variability. Crop models are helpful tools to translate climate information, as well as soil and management scenarios, into crop yield. For the simulation analysis, irrigated rice crops with planting dates at seven days intervals were starting from 27th June to 26th September of each year. Planting was done with a 15 x 10 cm spacing. After 30 days, the primary field area was transplanted. Under dry conditions, the young seedlings will produce more tillers quickly and with a more significant impact.30 Three equal amounts of nitrogen fertiliser were applied doses 1st split on the day of transplanting and 2nd at 15 days after the first dose and 3rd at 45 days after the second dose. District-wise fertilizer is 70 kg/ha (Srikakulam, Vizianagaram and Visakhapatnam), 80 kg/ha (East Godavari, West Godavari, Krishna) and above 140 kg/ha Guntur, Prakasam, Nellore, Chittoor, Kadapa, Anantapur, Kurnool). Crop establishment, number of Irrigations.
Transplanting is the primary method used to establish rice for farming in Andhra Pradesh. The transplanting method involves first raising seedlings in nurseries before transplanting them in the main fields, which demands a lot of labour. A more extensive labour supply brought on by population growth is one of the causes of such labour-intensive techniques for rice production. The observed average paddy yield within Andhra Pradesh state varies between 2347 kg/ha (Visakhapatnam) to 4931 kg/ha (Guntur), with a mean paddy yield of 4084 kg/ha (Table 2).
Table 2: Observed Maximum, Minimum and Mean Kharif season paddy yield(Y) during 1991-2018 within significant paddy-growing districts of Andhra Pradesh
District | Mean_Y(kg/ha) | Max_Y(kg/ha) | Min_Y(kg/ha) |
Srikakulam | 3160 | 4572 | 1221 |
Vizianagaram | 3343 | 4556 | 1842 |
Visakhapatnam | 2347 | 3374 | 1274 |
East Godavari | 3862 | 5603 | 2297 |
West Godavari | 4173 | 5669 | 2147 |
Krishna | 4658 | 6239 | 3110 |
Guntur | 4931 | 6278 | 3596 |
Prakasam | 4663 | 5856 | 3095 |
Nellore | 4823 | 5979 | 3137 |
Chittoor | 3991 | 5521 | 2936 |
Kadapa | 3997 | 5543 | 2268 |
Anantapur | 3959 | 5243 | 2790 |
Kurnool | 4700 | 6095 | 3144 |
Andhra Pradesh | 4084 | 5166 | 3318 |
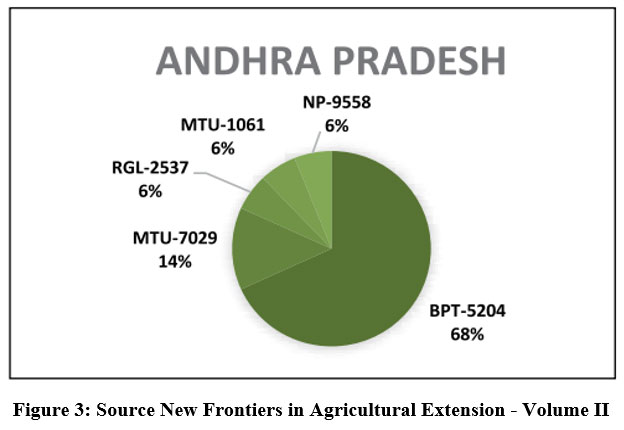 | Figure 3: Source New Frontiers in Agricultural Extension - Volume II
|
Table 3: CERES-Rice model Genetic coefficients for cultivar MTU-1010, MTU-7029 and BPT-5204.
Cultivar | P1 | P2R | P5 | P2O | G1 | G2 | G3 | PHINT | THOT | TCLDP | TCLDF | G4 | G5 |
MTU (1075) | 680.0 | 120. | 340.0 | 11.2 | 62.5 | 0.23 | 1.00 | 83.0 | 28.0 | 15.0 | 15.0 | 1.0 | 1.0 |
MTU (7029) | 740.0 | 115. | 330.0 | 11.0 | 68.0 | 0.25 | 1.00 | 83.0 | 28.0 | 15.0 | 15.0 | 1.0 | 1.0 |
BPT (5204) | 540.0 | 170. | 400.0 | 12.0 | 100. | 0.22 | 1.00 | 83.0 | 28.0 | 15.0 | 15.0 | 1.0 | 1.0 |
P1 – The period between the emergence of the seedling the end of the basic vegetative stage is expressed in growing degree days (GDD), with a 9°C base temperature used for calculation in °C-d.
P2R – The level of delay in phasic development towards panicle initiation, expressed as growing degree days (GDD) in °C-d, for each hour increase in photoperiod above P2O (GDD);
P5 - Grain-filling phase °C-days
P2O – Critical photoperiod(h)
G1 – The potential spikelet number was estimated based on the number of spikelet’s per gram of dry weight of the main stem (excluding leaf blades, sheaths, and spikes) at anthesis, expressed as a coefficient (number).
G2 – Single grain weight, expressed in grams, under ideal growing conditions;
G3 - Tillering coefficient (scalar value);
PHINT - Phyllocron interval
THOT - °C temperature (°C) above which spikelet sterility is affected.
TCLDP - °C temperature (°C) below which panicle initiation is further delayed
TCLDF - °C temperature (°C) below which spikelet sterility is affected by low temperature.
G4 - Temperature tolerance coefficient (scalar value)
Calibrated genetic coefficients used in the CERES-Rice model are taken from published literature (Arumugam et al., 2020). While P5, G1, G2, G3, and G4 govern reproductive growth, genetic coefficients P1, P2O, and P2R govern vegetative growth. Genetic coefficients of vegetative and reproductive growth stages vary based on paddy types and cultivars (Table 3).
Crop management information
The RCYES module processed the DSSAT in batch mode after creating and generating seasonal experimental files. The data on crop planting, sowing date, irrigation, fertilizer used, and crop variety are all included in the agronomic crop management information. Information about crop management was cited in New Frontiers in Agricultural Extension, Volume II.31 According to RCP 8.5, the yield of three cultivars was predicted for the transplanting date for the baseline and mid-century climate periods. Paddy yield simulations performed for baseline and mid-century (RCP 8.5) were compared to evaluate climate change impact on paddy yield, with each of the five GCMs, for thirty years.
Results and Discussion
Weather Data
Meteorological daily maximum temperature max(T), minimum temperature min(T), solar radiation (Srad) and Rain (R) derived for the baseline period and future projections are presented below.
Precipitation
Monthly variation of precipitation of the baseline period and projected rainfall for five GCMs is presented in a box-whisker plot. The horizontal lines represent the mean precipitation for each month over the period(s) considered in this study, the boxes indicate the daily rainfall lower and upper quartile boundaries, and the whiskers indicate the minimum and maximum value observed across the entire dataset.
 | Figure 4: Monthly Variation of Precipitation during baseline and future projected periods
|
Figure 4 shows the monthly climatic variability for the baseline period of 30 years (1988–2018) and off all five GCMs, with the monthly variance in precipitation datasets for the baseline period and future climate scenarios. Maximum precipitation varies between 20.03 mm per month and 38.51 mm per month throughout the winter (January-February). The interquartile range (IQR) for rainfall in the winter season varies between 6.5 mm per month and 14.7 mm per month, with the median falling between 3.5 mm per month and 8.4 mm per month. Maximum precipitation varies between 95.6 mm per month and 136.0 mm per month throughout the Pre-monsoon (Mar-May). The interquartile range (IQR) for rainfall in the Pre-monsoon season varies between 18.3 mm per month and 27.40 mm per month, with the median falling between 23.5 mm per month and 33.1 mm per month. Maximum precipitation varies between 193.7 mm per month and 323.4 mm per month throughout the monsoon (Jun-Sep). The interquartile range (IQR) for rainfall in the monsoon season varies between 45.0 mm per month and 64.8 mm per month, with the median falling between 130.9 mm per month and 130.9 mm per month. Maximum precipitation varies between 145.3 mm per month and 174.7 mm per month throughout the Post monsoon season (Oct-Dec). The interquartile range (IQR) for rainfall in the post monsoon season varies between 49.2 mm per month and 62.0 mm per month, with the median falling between 86.3 mm per month and 100.6 mm per month.
The expected change in rainfall from 2048 to 2078, using five climate models under RCP (8.5) from the baseline period (1988-2018). Figure 4 shows a considerable rise in rainfall throughout the monsoon except June and Post monsoon season over the 30 years from 2048 to 2078. However, in baseline (1988–2018) under RCP8.5, precipitation decreased during winter and pre-monsoon season, except in march. From July to October, there was a significant increase in rainfall. The most considerable change in the rain was 50.7 mm in September.
Maximum Temperature: Monthly maximum temperature variations are plotted in a box-whisker plot.
 | Figure 5: Monthly Variation of Maximum Temperature during baseline and future projected periods
|
Figure 5 shows the maximum temperature in each month over the baseline period and the median, dispersion, skewness, and extremes in maximum temperature. The IQR for the winter season ranges from 0.82 to 0.85 degrees Celsius, with the median of the maximum temperature varying between 31.9 and 34.5 degrees Celsius per month. Further, The IQR for the pre-monsoon season ranges from 0.75 to 0.83 degrees Celsius, with the median of the maximum temperature varying between 38 and 39.8 degrees Celsius per month. In the pre-monsoon season, minimum and maximum extremes were observed to be 38.9 and 40.7 degrees Celsius respectively. The IQR for the monsoon season ranges from 0.94 to 1.11 degrees Celsius, with the median of the maximum temperature varying between 34.4 and 35.9 degrees Celsius per month. In the monsoon season, minimum and maximum extremes were observed to be 35.1 and 36.7 degrees Celsius respectively. The IQR for the post-monsoon season ranges from 0.85 to 1.01 degrees Celsius, with the median of the maximum temperature varying between 31.2 and 33.0 degrees Celsius per month. The minimum and maximum extremes were observed to be 32.8 and 34.7 degrees Celsius respectively, in the post-monsoon season.
The expected change in maximum temperature from 2048 to 2078, using five climate models under RCP (8.5) from the baseline period (1988-2018). Figure 5 shows a considerable rise in maximum temperature of 2 degrees Celsius in Pre-monsoon, 1.9 degrees Celsius during the Winter season and 1.6 degrees Celsius during Monsoon and Post-Monsoon over the 30 years from 2048 to 2078 for RCP 8.5. Between March and May, there was a significant increase in maximum temperature. The most considerable change in maximum temperature was 2.3 degrees Celsius in June.
Minimum Temperature
Monthly minimum temperature variations are plotted in a box-whisker plot.
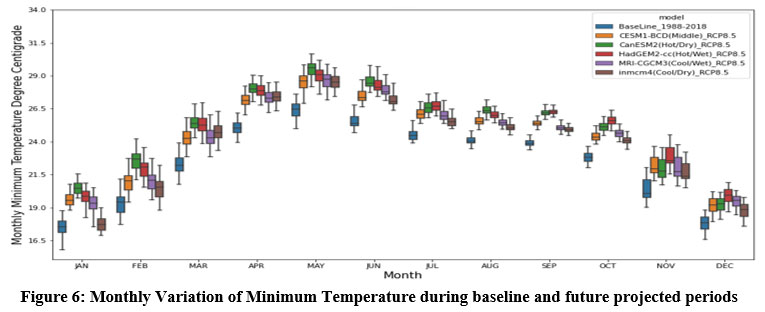 | Figure 6: Monthly Variation of Minimum Temperature during baseline and future projected periods
|
Figure 6 shows the minimum temperature in each month over the baseline period and the median, dispersion, skewness, and extremes in minimum temperature. The IQR for the winter season ranges from 0.96 to 1.09 degrees Celsius, with the median of the minimum temperature varying between 19.1 and 21.5 degrees Celsius. Further, The IQR for the pre-monsoon season ranges from 0.62 to 0.72 degrees Celsius, with the median of the minimum temperature varying between 26.6 and 27.6 degrees Celsius per month. In the pre-monsoon season, the extremes of minimum and maximum were observed to be 27.8 and 28.8 degrees Celsius. The IQR for the monsoon season ranges from 0.45 to 0.57 degrees Celsius, with the median of the minimum temperature varying between 25.6 and 26.9 degrees Celsius per month. In the monsoon season, the extremes of minimum and maximum were observed to be 26.4 and 27.8 degrees Celsius. The IQR for the post-monsoon season ranges from 0.61 to 0.66 degrees Celsius, with the median of the minimum temperature varying between 21.4 and 22.6 degrees Celsius per month. The extremes of minimum and maximum were observed to be 23.0 and 24.2 degrees Celsius, respectively, in the post-monsoon season.
The expected change in minimum temperature from 2048 to 2078, using five climate models under RCP (8.5) from the baseline period (1988-2018). Figure 6 shows a considerable rise in minimum temperature of 2.5 degrees Celsius in Pre-monsoon, 2 degrees Celsius during Winter season and 1.8 degrees Celsius during Monsoon, and 1.7 degrees Celsius in Post-Monsoon over the 30 years from 2048 to 2078 for RCP 8.5. Between March and May, there was a significant increase in minimum temperature. The most considerable change in minimum temperature was 2.5 degrees Celsius in April.
Solar Radiation: Monthly solar radiation variations are plotted in a box-whisker plot.
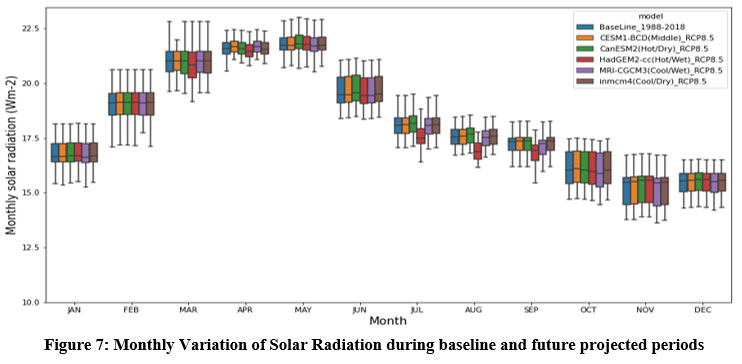 | Figure 7: Monthly Variation of Solar Radiation during baseline and future projected periods
|
Figure 7 shows the variations in solar radiation. During the winter, the maximum and minimum solar radiations were 16.8 and 19 MJ/m2/month, respectively. The median of solar radiation during the winter season changes between 17.9 and 18 MJ/m2/month, with the change in IQR from 0.48–0.50 MJ/m2/month. The median of solar radiation in the pre-monsoon season changes between 21.4 and 21.5 MJ/m2/month, with the change in IQR from 0.62–0.74 MJ/m2/month. The median of solar radiation in the monsoon season changes between 17.7 and 18.1 MJ/m2/month, with the change in IQR from 0.78–0.83 MJ/m2/month. The median of solar radiation in post-monsoon season changes between 15.5 and 15.6 MJ/m2/month, with the shift in IQR from 0.91–0.95 MJ/m2/month.
District-wise Future Climate Scenarios
The anticipated future climate change was calculated using climate change scenarios from the baseline period (1988–2018) to reflect the expected difference in climatic variables over a specified time period. For the baseline period, the meteorological information from IMD was taken into account. For each of the GCMs, the expected change in future climate for 30 years between 2048 and 2078 was computed for the RCP 8.5. Future climate scenarios were assessed using baseline changes in each district of Andhra Pradesh's mean maximum temperature max(T), minimum temperature min(T), solar radiation (Srad) and Rain (R). Table 4 shows the Annual average (Jan-Dec), max(T), min(T), solar radiation (Srad) and Rain (R) over the state of Andhra Pradesh.
On the other hand, the climate scenario data for the RCP 8.5 scenario were derived using (CMIP5) GCMs using mean and variability techniques for future periods of the 2040's based on the daily baseline time series (1988–2018). The annual maximum temperature max(T) is likely to increase over Andhra Pradesh state (range from 0.9 to 3.1 degrees Celsius) for the mid-century concerning the baseline period in the Chittoor district (3.1 degrees Celsius) in Hot/Dry. Maximum and minimum are expected to increase over Andhra Pradesh with an average of 1.7 and 1.9 degrees Celsius, respectively (2048-78). Chittoor is expected to witness significant increases in the maximum and minimum temperatures among all the districts. In contrast, Srikakulam may experience the lowest temperature in future periods. The PRECIS model estimates for the A1B scenario for the years 2021–2050 were taken into consideration to reflect the future climate. The projected rise in maximum and minimum temperatures is a significant aspect of the change in climate. For maximum temperature, the expected changes are 1.3°C in East Godavari and 2.0°C in Kurnool, while for minimum temperature are 1.8°C in East Godavari and 2.1°C in Nellore 32.
Under RCP 8.5, hot and dry areas experience an increase in annual solar radiation for all five GCMs. In Hot/Wet and Cool/Wet scenarios during the mid-century, the solar radiation dropped by 0.1 to 0.2 MJ/m2/month under RCP 8.5.
Annual precipitation was predicted to decrease for two climate models, Hot/Dry and Cool/Dry, within the five GCM. The Middle, Hot/Wet, and Cool/Wet climate scenarios experience a rise in mean annual precipitation under the RCP 8.5 scenario. The mid-century mean yearly rainfall in Srikakulam increased by 26 to 311.9 mm, while the mid-century annual mean rainfall season decreased by 35.7 to 188.3 mm. The mid-century means yearly rainfall in Vizianagaram increased by 23 to 383.2 mm, while the mid-century annual mean rainfall decreased by 29.8 to 189.9 mm. The mid-century yearly mean rainfall in Visakhapatnam increased by 89.7 to 423.9 mm, while the mid-century annual mean rainfall decreased by 34.4 to 139.1 mm. The mid-century yearly mean rainfall in East Godavari increased by 99 to 422.4 mm, while the mid-century annual mean rainfall decreased by 22.9 to 108.6 mm. The mid-century mean yearly rainfall in West Godavari increased by 108.1 to 475.1 mm, while the mid-century annual mean rainfall decreased by 20.2 to 115 mm. The mid-century yearly mean rainfall in Krishna increased by 100.9 to 489.7 mm, while the mid-century annual mean rainfall decreased by 23.6 to 119.4 mm. The mid-century average yearly rainfall in Guntur increased by 86.5 to 435.5 mm, while mid-century annual average rainfall decreased by 23.3 to 39.5 mm. The mid-century yearly average rainfall in Prakasam increased by 62.2 to 362.7 mm, while the mid-century annual mean rainfall decreased by 10.3 to 33 mm. The mid-century mean yearly rainfall in Nellore increased by 43.2 to 490.5 mm, while the mid-century annual mean rainfall decreased by 56.1 to 84.2 mm. Chittoor annual mean rainfall increased by 25.3 to 438.1 mm during the mid-century, while it decreased by 14.1 to 79.6 mm during the same period. The mid-century annual mean rainfall in Kadapa increased by 4.3 to 365.9 mm, while the mid-century annual mean rainfall decreased by 7.1 mm. Anantapur annual mean rainfall increased by 9.8 to 188.6 mm by the mid-century. Kurnool annual mean rainfall increased by 1.0 to 303 mm by the mid-century. By the middle of the 2040's, Nellore, Kurnool, and Anantapur districts are predicted to have an increase in rainfall., where the maximum increase in precipitation is 490.5. In contrast, it may be Vizianagaram's (189.9) maximum decrease in rainfall in Andhra Pradesh.
Table 4: District-wise annual (Jan-Dec) change in mean maximum temperature max(T), minimum temperature min(T), solar radiation (Srad) and Rain (R) in Andhra Pradesh.
| Districts | Baseline Period (1988-2018) | CESM1- BGC (Middle)_RCP8.5 | ||||||
| max(T) | min(T) | Srad | Rain(R) | max(T) | min(T) | Srad | Rain(R) | |
| Srikakulam | 31.9 | 21.8 | 17.3 | 1205.6 | 1.8 | 1.6 | 0 | 26.0 |
| Vizianagaram | 31.7 | 21.7 | 17.3 | 1142.2 | 1.8 | 1.6 | 0 | 23.0 |
| Vishakhapatnam | 31.8 | 22.3 | 16.9 | 1232.2 | 1.9 | 1.7 | 0 | 89.7 |
| East Godavari | 32.3 | 22.8 | 17.1 | 1214.3 | 1.8 | 1.7 | 0 | 99.0 |
| West Godavari | 33 | 23.1 | 17.5 | 1178.2 | 1.9 | 1.8 | 0 | 108.1 |
| Krishna | 33.6 | 23.4 | 17.7 | 1101.5 | 1.8 | 1.8 | 0 | 100.9 |
| Guntur | 33.8 | 23.2 | 18.1 | 943.8 | 1.9 | 1.8 | 0 | 86.5 |
| Prakasam | 34.3 | 23.4 | 18.5 | 899.2 | 1.8 | 1.7 | 0 | 62.2 |
| Nellore | 34 | 23.5 | 18.4 | 1094.8 | 1.7 | 1.6 | 0 | 43.2 |
| Chittoor | 33 | 22.1 | 18.7 | 978.7 | 1.8 | 1.7 | 0 | 25.3 |
| Kadapa | 33.6 | 22.4 | 18.8 | 794.1 | 1.9 | 1.8 | 0 | 28.9 |
| Anantapur | 32.4 | 20.8 | 19.1 | 604.1 | 1.9 | 1.9 | 0 | 25.4 |
| Kurnool | 34.2 | 22.2 | 19.3 | 714.1 | 1.9 | 1.9 | 0 | 40.3 |
| Districts | CanESM2 (Hot/Dry)_RCP8.5 | HadGEM2_CC (Hot/Wet)_RCP8.5 | ||||||
max(T) | min(T) | Srad | Rain(R) | max(T) | min(T) | Srad | Rain(R) | |
| Srikakulam | 1.9 | 1.8 | 0.1 | -188.3 | 1.7 | 1.8 | -0.1 | 311.9 |
| Vizianagaram | 1.9 | 1.8 | 0.1 | -189.9 | 1.7 | 1.9 | -0.1 | 383.2 |
| Vishakhapatnam | 2.5 | 2.5 | 0.1 | -139.1 | 1.8 | 2 | -0.1 | 423.9 |
| East Godavari | 2.7 | 2.7 | 0 | -108.6 | 1.8 | 2 | -0.1 | 422.4 |
| West Godavari | 2.6 | 2.6 | 0 | -115.0 | 1.9 | 2.4 | -0.1 | 475.1 |
| Krishna | 2.4 | 2.4 | 0 | -119.4 | 1.9 | 2.4 | -0.1 | 489.7 |
| Guntur | 2.3 | 2.3 | 0 | -39.5 | 2 | 2.5 | -0.1 | 435.5 |
| Prakasam | 2.7 | 2.6 | 0 | -10.3 | 2.1 | 2.6 | -0.2 | 362.7 |
| Nellore | 2.8 | 2.6 | 0 | -84.2 | 2.1 | 2.3 | -0.2 | 343.3 |
| Chittoor | 3.1 | 2.6 | 0.1 | -79.6 | 2.3 | 2.7 | -0.2 | 438.1 |
| Kadapa | 2.8 | 2.7 | 0 | 4.3 | 2.3 | 2.8 | -0.2 | 365.9 |
| Anantapur | 2.8 | 2.6 | 0 | 25.1 | 2.4 | 2.9 | -0.1 | 184.2 |
| Kurnool | 2.8 | 2.7 | 0 | 43.8 | 2.3 | 2.9 | -0.1 | 303.0 |
| Districts | INMCM4.0 (Cool/Dry) RCP_8.5 | MRI-CGCM3 (Cool/Wet) _RCP8.5 | ||||||
max(T) | min(T) | Srad | Rain(R) | max(T) | min(T) | Srad | Rain(R) | |
| Srikakulam | 1.1 | 1.3 | 0 | -35.7 | 1.3 | 1.7 | -0.1 | 208.3 |
| Vizianagaram | 1.1 | 1.3 | 0 | -29.8 | 1.3 | 1.9 | 0 | 86.4 |
| Vishakhapatnam | 1.2 | 1.4 | 0 | -34.4 | 1.3 | 1.9 | -0.1 | 223.3 |
| East Godavari | 1.1 | 1.3 | 0 | -22.9 | 1.2 | 1.8 | -0.1 | 434.4 |
| West Godavari | 1.1 | 1.3 | 0 | -20.2 | 1.2 | 1.8 | -0.1 | 467.9 |
| Krishna | 1.1 | 1.4 | 0 | -23.6 | 1.2 | 1.8 | -0.1 | 407.6 |
| Guntur | 1.2 | 1.4 | 0 | -23.3 | 1.2 | 1.9 | 0 | 321.1 |
| Prakasam | 1.1 | 1.3 | 0 | -33.0 | 1.1 | 1.8 | 0 | 328.5 |
| Nellore | 1 | 1.1 | 0 | -56.1 | 1.1 | 1.7 | 0 | 490.5 |
| Chittoor | 1 | 1.2 | 0 | -14.1 | 1 | 1.8 | 0 | 332.3 |
| Kadapa | 1.1 | 1.4 | 0 | -7.1 | 0.9 | 1.8 | 0 | 296.4 |
| Anantapur | 1.1 | 1.5 | 0 | 9.8 | 1 | 1.8 | 0 | 188.6 |
| Kurnool | 1.2 | 1.7 | 0 | 1.0 | 1 | 1.8 | 0 | 246.4 |
The Rice crop is the most grown under irrigated in Andhra Pradesh. For the mid-century RCP8.5, the seasonal module in DSSAT was employed to simulate rice yield using climate, agronomic management, and soil data had been entered into the model. The rice cultivars in Andhra Pradesh were thought to be represented by the rice genetic coefficients33. Setting assumptions that the rice will grow continuously over the mid-century era with no changes in management strategies other than weather and CO2 concentrations under RCP8.5 scenarios was crucial for climate change scenario analysis. For the simulation analysis, irrigated rice crops with the planting dates at seven days intervals were starting from 27th June to 26th September of each year, which is routine practice in Andhra Pradesh. During the Kharif season, 33 plants were allowed per square meter. To assess change relative to the baseline (1988-2018) across the mid-century period, the model was built for each of the five GCMs and one RCP8.5 (2048-2078). The percentage change in yield as of the mean the yield of the crop was estimated by the CERES model in kilograms per hectare based on the climate scenarios (GCM) for the years 2048 to 2078 and minus the mean observed yield for baseline (1988 to 2018), to the mean observed yield for baseline multiplied by 100.
Meteorological and Paddy Yield Relationships
To simulate CERES-Rice within the DSSAT package using baseline and projected meteorological data, the RCYES was created using Python scripts.
The correlation between mean, minimum and maximum paddy yields calculated using baseline meteorological data and observed paddy yield data from DES and paddy yields assessed based on projected meteorological data is given in table 5.
• The correlation between baseline and DES yields mean yield was 0.87, with a maximum yield of 0.86 and a minimum yield of 0.82. The correlation baseline vs. INMCM4.0 GCM showed a mean yield of 0.92, with a maximum yield of 0.95 and a minimum yield of 0.89.
Table 5: Correlation between paddy yield based on baseline and projected meteorological data
Correlation among All Districts | Mean Yield | Max Yield | Min Yield |
Baseline vs DES | 0.87 | 0.86 | 0.82 |
Baseline vs. CanESM2(Hot/Dry)_D | 0.66 | 0.82 | 0.55 |
Baseline vs. CESM1-BGC(Middle)_F | 0.83 | 0.93 | 0.70 |
Baseline vs. HadGEM2_CC(Hot/Wet) _J | 0.67 | 0.84 | 0.55 |
Baseline vs. INMCM4.0(Cool/Dry) _L | 0.92 | 0.95 | 0.89 |
Baseline vs. MRI-CGCM3(Cool/Wet) | 0.94 | 0.96 | 0.88 |
Table 6: Percentage changes in mid-century (2048–2078) Paddy yield relative to the baseline period (1988–2018) in Andhra Pradesh.
| Planting Date | CESM1-BGC (Middle) | CanESM2 (Hot/Dry) | HadGEM2_CC (Hot/Wet) | INMCM4.0 (Cool/Dry) | MRI-CGCM3 (Cool/Wet) | Mean of Five Models |
| 27-Jun | 14.7 | -9.6 | 8.6 | 17.7 | 16.4 | 9.6 |
| 04-Jul | 4.3 | -16.7 | -5.2 | 11.3 | 12.3 | 1.2 |
| 11-Jul | 3.8 | -17.9 | -1.4 | 11.3 | 13.7 | 1.9 |
| 18-Jul | -10.3 | -23.4 | -14.1 | -2.4 | 2.8 | -9.5 |
| 25-Jul | -7.2 | -23.0 | -13.5 | 1.2 | 3.3 | -7.9 |
| 01-Aug | 1.6 | -18.1 | -8.1 | 8.1 | 7.6 | -1.8 |
| 08-Aug | 8.2 | -16.2 | 4.3 | 13.2 | 10.8 | 4.1 |
| 15-Aug | 6.8 | -16.9 | -0.4 | 10.5 | 8.9 | 1.8 |
| 22-Aug | 4.6 | -17.4 | -3.4 | 7.7 | 8.2 | 0.0 |
| 06-Sep | 4.5 | -18.0 | -4.8 | 9.6 | 9.9 | 0.2 |
| 12-Sep | 0.4 | -20.3 | -10.7 | 7.6 | 9.6 | -2.7 |
| 19-Sep | -4.0 | -23.0 | -15.1 | 4.9 | 5.0 | -6.5 |
| 26-Sep | 0.6 | -20.4 | -9.7 | 7.2 | 8.9 | -2.7 |
Effects of planting date, RCP8.5, and the yield on average percent changes in mid-century (2048–2078) paddy yield relative to the baseline period (1988–2018) in Andhra Pradesh.
Under RCP 8.5, the maximum (23.4%) decline in yield relative to the baseline period was simulated with CanESM2(Hot/Dry) on the 18th July planting date, while the most negligible reduction in yield was HadGEM2_CC(Hot/Wet) on 15th August for RCP8.5. Under RCP 8.5, the maximum (17.7%) increases in yield relative to the baseline period were simulated with INMCM4.0(Cool/Dry) on the 27th June planting date, while the slightest increase in yield was simulated with CESM1-BGC(Middle) on 12th September for RCP8.5. Among 13th transplanting dates increase in yield on 27-Jun (9.6%), 4-Jul (1.2%), 11-Jul (1.9%), 8-Aug (4.1%), 15-Aug (1.8%), 22-Aug (0%), 6-Sep (0.2%) in yield ranging from 2.7 to 9.5 on 12th and 26th September, increasing 18th July respectively compared to the baseline yield (Table 6). In the mid-century, there was a significant yield difference between the GCMs RCPs for 18th July. Based on the five GCMs, the simulation of paddy yield had a coefficient of variation of about 21.3%. (Table 7).
Table 7: percentage coefficient of variance between the actual and simulated paddy yields.
Planting Date | Baseline | CV(%) | Mean Yield (kg/ha) Models | CV(%) Models |
27-Jun | 5150 | 20.4 | 5643 | 19.2 |
04-Jul | 4706 | 18.6 | 4763 | 21.0 |
11-Jul | 4453 | 20.4 | 4538 | 24.4 |
18-Jul | 4926 | 15.1 | 4460 | 19.5 |
25-Jul | 4756 | 18.0 | 4382 | 18.9 |
01-Aug | 5223 | 9.2 | 5130 | 17.0 |
08-Aug | 3969 | 27.4 | 4130 | 24.8 |
15-Aug | 4076 | 27.6 | 4148 | 25.5 |
22-Aug | 4280 | 26.0 | 4278 | 21.9 |
06-Sep | 4587 | 23.9 | 4597 | 18.7 |
12-Sep | 4804 | 26.0 | 4676 | 21.0 |
19-Sep | 5452 | 20.1 | 5100 | 15.3 |
26-Sep | 4536 | 33.4 | 4414 | 29.4 |
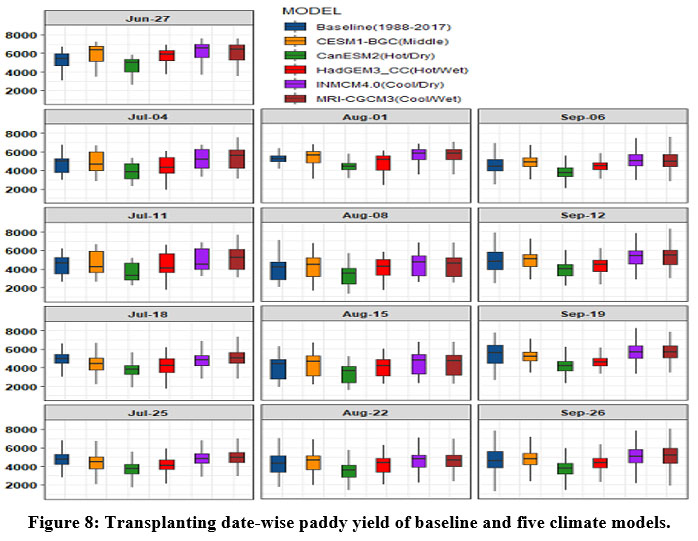 | Figure 8: Transplanting date-wise paddy yield of baseline and five climate models.
|
Spatial Patterns of Mean yield during the baseline period (1988-2018)
The yield simulation within the study area was conducted using the DSSAT model by incorporating relevant soil and weather data from the baseline period (1988-2018) in each grid. The model simulation used the baseline weather data from IMD and the projected weather data from five GCMs. Using experimental meteorological data, the spatial analysis of mean yield revealed an average yield of 4555 kg/ha, with a range of 2520 to 6151 kg/ha. Because of favourable environmental conditions, Guntur had a relatively higher mean yield (6151 kg/ha) among paddy-growing districts. In Visakhapatnam, the minimum yield value is 2520 kg/ha.
Spatial Patterns of Mean yield GCMs (2048-2078)
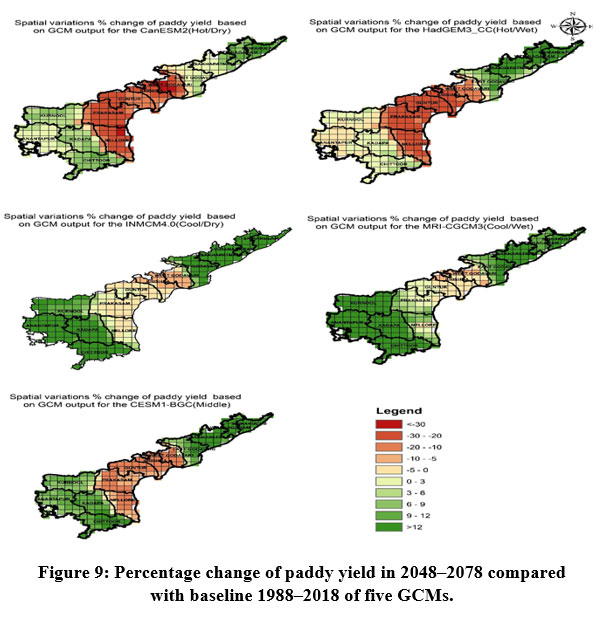
Figure 9 depicts the spatial distribution of percentage change in 2048-2078 GCM-projected versus baseline period (1988-2018). For five GCM outputs, the influence of climate change on paddy yield was simulated for each grid using observed weather data and projected weather data from RCP 8.5 climatic scenarios (2048–2078). The efficacy of the GCMs was determined by comparing the outputs of the DSSAT model with their projections for the mid-century period, in a manner similar to how the performance of the GCMs was evaluated during the baseline period. According to the 2048–2078 projections of the CanESM2(Hot/Dry) and HadGEM3 CC(Hot/Wet) GCMs, the mean yield may decrease from 4555 kg/ha (the baseline) to 3660 and 4241 kg/ha, respectively. While the increased mean yield during future periods to 4577,4863 and 4887 kg/ha CESM1-BGC(Middle), INMCM4.0(Cool/Dry) and MRI-CGCM3(Cool/Wet) GCMs, respectively. Srikakulam, Vizianagaram, Visakhapatnam, East Godavari district.
 | Figure 9: Percentage change of paddy yield in 2048–2078 compared with baseline 1988–2018 of five GCMs.
|
Changes of Paddy yield under changing climate
The DSSAT version 4.7.1 was utilized to determine the impact of the worst-case scenario for climate change on rice yield for Andhra Pradesh was employed (RCP8.5). The yield in 220 grids of the study area is simulated using the DSSAT model by using soil and climatic data baseline and future periods. In general, DSSAT predicted increased percentage change yields by 8.4%, 8.3% and 2.4 MRI-CGCM3(Cool/Wet), INMCM4.0(Cool/Dry) and CESM1-BGC(Middle) GCMs, respectively and a decrease in percentage change in yields by -5.3% and -4.1% in CanESM2(Hot/Dry) and HadGEM2_CC(Hot/Wet) GCMs respectively. West Godavari, Krishna, Nellore, Prakasam, and Guntur decreased yields in the district, with a loss of roughly 10.7%. While Srikakulam, Visakhapatnam, Anantapur, Chittoor, Vizianagaram, East Godavari, Kadapa, and Kurnool are a district-positive impact on climate change of 9.8%. This is consistent with 34-35, who found that rice productivity will drop as global temperatures rise. Rice plants are harmed by extreme temperatures, both low and high. High temperatures hamper rice production in tropical areas. The spatial yield results in all significant states with considerable rice production opposed.36 They predicted a 10–15 percent increase in rice yield in Andhra Pradesh, Tamil Nadu, and Karnataka due to climate change. The study indicates that West Bengal, Chhattisgarh, Karnataka, Punjab, Tamil Nadu, Uttaranchal, Kerala, and Jharkhand may experience a considerable yield gap (>1.5 t/ha), requiring revised policies in these states to maintain rice production. Showing how rice productivity is projected to decline and fall short of the potential yield in many climate change scenarios. The rise in evaporation, transpiration rates, and crop water requirements that would come with increased temperatures could be responsible for this. However, the amount of rainfall may not change in the future and precipitation patterns are expected to advance, implying that crop water constraints will result from a reduction in water availability during rainfed rice seasons. Lower rice yield may come from increased water requirements for crops and irrigation.37 Rice yield will be significantly impacted by the coming together of rising temperatures and erratic rainfall.
Changes in fertilizer application rates and, if available, irrigation are two examples of short-run adaptability. Long-term adaptations could include modifications to crop types, alternative dates for planting and harvesting, adjustments to the degree of mechanization, and alterations to the types of nutrients and fertilizers.38 using the ORYZAI and Info crop-rice models, examine how increasing CO2 and temperature affected the yield of irrigated rice in eastern India. The study's results suggest that elevated CO2 concentrations can boost rice output because high temperatures make rice spikelets sterile. Each would lead to a 10% reduction in rice grain production. Increase by 1 degree Celsius over 32 degrees Celsius as in the minimum temperature. Increased respiration losses result from an increase in the minimum temperature 39-41 while reducing the grain Filling length stage and the cell size during maturation.42 Rice yields will be reduced by 7 to 10% in 2020 compared to 2050 and 2080 when they will be reduced by 11 to 15% and 13 to 21%, respectively.43 Their findings also revealed C3 and C4 crop yields would be reduced under the RCP 4.5. This would have an impact on both local food security and livelihood security. Proper planning is, therefore, essential for ensuring secure livelihoods and sustained crop production. At the same time, policy changes are necessary for success—viable scenarios for future crop productivity.
Conclusion
Changes in meteorological conditions cause variability in paddy crop yields. With rising temperatures and CO2 concentrations, as well as the variability of rainfall, crop yields are likely to be impacted in future climatic scenarios. The rain increases throughout the monsoon except June and Post monsoon season over the 30 years from 2048 to 2078. However, there was a decrease in rainfall in winter and pre-monsoon season except in march from the baseline period (1988–2018) for RCP 8.5. Between July and October, there was a significant increase in rainfall. The most considerable change in the rain was 50.7 mm in September. Hence, capturing excess runoff water for supplemental irrigation will be provided during critical growth phases. DSSAT predicted increased percentage change yields by 8.4%, 8.3%, and 2.4 MRI-CGCM3(Cool/Wet), INMCM4.0(Cool/Dry), and CESM1-BGC(Middle) GCMs, respectively, and a decrease in percentage change in yields by -5.3% and -4.1% in CanESM2(Hot/Dry) and HadGEM2_CC(Hot/Wet) GCMs respectively over future scenarios versus the baseline period. West Godavari, Krishna, Nellore, Prakasam, and Guntur decreased yields in the district, with a loss of roughly 10.7%. At the same time, the district's positive impact is Srikakulam, Visakhapatnam, Anantapur, Chittoor, Vizianagaram, East Godavari, Kadapa, and Kurnool climate change of 9.8%. If an excellent agronomic management strategy, such as advanced planting, is not employed, climate variability is projected to affect rice development and yield negatively.
Acknowledgements
The corresponding author would like to thank the Center for Environment, Jawaharlal Nehru Technological University, Hyderabad for granting the Ph.D. research work. The authors duly acknowledge the India Meteorological Department (IMD) for providing observed gridded rainfall and temperature datasets. The author is also profoundly grateful to the Dr. Hari Prasad VAJJA Hydrologist and Resilience Expert (NORCAP Roaster) provided scientific inputs to prepare the final version of the manuscript. Authors are also thankful to APSDMA for cooperation and inputs throughout the research.
Conflict of Interest
On behalf of all authors, the corresponding author states that there is no conflict of interest.
Funding Sources
The author(s) received no financial support for the research, authorship, and/or publication of this article.
Reference
- Mandal K.G,Thakur A.K, & Ambast S.K. Current rice farming, water resources and micro-irrigation. Current Science. 2019;116(4):568-576
CrossRef - Intergovernmental Panel on Climate Change (IPCC) Working Group II. Climate Change 2022: Impacts, Adaptation, and Vulnerability. Cambridge University Press Cambridge, UK and New York, NY, USA, pp. 3–33.
- Chaturvedi R.K, Joshi J, Jayaraman M, Bala G, Ravindranath N.H. Multi-model climate change projections for India under representative concentration pathways. Current Science. 2012;103(7): 791-802.
- Mall R.K, Singh R, Gupta A, Srinivasan G, Rathore L.S. Impact of climate change on Indian agriculture. a review. Climatic change.2006;78(2):445-478.
CrossRef - Chandran MA.S, Banerjee S, Mukherjee A, Nanda M.K, Kumari V.V. Evaluating the long-term impact of projected climate on rice-lentil-groundnut cropping system in Lower Gangetic Plain of India using crop simulation modelling. International Journal of Biometeorology. 2022;66(1):55-69.
CrossRef - Koppa N, Amarnath G. Geospatial assessment of flood-tolerant rice varieties to guide climate adaptation strategies in India. Climate. 2021;9(10):151.
CrossRef - Prasuna V, Suneetha B, Madhavi K, Haritha G.S, Murthy G.R. Irrigation status, issues and management in Andhra Pradesh. Journal of Pharmacognosy and Phytochemistry. 2018;1532(1080): 304-309
- Siddiq E.A. Bridging the rice yield gap in India. See Ref. 2000; 74:84-111.
- Babel MS, Agarwal A, Swain DK, Herath S. Evaluation of climate change impacts and adaptation measures for rice cultivation in Northeast Thailand. Climate Research. 2011;46(2):137-146.
CrossRef - Banerjee S, Das S, Mukherjee A, Mukherjee A, Saikia B. Adaptation strategies to combat climate change effect on rice and mustard in Eastern India. Mitigation and Adaptation Strategies for Global Change. 2016;21(2):249-261.
CrossRef - Fechter J, Allison B.E, Sivakumar M.V.K, Ploeg R.R, Bley J. An evaluation of the SWATRER and, CERES-Millet models for southwest Niger. Proceedings of the Niamey Workshop, 1991.
- Alexandrov V.A, Hoogenboom G. The impact of climate variability and change on crop yield in Bulgaria. Agricultural and forest meteorology. 2000 ;104(4):315-327.
CrossRef - Baigorria G.A, Jones J.W, Shin D.W, Mishra A, O'Brien J.J. Assessing uncertainties in crop model simulations using daily bias-corrected regional circulation model outputs. Climate Research. 2007; ;34(3):211-222.
CrossRef - Gohain G.B, Singh K.K, Singh R.S, Dakhore K.K, Ghosh K. Application of CERES-sorghum crop simulation model DSSAT v4. 7 for determining crop water stress in crop phenological stages. Modeling Earth Systems and Environment. 2022;8(2):1963-1975.
CrossRef - Gohain G.B, Singh K.K, Singh R.S, Singh P. Regional Crop Yield Estimation System (RCYES) using a crop simulation model DSSAT V4. 7: concept, methods, development, and validation. JOURNAL OF AGROMETEOROLOGY. 2020; 22:33-38.
- Bhatnagar R, Gohain G.B. Crop yield estimation using decision trees and random forest machine learning algorithms on data from terra (EOS AM-1) & Aqua (EOS PM-1) satellite data. Machine Learning and Data Mining in Aerospace Technology. Springer, Cham, 2020;107-124.
CrossRef - Matthews R.B, Horie T, Kropff M.J, Bachelet D, Centeno H.G, Shin J.C, Mohandass S, Singh S, Defeng Z, Lee M.H. A regional evaluation of the effect of future climate change on rice production in Asia. Modeling the Impact of Climate Change on Rice Production in Asia (eds. Matthews, RB, Kropff, MJ, Bachelet, D. and van Laar, HH). CAB International, Oxon, UK. 1995:95-139.
CrossRef - Soora N.K, Aggarwal P.K, Saxena R, Rani S, Jain S, Chauhan N. An assessment of regional vulnerability of rice to climate change in India. Climatic change. 2013;118(3):683-699.
CrossRef - Shrestha S. Adaptation strategies for rice cultivation under climate change in Central Vietnam. In Climate Change Impacts and Adaptation in Water Resources and Water Use Sectors 2014:93-119. Springer, Cham.
CrossRef - Rao A.V.M, Shanker A.K, Rao V.U.M, Rao V.N, Singh A.K, Kumari P, Singh C.B, Verma P.K, Kumar P.V, Bapuji Rao B, Dhakar R. Predicting irrigated and rainfed rice yield under projected climate change scenarios in the eastern region of India. Environmental Modeling & Assessment. 2016 ;21(1):17-30.
CrossRef - Taylor KE, Stouffer RJ, Meehl GA. An overview of CMIP5 and the experiment design. Bulletin of the American meteorological Society. 2012;93(4):485-498.
CrossRef - Ruane AC, McDermid S, Rosenzweig C, Baigorria GA, Jones JW, Romero CC, DeWayne Cecil L. Carbon–Temperature–Water change analysis for peanut production under climate change: a prototype for the AgMIP Coordinated Climate?Crop Modeling Project (C3MP). Global change biology. 2014 ;20(2):394-407.
CrossRef - Pai D.S, Sridhar L, Badwaik M.R, Rajeevan M. Analysis of the daily rainfall events over India using a new long period (1901–2010) high resolution (0.25× 0.25) gridded rainfall data set. Climate dynamics. 2015;45(3):755-776.
CrossRef - Srivastava A.K, Rajeevan M, Kshirsagar S.R. Development of a high resolution daily gridded temperature data set (1969–2005) for the Indian region. Atmospheric Science Letters. 2009 ;10(4):249-254.
CrossRef - Ruane A.C, McDermid S.P. Selection of a representative subset of global climate models that captures the profile of regional changes for integrated climate impacts assessment. Earth Perspectives. 2017;4(1):1-20.
CrossRef - Moss R.H, Edmonds J.A, Hibbard K.A, Manning M.R, Rose S.K, Van Vuuren D.P, Carter T.R, Emori S, Kainuma M, Kram T, Meehl G.A. The next generation of scenarios for climate change research and assessment. Nature. 2010;463(7282):747-756.
CrossRef - Ruane A.C, Winter J.M, McDermid S.P, Hudson N.I. AgMIP climate data and scenarios for integrated assessment. Handbook of climate change and agroecosystems: the agricultural model intercomparison and improvement project. 2015:45-78.
CrossRef - Hudson N.I, Ruane, A.C. Appendix 2. Guide for Running AgMIP Climate Scenario Generation Tools with R in Windows, Version 2.3.2013
- Ruane, A.C., Rosenzweig, C., Mutter, C.Z., et al Guide for Regional Integrated Assessments: Handbook of Methods and Procedures, Version 5.1. 2018
- Pasuquin E, Lafarge T, Tubana B. Transplanting young seedlings in irrigated rice fields: Early and high tiller production enhanced grain yield. Field Crops Research. 2008;105(1-2):141-155.
CrossRef - Singh, A. K., & Craufurd, P. Singh.S et al. New Frontiers in Agricultural Extension Volume II International Maize and Wheat Improvement Center(CIMMYT), 2020; 2, 550
- Rao CA, Raju BM, Rao AV, Rao KV, Samuel J, Ramachandran K, Nagasree K, Kumar RN, Shankar KR. Assessing vulnerability and adaptation of agriculture to climate change in Andhra Pradesh. Indian Journal of Agricultural Economics. 2017;72(3):375-384.
- Arumugam P, Chemura A, Schauberger B, Gornott C. Near real-time biophysical Rice (Oryza sativa L.) yield estimation to support crop insurance implementation in India. Agronomy. 2020; ;10(11):1674.
CrossRef - Peng S, Huang J, Sheehy JE, Laza RC, Visperas RM, Zhong X, Centeno GS, Khush GS, Cassman KG. Rice yields decline with higher night temperature from global warming. Proceedings of the National Academy of Sciences. 2004 Jul 6;101(27):9971-5.
CrossRef - Mohandrass, S.; Kareem, A.A.; Ranganathan, T.B.; Jeyaraman, S. Rice production in India under the current and future climate. In Modeling the Impact of Climate Change on Rice Production in Asia; Mathews, R.B., Kroff, M.J., Bachelet, D., van Laar, H.H., Eds.; CAB International: Wallingford, UK, 1995; pp. 165–181
- Soora NK, Aggarwal PK, Saxena R, Rani S, Jain S, Chauhan N. An assessment of regional vulnerability of rice to climate change in India. Climatic change. 2013;118(3):683-699.
CrossRef - Boonwichai S, Shrestha S, Babel MS, Weesakul S, Datta A. Climate change impacts on irrigation water requirement, crop water productivity and rice yield in the Songkhram River Basin, Thailand. Journal of Cleaner Production. 2018; 198:1157-1164
CrossRef - Krishnan P, Swain D.K, Bhaskar B.C, Nayak S.K, Dash R.N. Impact of elevated CO2 and temperature on rice yield and methods of adaptation as evaluated by crop simulation studies. Agriculture, ecosystems & environment. 2007;122(2):233-242.
CrossRef - Pathak H, Ladha J.K, Aggarwal P.K, et al. Trends of climatic potential and on-farm yields of rice and wheat in the Indo-Gangetic Plains. Field crops research. 2003;80(3):223-234.
CrossRef - Peng S, Khush GS, Cassman KG. Evolution of the new plant ideotype for increased yield potential. InBreaking the Yield Barrier: Proceedings of a Workshop on Rice Yield Potential in Favorable Environments. International Rice Research Institute, Los Banos, Philippines 1994;(pp. 5-20).
- Peng S, Huang J, Sheehy J.E et al. Rice yields decline with higher night temperature from global warming. Proceedings of the National Academy of Sciences. 2004;101(27):9971-9975.
CrossRef - Morita S, Yonemaru JI, Takanashi JI. Grain growth and endosperm cell size under high night temperatures in Rice (Oryza sativa L.). Annals of Botany. 2005;95(4):695-701.
CrossRef - Praveen D. Spatiotemporal analysis of projected impacts of climate change on the major C3 and C4 crop yield under representative concentration pathway 4.5: Insight from the coasts of Tamil Nadu, South India. PloS one. 2017 ;12(7): e0180706. https://doi.org/10.1371/journal.pone.0180706
CrossRef


