Flood Hazard Vulnerability Assessment by using Geo Spatial Techniques: Krishna and Guntur Districts, Andhra Pradesh
B. Prasad 1
*
 , P. Brahmaji Rao1
, P. Ramamohanarao 2
and S. Sarathkumar 3
, P. Brahmaji Rao1
, P. Ramamohanarao 2
and S. Sarathkumar 3
1
Department of Environmental Science,
Acharya Nagarjuna University,
Guntur,
Andhra Pradesh
India
2
Ceinsys tech Ltd., APDRP,
Govt. of Andhra Pradesh,
India
3
Department of Physics,
Rajiv Gandhi University of Knowledge Technologies,
Nuzvid,
Andhra Pradesh
India
http://dx.doi.org/10.12944/CWE.17.2.20
Copy the following to cite this article:
Prasad B, Rao P. B, Ramamohanarao P, Sarathkumar S. Flood Hazard Vulnerability Assessment by using Geo Spatial Techniques: Krishna and Guntur Districts, Andhra Pradesh. Curr World Environ 2022;17(2). DOI:http://dx.doi.org/10.12944/CWE.17.2.20
Copy the following to cite this URL:
Prasad B, Rao P. B, Ramamohanarao P, Sarathkumar S. Flood Hazard Vulnerability Assessment by using Geo Spatial Techniques: Krishna and Guntur Districts, Andhra Pradesh. Curr World Environ 2022;17(2).
Download article (pdf)
Citation Manager
Publish History

Introduction
Flood is one of the most devastating natural calamities that affects people all over the world. In recent years, an increasing number of people around the world have been exposed to severe natural disasters, which have disrupted society functioning and resulted in widespread human, economic, and environmental losses. This trend is expected to continue, particularly in the case of floods.1-2The primary causes of floods are geographically diverse distribution of river floodplains and low-lying coastlines, as well as their long-standing attraction for human settlement. Flooding is still a common cause for human loss and damaging property and these are common phenomenon in the world today, affecting millions of people each year.
The urbanization and climate change have increased the recurrence of floods across the globe with significant changes in characteristics of flood recurrence and interval period.3India’s unique geographic setting, climate, topography, and population all contribute to its high risk and vulnerability to floods and these phenomena cannot be prevented. The flood risk assessment plays a key role in Disaster management.4One of the key functions of Government, particularly disaster management authorities in flood-prone areas is flood management with the goal of ensuring peoples safety and well-being of their environment. For achieving this, Vulnerability reduction and increased resilience are important approaches and one of the most important aspects in this process is identifying vulnerable areas and quantifying vulnerability.5Increasing methodologies for assessment and our understanding of flood risk vulnerability can help decision-makers for reducing damage and losses. Over the past few decades, various flood vulnerability assessment approaches have been developed. The purpose of flood vulnerability assessment is reduction of losses and damages due to floods. It is not possible to completely avoid risk of flooding, but it is possible to lessen the risk by adopting better mitigation measures and management strategies.
The effective vulnerability assessment methodologies and their applications for hazard mitigation and adaptation strategies are required for policy makers.6Flood vulnerability is an important factor in risk management and flood impact analysis, because the vulnerability is the primary cause of disasters, it seems necessary to enhance our understanding of vulnerability.7Vulnerability assessment is a difficult task as it is influenced by various environmental, social, economic, and political issues at the local level.8The physical and social vulnerability assessment studies help us for comprehensive analysis of disaster-prone areas and feasibility of risk reduction strategies.9Several approaches for assessing flood vulnerability have been developed by researchers, however threats due to floods still prevalent inspite of increased technology and awareness about the vulnerability.10
Multi-criteria decision analysis (MCDA) through Geographic Information System (GIS) for assessing and integrating geographical data and to support in decision making.11Flood vulnerability and flood inundation maps were key factors for flood mitigation and risk management. These maps give us precise geospatial information about flood extent which can be used as planning tools to evaluate landscape vulnerability and flood risk.
The necessity for a review of various flood risk management approaches in order to reduce large-scale losses to life and property has been addressed in the literature. Satellite helps in providing spatial and temporal coverage of flood-inundated areas, making them more useful for monitoring of floods. The remote sensing and GIS methodologies provides valuable information for flood hazard assessment.
This study aims to examine the usefulness of geospatial approaches and suggesting an appropriate methodology for flood inundation mapping as well as landscape vulnerability and zonation. Local governments shall be utilized these maps as a guide in flood management and for taking mitigation measures for reduce the risk of floods and their consequences.
Study area
The Districts of Krishna and Guntur of Andhra Pradesh, India located between Latitude 15042’5” to 1709’30” Longitude 79011’36” to 81033’30” with a population of 89,82,542(Krishna -45,17,398, Guntur-44,65,144). Present study area depicts in Figure 1. The total administrative area of Krishna District is 8,727 sq.km with 970 Gram Panchayats covering 53 Mandals. The Guntur District having 1069 Gram a panchayats in 57 mandals with 12,805 sq.km of administrative area (Figure -1)
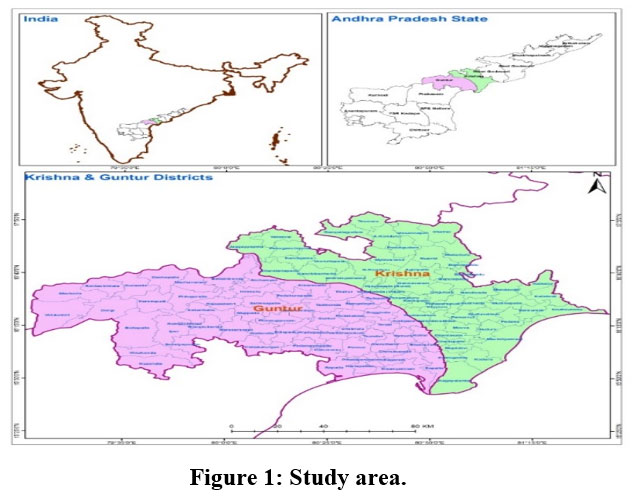 | Figure 1: Study area.
|
Krishna floods 2020
Impact of Floods
The massive floods in Krishna River wreaked havoc in the district of Guntur and Krishna of Andhra Pradesh in September & October,2020 due to Low pressure/Deep depression formed in Bay of Bengal, under its influence heavy rain fall received by the State and upper catchment area of Krishna basin. The floods in the study area occurred in three phases between September to October of 2020.Resulting the inflow of water levels rapidly increased up to 7.79 Lakh cusecs at Prakasam barrage and the water has been released to downstream, on account of this massive flooding in the surrounding habitations of Krishna River has inundated and distressed the normal life. Flood inflow and out flow view from top of the river at prakasam barrage was shown in Figure 2 dated 17th October, 2020.
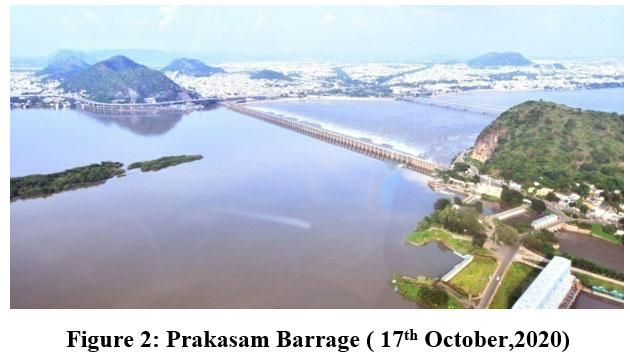 | Figure 2: Prakasam Barrage ( Dt.17th October,2020).
|
Data base and Methodology
Flood vulnerability assessment and mapping requires a vast amount of data related to study area in order to make decisions and interpretations. The data sets obtained from National Remote Sensing Center, APSAC and free satellite data downloaded from the USGS website. The Population and Population density details were used from Census of India 2011 to assess the extent of vulnerability. Disaster loss data base were obtained from APSDMA. For flood hazard zoning, the Satellite data sets of IRS P6 LISS-III, Radarsat SAR, CARTOSAT-2A PAN, and SRTM-DEM were utilized.12
All the flood events (2000-2020) flood layers were extracted from multi-temporal satellite data. The flood layers pertaining to the same year are combined into one inundation layer, representing the maximum inundated area in one year. For the past 21 years, all these flood layers have been combined into a flood hazard layer that represents the observed flooded area with varying frequencies by using ArcGIS 10.8 environment. As a part of the study to identify the ground truthing of vulnerable areas due to floods in the year 2020 has been taken for case study to identify the homogeneous in the flood zonation maps.13
Results and Discussion
Damage assessment
On account of incessant rains and floods in Krishna River which adversely affected the bio resources, livelihood and capital wealth (Infrastructure). The floods incurred immense losses to the infrastructure, as many roads, bridges and thousands of houses were damaged /inundated. Large quantities of agricultural/Horticulture produce were lost putting the livelihood of farmers at risk. There is huge disruption to public life as several connecting roads were damaged.
Table:1 Losses and Damage assessment of population, Houses, Crop land and infrastructure .
District | Area (sq.km) | Population | Density (Persons per sq,km) | Inundated area (sq.km) | No of villages affected | Affected population | No of houses damaged/ inundated | No of Ha, crop damaged | No of Kms of Roads damaged/ inundated |
Krishna | 8,727 | 4517398 | 518 | 175.24 | 189 | 70194 | 31930 | 29685.17 | 570.83 |
Guntur | 12,805 | 4,465,144 | 430 | 157.84 | 78 | 32511 | 19030 | 9776.09 | 416.35 |
Total | 21532 | 89,82,542 | 948 | 339.08 | 247 | 102705 | 64441 | 39461.26 | 987.18 |
(Source: Memorandum on Heavy rains/floods during,2020, GoAP)
Inundated area of crop land and habitations due to flood displayed as Figure 3 and Flood inundated area during 2020 Krishna floods was shown in Figure 4. It’s around 1.57% of Krishna and Guntur Districts i.e., 339.08 sq.km were inundated and has a direct impact on 1.14 percent of the population. 43 human lives, 398 livestock and 18,265 poultry birds were lost due to these floods. Around 987.18 Kms of roads and CD works were damaged and also thousands of scours were formed. Floods have caused exorbitant losses to the agriculture and Horticulture sector to the extent of 39461.26 Ha. A total of 64, 441 houses were damaged fully/partially and inundated. The irrigation works, drinking water works and Electrical installations were also severely affected the flood affected areas of both the districts. The impact of floods on villages/Habitations, crop lands, road network etc., is shown in table -1
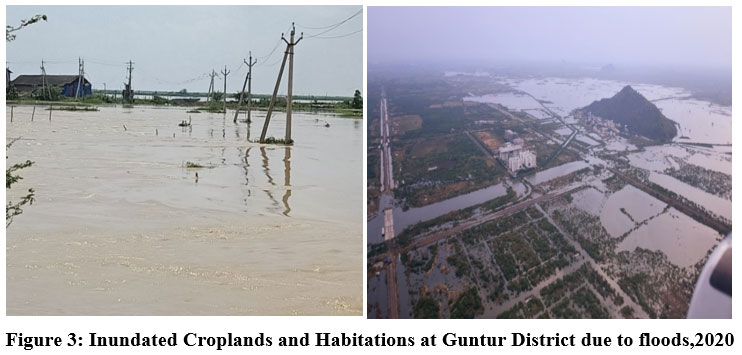 | Figure 3: Inundated Croplands and Habitations at Guntur District due to floods, 2020.
|
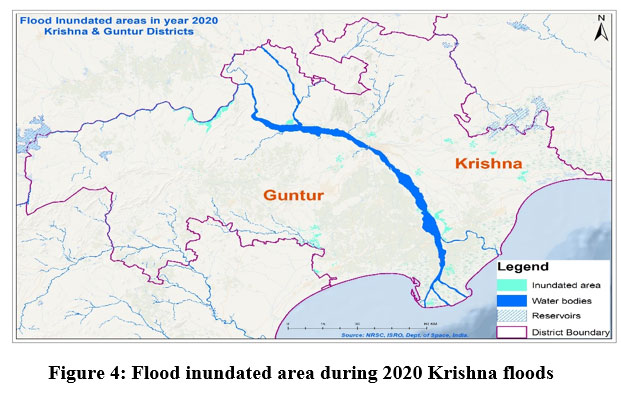 | Figure 4: Flood inundated area during 2020 Krishna floods.
|
Mapping of the Flood Prone area
The Flood Hazard Zonation (FHZ) map (Figure-5) is generated after getting flood hazard layers and integrated to GIS environment using a multi-criteria overlay analysis approach. It is an essential part for minimizing the risk due to floods. These maps give precise geospatial information on flood inundation and can be used as planning tools to analyze flood hazards and landscape susceptibility. This can be act as a base for prediction, early warning, and evacuation of the community and for relief works and also in turn can have a better control over the post flood works like mitigation measures.14The flood prone areas has been classified in to low, moderate and high for preparing of flood hazard zonation map based on frequency of floods, their spatial extent and number of flooding events occurred in that area during last 21 years and the number of villages/habitations category wise statistics are tabulated in Table -2 & 3
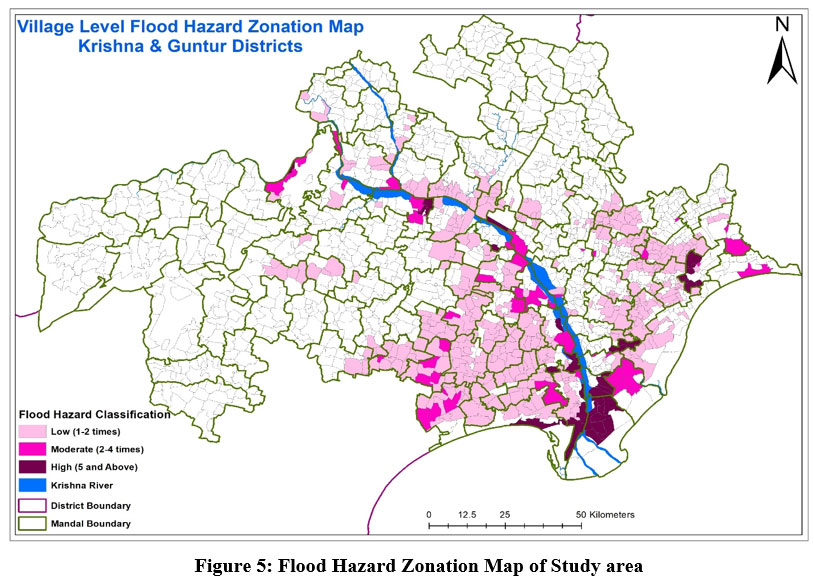 | Figure 5: Flood Hazard Zonation Map of Study area.
|
About 4707.84 Sq.km are is prone to floods, out of total geographical study area i.e., 21532 Sq.km. Around 21.86 % of geographical area is prone to floods. Out of that ~ 16% of the total geographical area falls under low category, ~ 3.08 % of the area is falls under moderate and ~ 1.91% geographical area falls under high flood hazard zone category. As many as 508 villages are vulnerable to floods in both the districts. 62013 households with a population of 2074720 are at vulnerable for cyclone induced floods and riverine floods
Table 2: Flood Vulnerability Statistics.
Item | Area (Sq. Km) | Villages/ towns | Households | Population |
Total Study area | 21532 | 1711 | 2539902 | 9405211 |
Vulnerability | 4707.84 | 508 | 62013 | 2074720 |
Percentage (%) | 21.86 | 29.69 | 2.44 | 22.05 |
Table 3: Vulnerability Zone/Category Wise Distribution.
Category | Area (Sq. Km) | No of Villages likely to be Affected
| N of Households Likely to be Affected
| No of Population Likely to be Affected |
Low | 3630 | 414 | 494266 | 1674715 |
Moderate | 664.46 | 58 | 71255 | 245812 |
High | 413.38 | 35 | 44692 | 154193 |
Total | 4707.84 | 508 | 610213 | 2074720 |
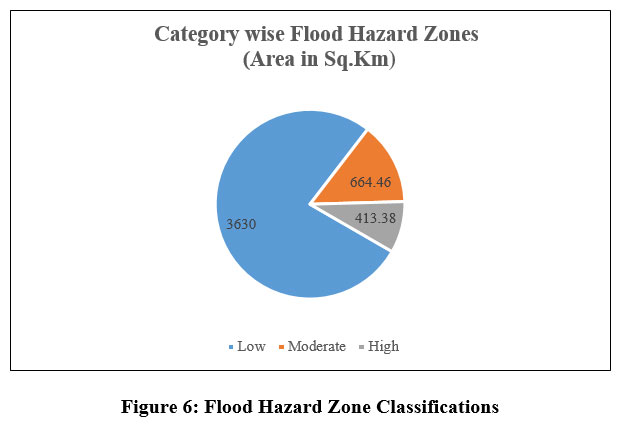 | Figure 6: Flood Hazard Zone Classifications.
|
Vulnerability Zone Wise LULC
The Land use and landcover are also significant considerations in determining the probability of floods occurring. The land use/ Land cover classification of the flood inundation was extracted from the IRS P6 LISS-III satellite image through the use of image interpretation, then the flood layers has been superimposed on the Land use and Land cover (Figure -7). The Statistics of various flood hazard zone wise LULC classification is listed in table-4
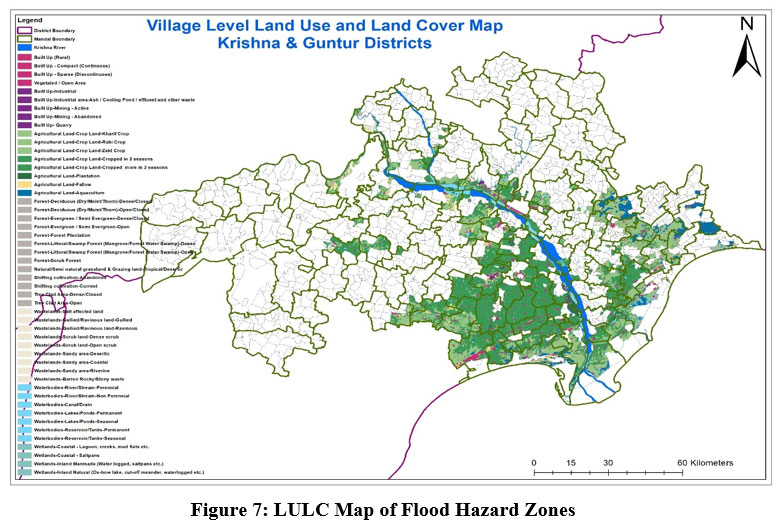 | Figure 7: LULC Map of Flood Hazard Zones
|
One of the major concerns in flood hazard mapping is the analysis of an area land use and land cover because this is one feature that not only reflects the area current use and nature of use, but also the significance of that use with respect to the vulnerability aspects. The total flood prone area is 4707.84 Sq. kms. Figure 7 depicts LULC map of flood hazard zones. As per the LULC classification (Table- 4) most of the flood prone area is covered by agriculture and plantation, occupied the area of 4069.01sq. Kms.15 An area of 262.46 sk.km is covered built-up area and 28.93 sq.km forest and forest plantation. The area under water bodies and wet lands is about 347.44 sk.km.
Thus, the comprehensive land use study after attributing with the flood hazard zonation as mentioned above, which are more useful for making formulation of Disaster Management Plans, Mitigation Plansand policies for Disaster risk resilience.
Table 4: Land Use/ Land Cover Statistics.
Flood Hazard Zone | Class | Area in Sq.Km |
Low | Agriculture | 3201.98 |
Built up | 210.59 | |
Forest | 15.54 | |
Wastelands | 30.24 | |
Wetlands | 27.40 | |
Water Bodies | 145.85 | |
Moderate | Agriculture | 537.52 |
Built up | 27.69 | |
Forest | 9.93 | |
Wastelands | 11.59 | |
Wetlands/Water bodies | 68.31 | |
Water Bodies | 9.59 | |
High | Agriculture | 329.51 |
Built up | 24.18 | |
Forest | 3.46 | |
Wastelands | 7.00 | |
Wetlands/Water bodies | 25.36 | |
Water bodies | 25.36 | |
Total | 4707.84 | |
Mitigation strategies
To minimize the severity of floods and for effective flood management the following mitigation measures to be adopted.
Flood Mitigation Structural Measures
The important structural measures like flood walls, Channel improvement, diversion of flood water, construction of embankments, flood levees and dredging of stream and rivers on a regular basis to avoid floods and to reduce the impact of siltation. The local government can take up projects to improvise local storm water drain and traditional flood prevention systems, plantation and afforestation throughout the river catchment area to prevent soil erosion with special emphasis with more soil binding capacity such as bamboos and bushy plants etc.
Flood Mitigation Non-Structural Measures
The Non-structural measures like flood plain management plans, flood zonation, improving forecasting and warning systems, awareness generation, developing flood insurance mechanism to the community etc. which can reduce the adverse affects of flood.
Recommendations
Disaster Management Act, 2005 gives the legal authority to State government to frame policies and make disaster management plans including mitigation plans with the help of the National Disaster Management Authority (NDMA). The District Disaster Management Authority (DDMA) has to prepare and update their District Disaster Management Plans annually. The Disaster Management Authority assesses disaster risk and adopt suitable structural and non-structural mitigation measures at local level for minimizing the impacts of floods and other natural disasters by using Remote sensing and GIS.16
Conclusion
Flood Hazard Zonation map is generated through flood hazard layers from 2000-2020 and integrated to GIS environment using a multi-criteria overlay analysis approach. Flood hazard zonation map shows that the areas along Krishna River and low laying area of Krishna and Guntur districts were inundated in most of the flood events. The study reveals that414 villages have been identified as low hazard category, 58 villages fall in Moderate and 35 villages are in High flood hazard category. It is observed that 21.86% of the total area studied comes under vulnerability phenomenon and also 22.05% of the total population belongs to study area is prone to floods. The study also reveals that most of the flood prone area is covered by agriculture and plantation covered to an extent of 4069.01 Sq.km. Besides the agriculture and plantation the buildup area of about 262.46 Sq.km is prone to floods. The study has been taken with remote sensing and GIS techniques which helped in arriving the significant results for arriving at flood hazard zone maps in identifying the vulnerability of assessment due to floods in Krishna and Guntur District areas of Andhra Pradesh.
Acknowledgement
Authors are very much thankful to Department of Environmental Sciences, Acharya Nagarjuna University, India for their cooperation in providing essential research facilities.
Conflict of interest
On behalf of all authors, the corresponding author states that there is no conflict of interest.
Funding Sources
There is no funding source.
References
- Birkmann J (2007) Risk and vulnerability indicators at different scales: Applicability, usefulness and policy implications. Environ.Hazards 7:20–31
CrossRef - C. Faiz Ahmed and Natraj Kranthi, Flood vulnerability Assessment using geospatial techniques, Chennnai, Iindia. Indian journal of Science and technology, Vol.11(6) 974-6846. DOI:10.17485/ijst/Feb,2018
CrossRef - Elco E Koks et al., 2014 combining hazard, exposure and social vulnerability to provide lessons for flood risk management. Article in Environmental Science and policy, November 2014. 47:42-52
CrossRef - Indiawris.gov.in, River basin wise rainfall and other relevant information, https://indiawris.gov.in
- Jailan et al 2009, Risk assessment and validation of flood disaster based on fuzzy mathematics, Progress in Natural Science, 19 (2009) 1419–1425
CrossRef - Jixi Gao JE (2007) An assessment of flood hazard vulnerability in the Dongting Lake Region of China. Lakes & Reservoirs Research and Management 12:27–34
CrossRef - Khan S (2012) Vulnerability assessments and their planning implications: a case study of the Hutt Valley, New Zealand. Nat Hazards 64:1587–1607
CrossRef - Klein R (2004) Developing a method for addressing vulnerability to climate change and climate. An academic perspective, Expert Meeting, Bonn
- Lehner B, Doll P, Alcamo J, Henrichs T, Kaspar F. Estimating the impact of global change on flood and drought risks in Europe A continental integrated analysis. Climatic Change. 2006 Apr; 75(3):273–99
CrossRef - Malczewski J (2006) Ordered weighted averaging with fuzzy quantifiers: GISbased multi-criteria evaluation for land-use suitability analysis. Int J Appl Earth Obs Geoinf 8(4):270–277. https://doi.org/10.1016/j.jag.2006.01.003
CrossRef - Rasoul Khosravi et al., 2016, Using geographic information system (GIS) and remote sensing (RS) in zoning nitrate concentration in the groundwater of Birjand, Iran, J Adv Environ Health Res 2016; 4(3): 129-34
- Rao UR. 1994. Floods and droughts. Paper presented at: IAF- COSPAR symposium on space applications for disaster prevention, warning, mitigation and relief. Meeting of the Scientific & Technical Committee, UN Committee on Peaceful Uses of Outer Space; Vienna; February 21–22.
- S Deepak, gopika rajan and P G Jairaj, 2020 Geospatial approach for assessment of vulnerability to flood in local self-governments, Geo Environmental Disasters, (2020) 7:35 DOI:10.1186/s40677-020-00172-w
CrossRef - Takemoto S (2011) Moving towards climate smarts flood management in Bangkok and Tokyo-Master thesis. Massachusetts institute of technology
- UN-ISDR (2009) Terminology of disaster risk reduction. United Nations International Strategy for Disaster Reduction, Geneva https://www.undrr.org/terminology
- World Conference on Natural Disaster Reduction, Yokohama, Japan 23-27 May 1994 , Distr. General, A/CONF.172/9 27 September 1994,


