Assessment of Heavy Metal Pollution Associated with Surface Sediment Contamination in the Bhima River, Karnataka, India
Rajshekar Chinmalli
*
 and Katepaga Vijaykumar
1
Department of Post Graduate Studies and research in Zoology,
Gulbarga University,
Kalaburagi,
Karnataka
India
http://dx.doi.org/10.12944/CWE.17.2.17
Copy the following to cite this article:
Chinmalli R, Vijaykumar K. Assessment of Heavy Metal Pollution Associated with Surface Sediment Contamination in the Bhima River, Karnataka, India. Curr World Environ 2022;17(2). DOI:http://dx.doi.org/10.12944/CWE.17.2.17
Copy the following to cite this URL:
Chinmalli R, Vijaykumar K. Assessment of Heavy Metal Pollution Associated with Surface Sediment Contamination in the Bhima River, Karnataka, India. Curr World Environ 2022;17(2).
Download article (pdf)
Citation Manager
Publish History

Introduction
The sediment consists of particles that develop due to weathering of rocks and were moved by water or wind. Soil erosion, plant, and animal deterioration can all contribute to it. Sediments are fine sand, mud, and several soil particles, that segregate at base of water body.1,2 In the aquatic ecosystem, sediments are equivalent to the soil in the terrestrial ecosystem. Sediments supply nutrients to flora and fauna, which are essential for the existence of aquatic life.3 Ecological nutrition cycles, pollutants, and water quality dynamics rely heavily on sediments.4
Sediments constitute a significant component of the riverine body, which serve as sinks as well as a source of potentially toxic elements (PTEs).5-7 As a consequence of mining, industrial activity, and construction processes, rivers have been badly polluted by potentially toxic elements (PTEs) like zinc(Zn), copper(Cu), cadmium(Cd), & lead(Pb),.8 Chemically, metals with an atomic mass larger than 20 amu and a relative density exceeding 5 are classified as heavy metals. In biology, the phrase "heavy" states to a category of metals and metalloids that are toxic to flora and fauna at very deficient levels.9 The term "heavy metal" has been often used in the science for a long time and even more so in environmental science, particularly in studies on the impacts of pollution. Pourret and Hursthouse coined the phrase "Potentially Toxic Element(s) PTEs" as the use of the term seemed to be growing.10
Solid rock weathering is the most common natural source of PTEs addition,11 rapid urbanization, industrialization, vehicle emissions, mining, heavy metal-containing paints, agrochemicals and pesticides in agricultural fields, and raw sewage are some of the sources of PTEs.6, 12-14 PTEs entering the aquatic ecosystems may trigger geo-accumulation, bioaccumulation, biomagnification, as well as environmental conditions into more troubling aspects.1 Household detergents, which are known to contain little quantities of iron (Fe), manganese (Mn), zinc (Zn), and other metals, are found in sewage.15 Environmental contamination with PTEs has significantly risen. It has also gotten a lot of attention in emerging nations because of the widespread hazards to public health.16 Potentially toxic elements (PTEs) can be detrimental to both aquatic and terrestrial life, including humans.17 The negative effects of sudden exposure to hazardous metals on human health may not cause the same defects as long-term exposure to hazardous metals. This only becomes apparent after several years of exposure.18 Sediments are the final destination for many pollutants in the aquatic environment. As a result, gathering sediment data is a crucial one in remedial inquiry.19 In a growing nation like India, where the most developmental initiatives still rely on rivers for both washing and dumping, it is critical to thoroughly investigate the state of water bodies such as rivers in connection to diverse human activities.20 India has a plethora of surface water layers. However, due to increased population expansion and economic development, it suffers from severe metal pollution concerns in both water and sediment.21 Many workers like Duncae et al., (2018),22 Gangapenta et al., (2018),23 Siddhqui and Pandey (2019)24, and Shirani et al., (2020)25 have reported on PTEs concentrations in river sediment from various sites across the world and reported the concentrations of PTEs in sediment and its pollution status by using multiple indices.
In Karnataka's northern state, the Bhima River water is one of the most essential for sugarcane cultivation and most of the residing area is utilized as agricultural land, apart from this river is used for sewage disposal. Given the massive usage of river systems for irrigation and drinking, and hence a lack of effective sediment management, rising human activities have drastically deteriorated sediment quality. The agricultural run-off dominates a part of the Bhima River in Karnataka, followed by household garbage. Sand mining, as well as ritual practices, have a significant impact on biodiversity. As an alternative, the dispersal and accumulation of PTEs into sediment are also inclined by the texture, mineralogical content, and physical-chemical carriage of sediment. As a result, the geochemical characteristics of sediments determine the accumulation of PTEs, and large differences in their concentration are correlated with ecosystems.26
No comprehensive research on surface sediment pollution has been conducted in the Bhima River of the Kalaburagi region. Current research examines the PTEs concentrations in sediment to analyze the existing pollution condition of the Bhima River employing Igeo, enrichment ratio, & pollution load index. Furthermore, multivariate statistical process like principal component analysis (PCA) and cluster analysis (CA) had been utilised for identifying likely sources.
Materials and methods
Study area
Bhima is longest tributary of the Krishna River, which runs through Kalaburagi, Afzalpur, and Jevargi Taluka in the Kalaburagi District (76°-04" to 77°-42" Longitude and 16°-12" to 17°-46" Latitude) regarding water inflows and river basin area, it is the fourth largest river in India, rising in the Western Ghats of Maharashtra and flowing south to join the Krishna (Fig.1)
 | Figure 1: Map of Kalaburagi district portraying eight different locations of sample sites.
|
Sample collection
Grab sampler were utilized to collect samples along the river's length from eight pre-determined sites. The sampling points were selected to give good coverage of the background and anthropogenic input values across a study region. A 500-gm sediment sample was collected from each site. Before collecting the following sample, the grab sampler was cleaned, dried, and precautions were taken to avoid contamination. The samples were carried to the laboratory in polythene plastic bags at 4°C to preserve the parameter settings, and the same temperature was upheld until the samples were digested.
Sample digestion
The sediment samples were air-dried for 48 hours before being pulverized using a ceramic mortar and pestle. Tiny powdered materials then filtered using 2mm mesh sieve. A dry weighed 1 gm sediment sample was added into 100ml volumetric flask having 20ml of deionized water & an equal volume of nitric and hydrochloric acid and heated on a hot plate. Allow the mixture to remain until the sample has dissolved, then dilute with deionized water to volume. A Whatman No.42 filter paper was used to filter the solution into a 100 ml standard flask.27 PTEs including Zn, Mn, Cu, Fe, Cd, and Pb were analyzed utilising an Atomic Absorption Spectrophotometer (AAS).It has a multi-element cathode lamp that operates into wavelength spectrum of 180-900nm to detect trace elements. This instrument is fitted by Stockdale double beam optics to give a maximal signal noise ratio while signal measurement. It has a detection limit of 0.150 to 3.0 Abs (Absorbance). The standard stock solution was used to have a calibration curve for analyzing PTEs. The solutions were diluted and reanalyzed, when the measurements of samples exceeded the calibration curve range. Each sample was analyzed twice and average values were taken during each test. This instrument has a SOLAAR software package which has integrated auto quality control (QC) and quality assurance (QA) standards with checking, testing, and reanalyzing option. Each PTE's recovery rate using linear calibration curves was over 90% (R2 = 0.995) (Operators Manual AA spectrometers iCE 3000 series).28
Metal contamination assessment
Various approaches are used to assess the status of the environment and the degree of PTEs contamination in the natural environment. Metal enrichment compared to baseline levels can be used to calculate the anthropogenic contribution of certain PTEs deposited in sediments. Several methods have been presented for assessing metal loading in surface sediment.23
Geo-accumulation index (Igeo)
Muller (1979)29 implemented a geo accumulation index (Igeo) for assessing degree of metal accumulation in sediments. Igeo is calculated using the relationships shown below, and it has been employed by various researchers in their studies.24-25

In this case, Cn represents the concentration of studied metal, while Bn represents the background metal concentration.30 The multiplier of 1.5 is included in the equation to adjust for any lithogenic action variance in the background data. According to Muller's classification, this index is divided into 7 classes, as shown in Table 1.
Table 1: Classification levels of Geo-accumulation index (Igeo) values.
Igeo value | Igeo Class | Polluted level |
? 0 | 0 | Practically unpolluted |
?0 - ?1 | 1 | Slightly polluted |
?1 - ?2 | 2 | Moderately polluted |
?2 - ?3 | 3 | Strong polluted |
?3 - ?4 | 4 | Very strong polluted |
?4 - ?5 | 5 | Extremely polluted |
Enrichment Ratio (ER)
Simex and Helz (1981)31 formulated enrichment ratio (ER) analysis to measure anthropogenic and geogenic influences. Fe was chosen as a conservative metal to evaluate the enrichment ratio24 which is statistically stated as

Depending upon enrichment ratio, 5 contamination categories are listed in Table 232
Table 2: Enrichment ratio (ER) values and polluted level categories.
ER value | Polluted level |
< 2 | Minimum enrichment |
2 to 5 | Medium enrichment |
5 to 20 | High enrichment |
20 to 40 | Very high enrichment |
>40 | Extreme higher enrichment |
Contamination factor (CF)
To evaluate contamination factor (CF), divide the obtained value of every metal into residue by its background value.

CF values are deliberated indicated by Hakanson (1980),33 with CF<1 indicating lower contamination, 1<CF<3 indicating medium contamination, 3 < CF < 5 indicating significant contamination, and CF > 5 indicating extremely higher pollution.34
Pollution load index (PLI)
Tomilson et al., (1980)35 proposed PLI, which is used to estimate the total toxicity and pollution status of the samples.

here, n denotes total number of metals (six into current research) & CF indicates contamination factor. Pollution load index (PLI) assesses total toxicity. Value 1 denotes baseline values, and above 1 shows increasing deterioration.24
Contamination factor could be estimated by as

Multivariate Analysis
Principal component analysis (PCA) is multivariate technique for data decrement and pattern recognition in application datasets. It identifies the source, which clarifies differences in sediment quality. This method has an edge over others since it provides better detection of pollutants in river sediment. The multivariate cluster analysis (CA) method is another method, which is well-known in hydrology, and is used to find relationships and common origins among PTEs. Additionally, CA is widely used to pinpoint different geochemical clusters while looking for samples that contain comparable amounts of PTEs. According to Ward's technique, the increase in squared error indicates how similar the two clusters are to one another, and outcomes are displayed as dendrogram form.36
Result and discussion
Typical metal concentrations into deposit trials are observed as of following sequence Fe>Mn>Cu>Zn>Pb>Cd. At all of the stations, Fe had the highest levels while Cd had the lowest. The obtained values of all PTEs were principally compared with their allowable limits for WASV to pinpoint the primary pollutant in the Bhima River. Table 3 illustrates the average metal value in sediments at studied sites. Average concentration of PTEs like Zn, Fe, and Pb to current research ranging from 37.42 to 67.21mg/Kg, 7215.96 to 8278.08 mg/kg, 0.6 to 16.93 mg/kg, respectively. According to WASV standards, all of the tested samples for these above-stated PTEs were within the limit. Average Cu concentrations in the sediment sample ranged from 32.53 to 77.21mg/kg, Cu concentration data suggest that six of the eight sampling locations were considerably higher above the desired limit of 45 mg/Kg. Concentration levels were especially high at sampling stations like S3, S4, S5, S6, S7, and S8 compared to WASV standards, which may be attributed to the use of agrochemical like fertilizers, pesticides, wood additives, electroplating and copper based antifouling coating are the major anthropogenic sources of Cu.37-39 Benthic organisms may be affected by the high copper concentration. In addition to stating that PTEs concentrations were significantly correlated with sediment values, Jeong observed that the concentration of Cu was 2.6–17.7 times higher in oysters.40Mn concentrations ranged from 531.49 to 949.30 mg/kg in the sediment samples. Compared to WASV standards, the highest concentrations were found at stations such as S3, S4, S5, and S6, Mn enrichment in the river system which is probably because of anthropogenic interferences and fertilizer runoff.39 Cd concentration in the sediment samples ranging from 0.2 to 2.99 mg/kg. Cd concentration data suggest that seven sample locations were higher above the desired limit of 0.3 mg/kg suggested by WASV. According to the findings of this study, approximately half of the sediment samples tested were contaminated with Cu and Mn, and the majority were contaminated with Cd, resulting from the excessive usage of lead-cadmium batteries, sewage sludge, and vehicle emission.41 The high concentrations of PTEs could cause a variety of health issues for the residents.42
Table 3: Average Concentrations of the potentially toxic element (PTEs) (mg/kg) for the studied samples.
Metals
Sites | Zn | Cu | Mn | Fe | Cd | Pb |
S1 | 51.53 | 44.98 | 628.17 | 7451.27 | 2.13 | 16.33 |
S2 | 37.52 | 32.53 | 531.49 | 7215.96 | 0.2 | 0.6 |
S3 | 64.17 | 77.21 | 877.49 | 7857.41 | 1.69 | 2.99 |
S4 | 67.21 | 62.41 | 853.27 | 8224.11 | 2.99 | 13.31 |
S5 | 58.43 | 63.77 | 949.30 | 8278.08 | 2.14 | 9.98 |
S6 | 49.58 | 56.69 | 882.96 | 8250.26 | 2.2 | 16.13 |
S7 | 43.34 | 49.15 | 769.37 | 7777.09 | 2.02 | 15.6 |
S8 | 48.80 | 53.39 | 805.31 | 7970.82 | 2.0 | 16.93 |
Average | 52.57 | 55.01 | 787.17 | 7878.12 | 1.92 | 11.48 |
WASV | 95 | 45 | 850 | 47200 | 0.3 | 20 |
S1-Gangapur, S2-Sagnur, S3-Chinamalla, S4-Nelogi, S5-Harwal, S6-Rasangi, S7-Saradgi-B, S8-Jevargi, and WASV-World average shales value23
Geo accumulation index (Igeo)
Igeo index revealed that most of metals investigated exhibit index values of less than zero, but Cd has an Igeo range between -1.17 and 2.73, and thus belongs to classes 0 to 3 (Table 4). Only in the S3 site of the eight locations in the sediment was minimally polluted by Cu. Cd, on the other hand, is significantly contaminated at all locations except S2. This implies that the majority of the metals have not affected the river sediment, and cadmium is regarded as one of the principal sediment pollutants at the studied sampling location.
Table 4: Index of geo accumulation (Igeo) values for studied samples.
Metals Sites |
| Zn | Cu | Mn | Fe | Cd | Pb |
S1 | Igeo Igeoclass | -1.46 0 | -0.58 0 | -1.02 0 | -3.24 0 | 2.242 3 | -0.87 0 |
S2 | Igeo Igeoclass | -1.92 0 | -1.05 0 | -1.26 0 | -3.29 0 | -1.17 0 | -5.64 0 |
S3 | Igeo Igeoclass | -1.15 0 | 0.19 1 | -0.53 0 | -3.17 0 | 1.909 2 | -3.32 0 |
S4 | Igeo Igeoclass | -1.08 0 | -0.11 0 | -0.57 0 | -3.10 0 | 2.73 3 | -1.67 0 |
S5 | Igeo Igeoclass | -1.28 0 | -0.08 0 | -0.42 0 | -3.09 0 | 2.2 3 | -1.58 0 |
S6 | Igeo Igeoclass | -1.52 0 | -0.25 0 | -0.53 0 | -3.10 0 | 2.29 3 | -0.89 0 |
S7 | Igeo Igeoclass | -1.71 0 | -0.45 0 | -0.72 0 | -3.18 0 | 2.16 3 | -0.94 0 |
S8 | Igeo Igeoclass | -1.54 0 | -0.33 0 | -0.66 0 | -3.15 0 | 2.15 3 | -0.82 0 |
S1-Gangapur, S2-Sagnur, S3-Chinamalla, S4-Nelogi, S5-Harwal, S6-Rasangi, S7-Saradgi-B, and S8-Jevargi
Enrichment ratio (ER)
The ER values reveal that six metal elements are enriched in three different categories in the sediments of the Bhima River. Zn has the lowest ER value (2.66) of any metal, indicating moderately enrichment. Pb (3.33), Mn (5.41), and Cu (6.51) had a significant enrichment. Cd, on the other hand, has the highest ER value 38.20 of any metal and is very high enriched.Among the study sites, S4, S5, and S6 exhibited the highest enrichment in terms of PTEs (Table 5).
Table 5: Enrichment ratio (ER) of the sediments of the studied samples.
Metals Sites | Zn | Cu | Mn | Cd | Pb |
S1 | 3.02 | 4.90 | 4.17 | 42.35 | 4.87 |
S2 | 1.72 | 3.25 | 3.73 | 3.97 | 0.17 |
S3 | 3.82 | 10.23 | 6.15 | 33.60 | 0.89 |
S4 | 3.59 | 7.38 | 5.98 | 59.46 | 3.97 |
S5 | 3.04 | 8.27 | 6.66 | 42.55 | 2.97 |
S6 | 2.27 | 7.37 | 6.19 | 43.74 | 4.81 |
S7 | 1.67 | 5.45 | 5.25 | 40.17 | 4.35 |
S8 | 2.22 | 5.30 | 5.18 | 39.77 | 4.65 |
Mean ER | 2.66 | 6.51 | 5.41 | 38.20 | 3.33 |
S1-Gangapur, S2-Sagnur, S3-Chinamalla, S4-Nelogi, S5-Harwal, S6-Rasangi, S7-Saradgi-B, and S8-Jevargi
Contamination factor (CF) and Pollution load index (PLI)
The contamination factors (CFs) & pollution load index (PLI) data are represented in Table 6. Fe recorded the lowest CF value at all the sampling sites, whereas Cd was reported being highest at seven of the sampling stations. The pollution load index fluctuates from 0.28-1.01. Lower PLI levels indicate that there is no significant anthropogenic input. Greater PLI value in S4 is linked to human activity and bridge construction.
Table 6: Contamination factor (CF) and pollution load index (PLI) of potentially toxic elements (PTEs).
Metals Sites | CF1 | CF2 | CF3 | CF4 | CF5 | CF6 | CF7 | CF8 |
Zn | 0.54 | 0.39 | 0.67 | 0.70 | 0.61 | 0.52 | 0.45 | 0.51 |
Cu | 0.99 | 0.72 | 1.71 | 1.38 | 1.41 | 1.25 | 1.09 | 1.18 |
Mn | 0.73 | 0.62 | 1.03 | 1.00 | 1.11 | 1.03 | 0.90 | 0.94 |
Fe | 0.15 | 0.15 | 0.16 | 0.17 | 0.17 | 0.17 | 0.16 | 0.16 |
Cd | 7.1 | 0.66 | 5.63 | 9.96 | 7.13 | 7.36 | 6.73 | 6.66 |
Pb | 0.81 | 0.03 | 0.14 | 0.66 | 0.49 | 0.80 | 0.73 | 0.78 |
PLI | 0.83 | 0.28 | 0.72 | 1.01 | 0.90 | 0.93 | 0.83 | 0.88 |
Zinc (Zn), Copper (Cu), Manganese (Mn), Iron (Fe), Cadmium (Cd), and lead (Pb).
Principal component analysis
PCA is used to recognize sources of pollutants in lakes and rivers, which can provide helpful information for environmental protection and sustainable development.43 PCA produced two components having Eigenvalues greater than one that described 89.99% of data set's total variance (Fig.2). With substantial positive loadings of Zn, Cu, Mn, Fe, and Cd the first component accounted for 67.60% of the variation. The presence of metals in this component suggests an agricultural runoff, sewage sludge, and bridge construction. Component 2 accounted for 22.38% variation by explaining vehicle emission and battery sources for Pb.
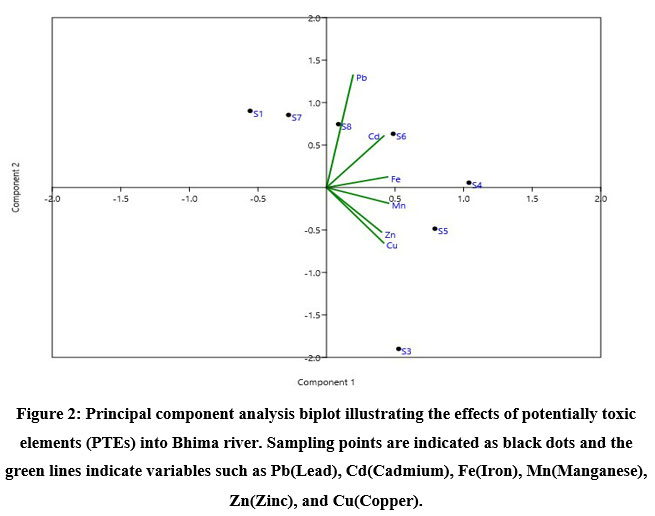 | Figure.2: Principal component analysis biplot illustrating the effects of potentially toxic elements (PTEs) into Bhima river. Sampling points are indicated as black dots and the green lines indicate variables such as Pb(Lead), Cd(Cadmium), Fe(Iron), Mn(Manganese), Zn(Zinc), and Cu(Copper).
|
Cluster analysis
The fundamental goal of cluster analysis is determining best method for grouping objects with similar characteristics into clusters. The dendrogram depicts two primary groupings of sample sites from the research region. The eight sediment sample locations are separated into two groups by eight sampling points. Cluster one comprises three sample points: S1, S2, and S8, all of which have been contaminated by human activities. Cluster two consists of five polluted sampling stations S3, S4, S5, S6, and S7 caused by agricultural runoff, vehicle emission, lead batteries, and sewage sludge (Fig.3).
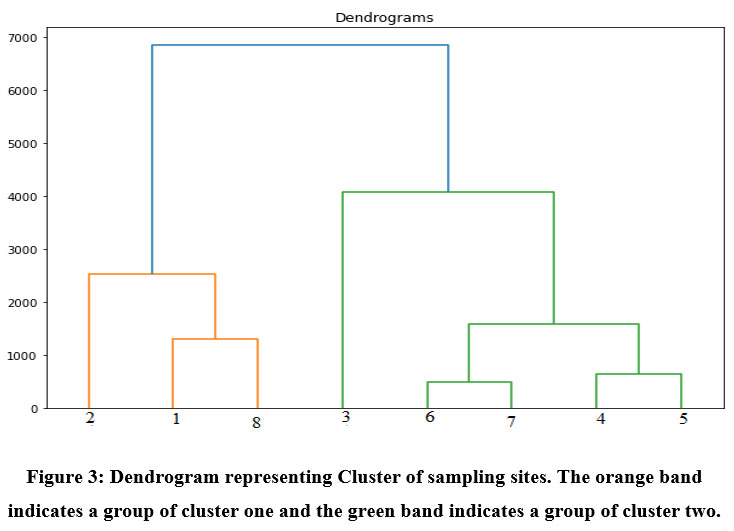 | Figure 3: Dendrogram representing Cluster of sampling sites. The orange band indicates a group of cluster one and the green band indicates a group of cluster two.
|
Conclusion
This research examined the concentration of metal pollution in Bhima River sediments, a region that has seen rapid bridge construction at S4 (Nelogi), S7 (Saradgi-B) and S8 (Jevargi) and routine religious practices at S1 (Gangapur), S3 (Chinamalla), and S6 (Rasangi). Multivariate statistical procedures defined the relationship and source of PTEs in sediments based on land-usage type. Results of this study indicate as sediment samples studied are contaminated by Cu and Mn at 75% and 50% of sites respectively, and by Cd at 88% of sites. Although Zn, Fe, and Pb were present in the sediment samples, they did not exceed the limit. The average concentrations of outlined PTEs were recorded into succeeding order Fe? Mn ? Cu ? Zn ? Pb? Cd. Combing obtained values of PTEs like Cu, Mn, and Cd, sites like S3, S4, S5, and S6 are acknowledged as major polluted sites of the river Bhima built on a contrast of the outcomes of statistical techniques as well as indices values. This study emphasizes the importance of improving sewage and reducing anthropogenic activities, as well as controlling the discharge of treated or untreated effluents at various sites along the river stretch. It is therefore recommended that necessary actions be taken to regulate the widespread dumping of waste generated by households, livestock manure, and raw sewage runoff into the river.
Acknowledgment
We extremely thank Omkar Jadhav USIC Department Gulbarga University, Kalaburagi for providing equipment facilities. The authors would like to express gratitude to the Gulbarga University, Kalaburagi for providing laboratory facilities for undertaking the present work.
Conflict of Interest
The authors declare no competing interests.
Funding Sources
The authors declare that no funds, grants, or other support were received during the preparation of this manuscript.
References
- Krishnanandan V, Srikantaswamy S. Assessment of impacts by industries on sediments of Kabini river around Nanjangud Industrial area, Karnataka, India. Int J Sci Eng Res 2013;4(11)2229-5518.
- Bortone G. Sediment treatment - A general introduction. In Sustainable management of sediment resources. Elsevier 2007;(2)1-10
- Huber M. E. Oceans at risk! Mar Pollut Bull 1999;38(6)435-438. http://www.pollutionissues.com/Re-Sy/Sedimentation.html. Assessed on 7/04/2022.
- Malhotra P, Chopra G, Bhatnagar A. Studies on Sediment Chemistry of River Yamuna with Special Reference to Industrial Effluents in Yamuna Nagar, India. Curr World Environ 2014;9(1)210.
- Milenkovic N, Damjanovic M, Ristic M. Study of Heavy Metal Pollution in Sediments from the Iron Gate (Danube River), Serbia and Montenegro. Pol J of Environ Stud 2005;14(6).
- Yang W, Cao Z, Zhang H, Lang Y. A national wide evaluation of heavy metals pollution in surface sediments from different marginal seas along China Mainland. Reg Stud Mar Sci 2021;(42)101637.
- Mucha A. P, Vasconcelos M. T. S, Bordalo A. A. Macrobenthic community in the Douro estuary: relations with trace metals and natural sediment characteristics. Environ Pollut 2003;121(2)169-180.
- Barbieri M. J. J. G. G. The importance of enrichment factor (EF) and geoaccumulation index (Igeo) to evaluate the soil contamination. J Geol Geophys 2016;5(1)1-4.
- Rascio N, Navari-Izzo F.Heavy metal hyperaccumulating plants: how and why do they do it? And what makes them so interesting. Plant Sci J 2011;180(2)169-181.
- Pourret O, Hursthouse A. It’s time to replace the term “heavy metals” with “potentially toxic elements” when reporting environmental research. Int J Environ Res Public Health 2019;16(22)4446.
- Zhou Q, Yang N, Li Y, Ren B, Ding X, Bian H, Yao X. Total concentrations and sources of heavy metal pollution in global river and lake water bodies from 1972 to 2017. Glob Ecol Conserv 2020;22, e00925.
- Tanvi D. A, Pratam K. M, Lohit R. T, Vijayalakshmi B. K, Devaraja T. N, Vasudha M, Gayathri D. Biosorption of heavy metal arsenic from Industrial Sewage of Davangere District, Karnataka, India, using indigenous fungal isolates. SN Appli Sci 2020;2(11)1-7.
- Ali H, Khan E, Ilahi I. (2019). Environmental chemistry and ecotoxicology of hazardous heavy metals: environmental persistence, toxicity, and bioaccumulation. J Chem 2019;1-14.
- Zwolak A, Sarzy?ska M, Szpyrka E, Stawarczyk K. Sources of soil pollution by heavy metals and their accumulation in vegetables: A review. Water, Air Soil Pollut 2019;230(7)1-9.
- Asaolu S. S, Adefemi O. S, Borode O. Concentration of heavy metals in water and sediment samples from ERO river in Southwestern, Nigeria. Curr World Environ 2009;4(1)33.
- Adimalla N, Chen J, Qian H. Spatial characteristics of heavy metal contamination and potential human health risk assessment of urban soils: A case study from an urban region of South India. Ecotoxicol Environ S 2020;(194)110406.
- Astuti R. D. P, Mallongi A, Choi K, Amiruddin R, Hatta M, Tantrakarnapa K, Rauf A. U. Health risks from multiroute exposure of potentially toxic elements in a coastal community: a probabilistic risk approach in Pangkep Regency, Indonesia. GEOMAT NAT HAZ AND RISK 2022;13(1)705-735.
- Astuti R. D. P, Mallongi A, Rauf, A. U. Natural enrichment of chromium and nickel in the soil surrounds the karst watershed. Glob J Environ Sci Manag 2021;7(3)383-400.
- Tuit C. B, Wait A. D. A review of marine sediment sampling methods. Environ Forensics 2020;21(3-4)291-309.
- Kaushik A, Kansal A, Kumari S, Kaushik C. P. Heavy metal contamination of river Yamuna, Haryana, India: assessment by metal enrichment factor of the sediments. J Hazard Mater 2009;164(1)265-270.
- Tang W, Zhao Y, Wang C, Shan B, Cui J. Heavy metal contamination of overlying waters and bed sediments of Haihe Basin in China. Ecotoxicol Environ S 2013;(98)317-323.
- Duncan A. E, de Vries N, Nyarko K. B. Assessment of heavy metal pollution in the sediments of the river Pra and its tributaries. Water Air Soil Pollut 2018;229(8)1-10.
- Ganugapenta S, Nadimikeri J, Chinnapolla S. R. R. B, Ballari L, Madiga R, Nirmala K, Tella L. P. Assessment of heavy metal pollution from the sediment of Tupilipalem Coast, southeast coast of India. Int J Sediment Res 2018;33(3)294-302.
- Siddiqui E, Pandey J. Assessment of heavy metal pollution in water and surface sediment and evaluation of ecological risks associated with sediment contamination in the Ganga River: a basin-scale study. Environ Sci Pollut Res 2019;26(11)10926-10940.
- Shirani M, Afzali K. N, Jahan S, Strezov V, Soleimani-Sardo M. Pollution and contamination assessment of heavy metals in the sediments of Jazmurian playa in southeast Iran. Sci Rep 2020;10(1)1-11.
- Zhang C, Yu Z. G, Zeng G. M, Jiang M, Yang Z. Z, Cui F, Hu L.Effects of sediment geochemical properties on heavy metal bioavailability. Environ Int 2014;73, 270-281.
- Hseu Z. Y, Chen Z. S, Tsai C. C, Tsui C. C, Cheng S. F, Liu C. L, Lin H. T. Digestion methods for total heavy metals in sediments and soils. Water Air Soil Pollut 2002; 141(1)189-205.
- Operators Manuals, iCE 3000 Series AA Spectrometers (P/N 155-171) Analytical and measuring instruments division, Thermo Fisher Scientific, SOLAAR House, 19 Mercers Row, Cambridge CB5 8BZ.United Kingdom.
- Muller G. Schwermetalle in den sediments des Rheins Veränderungen seit 1971, Umsch. 1979
- Turekian K. K, Wedepohl K. H. Distribution of the elements in some major units of the earth's crust. Geol Soc Am bull 1961;72(2)175-192.
- Sinex S. A, Helz G. R. Regional geochemistry of trace elements in Chesapeake Bay sediments. Environ Geol 1981;3(6)315-323.
- Ihedioha J. N, Ukoha P. O, Ekere N. R. Ecological and human health risk assessment of heavy metal contamination in soil of a municipal solid waste dump in Uyo, Nigeria. Environ Geochem Health 2017;39(3)497-515.
- L. Hakanson Ecological risk index for aquatic pollution control. A sedimentological approach, Water Res 14(1980)975–1001.
- Varol M. Assessment of heavy metal contamination in sediments of the Tigris River (Turkey) using pollution indices and multivariate statistical techniques. J hazard Mater 2011;(195)355-364.
- Tomlinson D. L, Wilson J. G, Harris C. R, Jeffrey D. W. Problems in the assessment of heavy-metal levels in estuaries and the formation of a pollution index. Helgol Meeresunters 1980;33(1)566-575.
- Kumar V, Sharma A, Kumar R, Bhardwaj R, Kumar Thukral A, Rodrigo-Comino J. Assessment of heavy-metal pollution in three different Indian water bodies by combination of multivariate analysis and water pollution indices. Hum Ecol Risk Assess 2020;26(1)1-16.
- Wang L, Wang X, Chen H, Wang Z, Jia X. Oyster arsenic, cadmium, copper, mercury, lead and zinc levels in the northern South China Sea: long-term spatiotemporal distributions, combined effects, and risk assessment to human health. Environ Sci Pollut Res202;29(9)12706-12719.
- Araujo D. F, Knoery J, Briant N, Ponzevera E, Chouvelon T, Auby I, Akcha F. Metal stable isotopes in transplanted oysters as a new tool for monitoring anthropogenic metal bioaccumulation in marine environments: The case for copper. Environ Pollut 2021;290, 1-10.
- Dhanakumar S, Murthy K. R, Solaraj G, Mohanraj R. Heavy-metal fractionation in surface sediments of the Cauvery River Estuarine Region, Southeastern Coast of India. Arch Environ Contam Toxicol 2013;65(1)14-23.
- Jeong H, Ra K, Won J. H. (2021). A nationwide survey of trace metals and Zn isotopic signatures in mussels (Mytilus edulis) and oysters (Crassostrea gigas) from the coast of South Korea. Mar Pollut Bull 2021;173:113061.
- Atafar Z, Mesdaghinia A, Nouri J, Homaee M, Yunesian M, Ahmadimoghaddam M, Mahvi A. H. Effect of fertilizer application on soil heavy metal concentration. Environ Monit Assess 2010;160(1)83-89.
- Mallongi A, Rauf A. U, Daud A, Hatta M, Al-Madhoun W, Amiruddin R, Astuti R. D. P. Health risk assessment of potentially toxic elements in Maros karst groundwater: a Monte Carlo simulation approach. Geomat Nat Haz Risk 2022;13(1)338-363.
- Mishra S, Kumar A, Shukla P. Estimation of heavy metal contamination in the Hindon River, India: an environmetric approach. Appli Water Sci 2021;11(1)1-9.


