Analysis of Rainfall Trends over Assam, North East India
Kakoli Gogoi1
*
and K. Nageswara Rao2

1
Discipline of Geology,
School of Sciences,
Indira Gandhi National Open University,
New Delhi,
India
2
Discipline of Geography,
School of Sciences,
Indira Gandhi National Open University,
New Delhi,
India
http://dx.doi.org/10.12944/CWE.17.2.15
Copy the following to cite this article:
Gogoi K, Rao K. N. Analysis of Rainfall Trends over Assam, North East India. Curr World Environ 2022;17(2). DOI:http://dx.doi.org/10.12944/CWE.17.2.15
Copy the following to cite this URL:
Gogoi K, Rao K. N. Analysis of Rainfall Trends over Assam, North East India. Curr World Environ 2022;17(2).
Download article (pdf)
Citation Manager
Publish History

Introduction
Agricultural activities mainly depend on the availability of water resources and soil productivity that support the livelihood and economy of the rural population of India. Changes in rainfall and temperature affect the socio-economic development of the natural environment by creating drought and flood-like conditions resulting in biodiversity loss as well as human lives. Climate studies require urgent and systematic attention; thus, this related research has gained importance around the world in order to understand the changing patterns of regional climates as they affect crop patterns and productivity, as well as the economy1-2. Climatic variables, particularly rainfall and temperature, can influence the water resources, which include the pattern of stream flow, groundwater reserves, and lakes/ponds/tanks of the concerned region3. Extreme rainfall events can create devastating floods, which are common in several parts of India. In recent years, many parts of the country received heavy to extreme rainfall (70 mm/day to about 120 mm/day) during the summer monsoon but maintained nearly the same average monsoon rainfall in total4-5.
Climatic studies at a regional scale are recognized as vital because changing climates influence the distribution of natural resources, including flora and fauna. The northeastern part of India is comprised of rich biodiversity, forest wealth, and good agricultural production. A large number of indigenous tribal people depend on various natural resources for their livelihood. Changing climates can impact the distribution and availability of resources, resulting in nutrition and food insecurity in these biologically diverse areas. IPCC6 observed that climate change will disturb agriculture production, flood and drought, groundwater depletion and water scarcity, etc. Global warming and extreme weather events may influence the hydrological cycles and patterns of stream flows.
The studies were conducted to analyze rainfall trends and their variability, as well as extreme rainfall events, with longtime series data in India and the Assam region7-8. Several attempts have also been made to analyze the National Aeronautics and Space Administration (NASA) Precipitation Radar Tropical Rainfall Measuring Mission (PRTRMM) satellite data and India Meteorological Department (IMD) data for identifying anomalies at multiple time scales with the help of modeling techniques9. The study of patterns and trends in climatic variables like precipitation and temperature is necessary for climate change predictions. The researchers used historical and longtime series to study the spatiotemporal variation of rainfall and temperature in arid and semi-arid drought prone regions10-11, hilly and mountainous lands12-13, coastal and urban areas14-15, and river basins16-18 around the globe. Mean annual rainfall variations and extreme rainfall events are recorded in the west and NE parts of India, mainly due to local orography. Deepak et al. (2012) recorded a notable change in long-time rainfall and in monsoon and post monsoon seasons in Assam19.
Spatio-temporal analysis of rainfall trends on a yearly, monthly, and seasonal basis is important in planning and developing water resources, agricultural production, and climate change mitigation measures. But it needs well-distributed hydro-meteorological stations for collecting data. In the case of non-availability and missing rainfall data, the long-term satellite-based datasets can be used to estimate rainfall and get better results20. Namita and Soham, (2022)21 observed a declining trend in monsoonal and annual rainfall since the 1950s over Sikkim, NE India. In Assam, it was expected to rise the temperature by +1.7 to 2.2°C and increase of extreme rainfall events nearly to 40% as per the observation of the climate action plan of Assam state22. Begum et al. (2022)23 analyzed the spatiotemporal trends of rainfall over Assam and noted a non-significant decreasing trend during the monsoon season in various locations across the state.
It is learned that the study of rainfall characteristics in a particular region is essential for assessing the consequences of changing climates. As suggested by IPCC6, the trends and variations of rainfall must be studied to prepare suitable strategies and adaptation plans to combat climate change. Although several studies on Indian summer monsoon rainfall were carried out, however, the present research work attempted to study rainfall variations during different seasons, monthly and annual over Assam of NE India by using the past dataset (1981-2017).
Methodology
Study Area
Assam is located in the south of the Eastern Himalayas in northeast India. It shares about 533 km of international boundaries with Bangladesh in the south and Bhutan in the north. Assam covers an area of 78,438 sq. km and is located between 24° 08? N - 28° 02? N latitude and 89° 42? E - 96° 00? E longitude. It is bounded in the north by Arunachal Pradesh and Bhutan, Nagaland, Manipur and Arunachal Pradesh in the east, Meghalaya and Mizoram in the south, and West Bengal, Tripura, and Bangladesh in the west (Fig. 1). The rivers Brahmaputra and Barak, and their tributaries, receive high rainfall almost round the year, which creates large- scale flood plains in this region. The river Brahmaputra originates in Tibet and flows down through China, India, and Bangladesh. In India, it enters Arunachal Pradesh draining nearly 226 km to reach the Assam plains. The river flows its waters for 700 km in length and finally enters Bangladesh to confluence into the Bay of Bengal. The channel length varies in the Assam valley and ranges between 1 and 18.5 km with an annual discharge of 19,820 cumecs20. The river Brahmaputra is known as the flooded river of Assam because of catastrophic events in 1954, 1962, 1966, 1972, 1973, 1977, 1978, 1983, 1984, 1987, 1988, 1991, 1993, 1995, 1996, 1998, 2016, and 2017 that devastated nearly 50% of the total geographical region of Assam in 201424. The climate is characterized by a tropical monsoon humid climate with temperatures varying from 6°C in December to 38°C in May, and the average annual rainfall is about 1140 cm, most of which receives from the southwest monsoon. The study area is home to rich biodiversity and true tropical rainforests. Intense rainfall and other factors that include deforestation may cause havoc in floods, resulting in loss of life, livelihood, and property. This region is also categorized as an earthquake-prone zone.
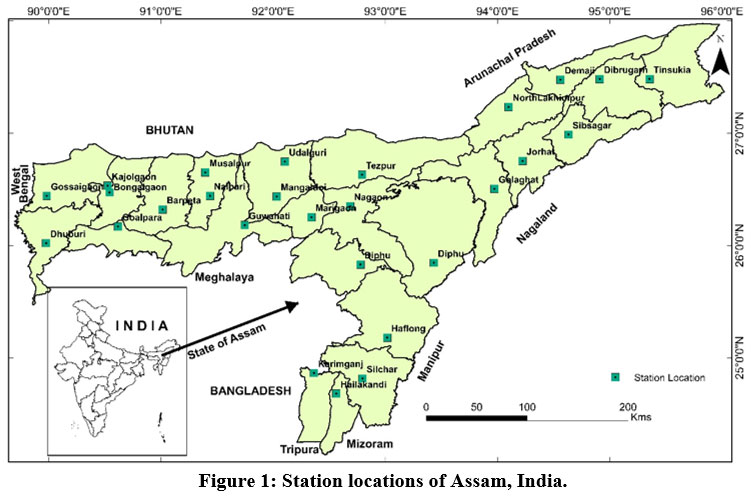 | Figure 1: Station locations of Assam, India.
|
For a period of 37 years during 1981-2017, rainfall data was collected from 26 locations covering the entire Assam state of India (Fig. 1). Some of the stations are located in high elevation zones and others represent valley portions. The monthly data were downloaded from the NASA website (https://power.larc.nasa.gov/) and the IMD stations. The geographical coordinates and altitude of locations are given in Table 1. The monthly, seasonal, and yearly analyses were carried out to ascertain trends in the rainfall data in the study area.
Method for Trend Analysis
In the present research work, the Mann–Kendall (MK) test was applied to evaluate the statistical significance of the rainfall trend in time series25-26. The test is more favored than any other test and has been applied in several hydro-meteorological studies across the world, including Ahmed et al. (2022)27, Priyanka and Naresh, (2022)28 in Assam and NE India, Praveen et al. (2020)29 in other parts of India, Mallick et al. (2021)30 in South West Asia, Muthoni et al. (2019)31 in Africa, and Goci? (2021)32 in Europe, Bartels et al. (2020)33 in Americas, and Yildirim and Rahman (2022)34 in Australia. It is based on the sample of data (Xi, i=1, 2, 3,.…n) is independent and equally spread when satisfying H0 (null hypothesis). On the other hand, if a monotonic trend exists in X, then the alternative hypothesis (H1) is considered. The significance level is ?=0.05 for Kendall’s p-value.
The S of Kendall’s tau is shown as Eq.1:
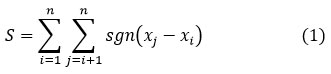
here, xi and xj (y=xj - xi)= sequential time series observations, ? =span of the time series.

For the sample size more than 10, a normal distribution with a mean zero is used and the discrepancy of statistics S has been calculated using Eq. 2:
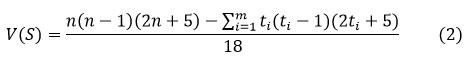
where, m is the number of tied groups and ti is the extent of the ith tied group. The Z is considered by using Eq.3:
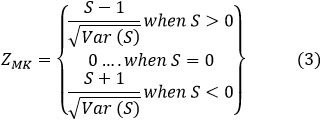
If lZl >Z1 –oc/2 , the hypothesis of no trend is rejected where Z is taken from the standard normal distribution table and ? is the level of significance35. The significance level i.e., 0.05 in hypothesis testing is used for rejecting the H0 in the present study.
The Magnitude of Trend
Sen’s Slope (SS) test, which works efficiently on monotonic data, was determined for analyzing the magnitude of trend in a time series36. Each individual slope (Q) was estimated using the Eq. 4:
where, Q = slope between data points x’j and x’j ; x’j = data measurement at time i'; xj= data measurement at time ‘i' and i' = time after time i.
The Sen's slope is the median of these N values of Q. The Sen's slope (Q') was computed based on the Eq. 5:
where, N= number of calculated slopes.
Frequency Analysis of Rainfall
Recurrence interval or return period and exceedance probability (reciprocal of return period) were calculated in the study area by using 37 years of annual precipitation data with the help of Weibul’s equation37 as follows:
where, n = total number of observations, m = rank of the observation.
Excel spreadsheet 2007 and Xlstat software were utilized for analytical calculations. The spatial distribution of rainfall maps was prepared with help of the Inverse Distance Weight (IDW), which is an interpolation algorithm that works between measurements, method in the ArcGIS environment. Each value of the amount of rainfall at a location estimated in IDW interpolation is a weighted average of the neighboring sample points. As it provides good results in estimating interpolation maps, the method can be used to prepare spatial distribution maps for point data38.
Results and Discussion
Rainfall Pattern
The rainfall received in 26 locations of different districts of Assam during the period of 1981-2017 is presented in Table 1. The 37-year time series data represents the typical spatial distribution of rainfall over Karimganj, Hailakandi, Silchar, Dhuburi, and Gossaigaon and others received a good rainfall throughout the monsoon months. The mean maximum and minimum were recorded as 2251.4 mm (Karimganj) and 1325.1 mm (Diphu). The dataset is skewed between -0.3 (Kajalgaon) and 2.2 (Karimganj). Most of the stations are positively skewed. The Kurtosis of the rainfall datasets ranged from -0.8 (Mangaldoi and Nagaon) to 5.7 (Hailakandi and Silchar) indicating platykurtic and leptokurtic distribution. The coefficient of variance (CV) was found to be 19.2%.
The long-term series of yearly rainfall explained that the average annual rainfall received was 1793.5 mm with a SD of ±346.2 mm. The average annual rainfall varies from 1325.1 to 2251.4 mm with CV from 13.2 to 36.8%. The highest variation was observed at Karimganj station (southern part) with 2251.4 mm (±829.5 mm) with CV 36.8% and the lowest was 1325.1 mm (±221.4 mm) at Diphu. The central and western portions of the study area received low rainfall when compared to north-eastern and southern parts (Fig. 2a). The coefficient of variation was noted to be contrary to the mean, which was high in the western and southern parts and low in the central region (Fig. 2b). The monsoon season (MS) contributes 71.8% of the total annual rainfall, the pre monsoon season (PRMS) 24.8%, and the winter season (WS) 2% of total rainfall, whereas rainfall in the post monsoon season (POMS) is the least (1.4%). The highest monthly rainfall is noted in July (348 mm) followed by June (309.3 mm), and Aug. (290.1 mm), while Jan. (10.3 mm), Dec. (10.5 mm), and Nov. (15.3 mm) months recorded low rainfall. The uneven distribution of rainfall events is a possible cause of floods in different portions of the state.
Rainfall Trends
The MK and SS test are generally applied for quantifying the trends in hydro-meteorological time series39-40. The analysis of rainfall data (1981-2017) was carried out in winter season (WS): January-February, pre monsoon season (PRMS): March-May, monsoon season (MS): June-October, and post monsoon season (POMS): November-December. Monthly, seasonal, and annual rainfall trends of the study were analyzed by using MK and SS tests.
Annual Rainfall Trend
The statistical results are presented in Table 2. ‘S’ value shows an increasing trend (+ve S value) and a decreasing trend (-ve S value). The annual rainfall shows an increasing trend with Sen’s slope magnitude of 16.504, while the winter and post monsoon seasons are recorded with decreasing trends. The magnitudes of the slope for winter and POMS are -0.180 and -0.193, respectively. During the study period 1901-2002, Goyal (2014)41 recorded insignificant changes in annual rainfall, but the monsoon season had a strong correlation with yearly rainfall, trailed by precipitation rainfall in summer and winter over Assam. The present study results also show the changes in rainfall patterns for the last two decades.
Table 1: Geographic details and rainfall (in mm) statistics (1981-2017) of different locations of Assam in NE India.
Location | Lat | Long | Elev (m) | Min | Max | Mean | Median | SD | Variance | CV (%) | Kur | Ske |
Barpeta | 26.32101 | 91.01471 | 117.55 | 1280.8 | 2354.1 | 1873.8 | 1904.0 | 271.4 | 73638.6 | 14.5 | -0.7 | -0.1 |
Bongaigaon | 26.47331 | 90.54161 | 116.51 | 1318.5 | 2466.9 | 1858.6 | 1889.2 | 294.9 | 86953.1 | 15.9 | -0.6 | -0.1 |
Demaji | 27.47701 | 94.56061 | 300.40 | 1380.4 | 2911.7 | 2102.8 | 2084.9 | 376.9 | 142067.3 | 17.9 | -0.4 | 0.3 |
Dhuburi | 26.02171 | 89.97681 | 119.16 | 896.9 | 2611.1 | 1641.9 | 1649.4 | 434.3 | 188628.2 | 26.5 | -0.6 | 0.2 |
Dibrugarh | 27.48251 | 94.91081 | 300.40 | 1380.4 | 2911.7 | 2102.8 | 2084.9 | 376.9 | 142067.3 | 17.9 | -0.4 | 0.3 |
Diphu | 25.84691 | 93.43201 | 447.60 | 947.6 | 1980.6 | 1325.1 | 1301.7 | 235.6 | 55530.3 | 17.8 | 0.6 | 0.7 |
Goalpara | 26.16951 | 90.61741 | 116.51 | 1318.5 | 2466.9 | 1858.6 | 1889.2 | 294.9 | 86953.1 | 15.9 | -0.6 | -0.1 |
Golaghat | 26.50531 | 93.97241 | 369.77 | 1278.2 | 2483.0 | 1835.9 | 1803.8 | 300.0 | 90026.2 | 16.3 | -0.4 | 0.2 |
Gossaigaon | 26.44241 | 89.98231 | 119.16 | 896.9 | 2611.1 | 1641.9 | 1649.4 | 434.3 | 188628.2 | 26.5 | -0.6 | 0.2 |
Guwahati | 26.18231 | 91.74681 | 239.30 | 1225.5 | 2289.6 | 1804.0 | 1819.1 | 265.0 | 70220.9 | 14.7 | -0.7 | -0.1 |
Haflong | 25.17981 | 93.01631 | 592.42 | 954.9 | 2430.5 | 1388.5 | 1343.0 | 315.4 | 99497.2 | 22.7 | 2.4 | 1.3 |
Hailakandi | 24.68171 | 92.56291 | 295.13 | 1100.2 | 4146.3 | 1852.6 | 1756.6 | 590.8 | 349091.0 | 31.9 | 5.7 | 2.0 |
Jorhat | 26.75361 | 94.22241 | 343.72 | 1234.4 | 2493.9 | 1813.8 | 1721.0 | 318.0 | 101130.0 | 17.5 | -0.4 | 0.4 |
Kajalgaon | 26.53231 | 90.52541 | 697.69 | 1308.4 | 2197.3 | 1753.8 | 1789.2 | 234.0 | 54751.1 | 13.3 | -0.7 | -0.3 |
Karimganj | 24.86521 | 92.36381 | 137.22 | 1233.5 | 5673.1 | 2251.4 | 2081.7 | 829.5 | 688037.4 | 36.8 | 7.4 | 2.2 |
Mangaldoi | 26.43681 | 92.03211 | 269.07 | 1152.7 | 2068.9 | 1641.3 | 1623.2 | 236.2 | 55798.5 | 14.4 | -0.8 | 0.0 |
Marigaon | 26.25251 | 92.34091 | 269.07 | 1152.7 | 2068.9 | 1641.3 | 1623.2 | 236.2 | 55798.5 | 14.4 | -0.8 | 0.0 |
Mushalpur | 26.65121 | 91.39631 | 618.90 | 1263.9 | 2249.0 | 1803.4 | 1815.5 | 238.4 | 56838.1 | 13.2 | -0.5 | -0.2 |
Nagaon | 26.34961 | 92.68621 | 258.95 | 1113.0 | 1950.6 | 1512.4 | 1499.7 | 221.4 | 49007.4 | 14.6 | -0.8 | 0.0 |
Nalbari | 26.44381 | 91.43781 | 117.55 | 1280.8 | 2354.1 | 1873.8 | 1904.0 | 271.4 | 73638.6 | 14.5 | -0.7 | -0.1 |
North Lakhimpur | 27.23421 | 94.09881 | 451.81 | 1418.6 | 2869.4 | 2149.0 | 2079.1 | 351.1 | 123263.6 | 16.3 | -0.3 | 0.2 |
Sibsagar | 26.98851 | 94.63201 | 557.95 | 1021.4 | 2560.9 | 1744.3 | 1674.7 | 379.9 | 144326.6 | 21.8 | -0.6 | 0.4 |
Silchar | 24.81671 | 92.79641 | 295.13 | 1100.2 | 4146.3 | 1852.6 | 1756.6 | 590.8 | 349091.0 | 31.9 | 5.7 | 2.0 |
Tezpur | 26.63101 | 92.79201 | 496.61 | 1207.0 | 2125.0 | 1668.7 | 1667.6 | 245.4 | 60241.8 | 14.7 | -0.7 | -0.1 |
Tinsukia | 27.48281 | 95.35371 | 373.96 | 1158.0 | 2890.5 | 1994.0 | 1967.0 | 426.6 | 182024.5 | 21.4 | -0.5 | 0.3 |
Udalguri | 26.74721 | 92.10461 | 631.32 | 1168.9 | 2063.8 | 1645.9 | 1638.1 | 231.2 | 53435.8 | 14.0 | -0.6 | -0.1 |
(Lat- Latitude; Long- Longitude; Ele- Elevation; Min- Minimum; Max- Maximum; SD- Standard Deviation; CV- Coefficient of Variation; Kur- Kurtosis; Ske- Skewness)
Monthly Rainfall Trend
Monthly rainfall trends inferred that the rainfall in the monsoon months (June and August) recorded an increasing trend of 4.4 and 3.5 mm/year, respectively. July and October were recorded with a slightly increasing trend, while the month of September decreased to -0.141 mm/y rainfall (Table 2). In particular, the month of May showed an increasing trend with 4.2 mm/y, and rainfall in June leads to flooding of fields in the region. However, the increasing trends of PRMS rainfall may help to perform the agricultural activities of field preparation and planting of crops at the beginning of the season. It is observed that December, January, and February show a decreasing trend in rainfall, which may lead to difficulties for farmers in preparing crops. The decreasing trend of rainfall in September may lead to water stress conditions for crops during the flowering stage and reduced production.
Table 2: MK test and Sen’s slope (Q) results for the period 1981-2017 in Assam, India.
| K tau | S | p-value | Q | Min | Max | Mean | SD |
Jan | -0.069 | -46 | 0.556 | -0.052 | 0.5 | 45.6 | 10.3 | 9.3 |
Feb | -0.084 | -56 | 0.472 | -0.230 | 0.7 | 71.9 | 25.8 | 17.6 |
Mar | 0.129 | 86 | 0.266 | 0.537 | 6.8 | 126.3 | 54.0 | 33.8 |
Apr | 0.165 | 110 | 0.154 | 1.909 | 37.5 | 349.8 | 163.7 | 82.3 |
May | 0.408 | 272 | 0.000 | 4.246 | 59.9 | 416.7 | 226.5 | 79.4 |
Jun | 0.360 | 240 | 0.002 | 4.418 | 148.9 | 504.8 | 309.3 | 83.6 |
Jul | 0.072 | 48 | 0.539 | 0.816 | 204.8 | 508.7 | 348.0 | 79.3 |
Aug | 0.291 | 194 | 0.012 | 3.550 | 160.8 | 528.9 | 290.1 | 91.2 |
Sep | -0.012 | -8 | 0.927 | -0.141 | 123.1 | 388.8 | 233.2 | 63.6 |
Oct | 0.189 | 126 | 0.102 | 1.698 | 12.8 | 239.5 | 106.9 | 56.8 |
Nov | 0.078 | 52 | 0.505 | 0.116 | 0.4 | 50.9 | 15.3 | 14.1 |
Dec | -0.057 | -38 | 0.628 | -0.058 | 0.0 | 57.0 | 10.5 | 11.3 |
Annual | 0.429 | 286 | 0.000 | 16.504 | 1357.7 | 2593.8 | 1793.5 | 279.0 |
WS | -0.048 | -32 | 0.685 | -0.180 | 2.1 | 108.5 | 36.1 | 21.6 |
PRMS | 0.366 | 244 | 0.001 | 6.700 | 182.5 | 774.4 | 444.1 | 137.6 |
MS | 0.393 | 262 | 0.001 | 9.270 | 922.6 | 1767.3 | 1274.2 | 180.7 |
POMS | -0.087 | -58 | 0.456 | -0.193 | 2.8 | 67.7 | 25.8 | 18.2 |
(K tau-Kendall's tau; Min- Minimum; Max- Maximum. SD- Standard Deviation; WS-Winter; PRMS- Pre Monsoon; MS- Monsoon; POMS- Post Monsoon)
Seasonal Rainfall Trend
The winter season (January to February) rainfall has a general decreasing trend over the study period. With a decreasing value of 0.2346 mm/year, it was extremely variable compared to the normals (Fig. 3a). There is a significant increasing trend from the 2000s as the moving average shows positive trend in the PRMS (Fig. 3b). The MS rainfall (June-October) has an increasing trend over the study period (9.6753 mm/year) (Fig. 3c). The POMS rainfall has shown an overall declining trend. The data is highly flexible compared to the normals (Fig. 3d). It has decreased by almost 5% over the long-term normal in the past 10 years period. The substantial decrease in rainfall (1901-2010) during MS and POMS over Assam was recorded42. A non-significant negative trend for the MS and a positive trend in rainfall for PRMS and POMS over Northeast India was noted by Lairenjam et al. (2017)43. Kumar et al. (2010)44 found no significant trend for monthly, seasonal and yearly rainfall during 1871-2005 in India. Haryana, Punjab, and Coastal Karnataka divisions of India data were found to be statistically significant. However, the rainfall was recorded in a decreasing trend over the northeastern parts, east Madhya Pradesh, and parts of Gujarat and Kerala45-46. Therefore, the spatial and temporal rainfall trends may vary from station to station or region to region data.
Long Term Average (LTA) Rainfall
The analysis shows that the study area exhibits heterogeneous rainfall patterns over space and time during 1981-2017. Out of 37 years, it was recorded that a total of 19 years received rainfall less than the long-term average (LTA), while 18 years were noted with more rainfall than LTA (Fig. 4). The LTA is recorded with 1793.5 mm rainfall. The minimum average annual rainfall (AAR) was recorded as 1357.7 mm in 1986, whereas the maximum AAR was noted as 2593.8 mm in 2017. The maximum downpour of more than 1900 mm was recorded with AAR of 1928.5 (1990), 1929.4 (2013), 1978.1 (1981), 1987.8 (2007), and above 2000 mm AAR noted were of 2010.5 (1988), 2060.7 (2004), 2112.5 (2012), 2178.6 (2015), 2200 (2016), 2375.7 (2010), 2593.8 (2017). During 2007-2017, the area received excess rainfall than LTA, except in 2014 (1758.6). Overall, the trend of rainfall in Assam during 1982-2017 indicates an increasing rainfall with an average value of 16.092 mm/yr. There was a significant excess of rainfall with departures varying between 0-200 mm for 12 years, and 6 years received 200-800 mm more rainfall than LTA. On the other hand, 8 years received less rainfall with departures varying between 0-200 mm less rainfall from LTA, and 10 years recorded more than 200 mm up to 435.8 mm. During 1981-2000 the area received nearly 49% of total rainfall whereas 51% of it was contributed in the last 17 years. Particularly, in the last decade during the study period, it was recorded that there was 15% excess rainfall of LTA. The highest percentage of excess rainfall than LTA observed was in 2017 (44.5%) preceded by 2010 (32.5%), 2016 (22.7%), and 2015 (21.5%) while the least rainfall was recorded in 1986 (24.3%), 1983 (23.2%, 1996 (19.7), and 1992 (18.7%).
Rainfall Frequency Analysis
The average annual rainfall and respective exceedance probabilities are presented in the form of graphs (Fig. 5). It shows that the maximum exceedance probability with the high value for the return period and the low rainfall has the minimum exceedance probability with a minimum value of recurrence interval or return period. The study area has a 51% of exceedance probability of receiving rainfall above LTA. It implies that in 19 years out of every 37 years over Assam state rainfall of 1793 mm or more can be expected. The amount of rainfall around 2000 mm corresponding to 0.75 of exceedance probability and 1800 mm (p=0.5) can be expected respectively in 28 years and 19 years over the study area.
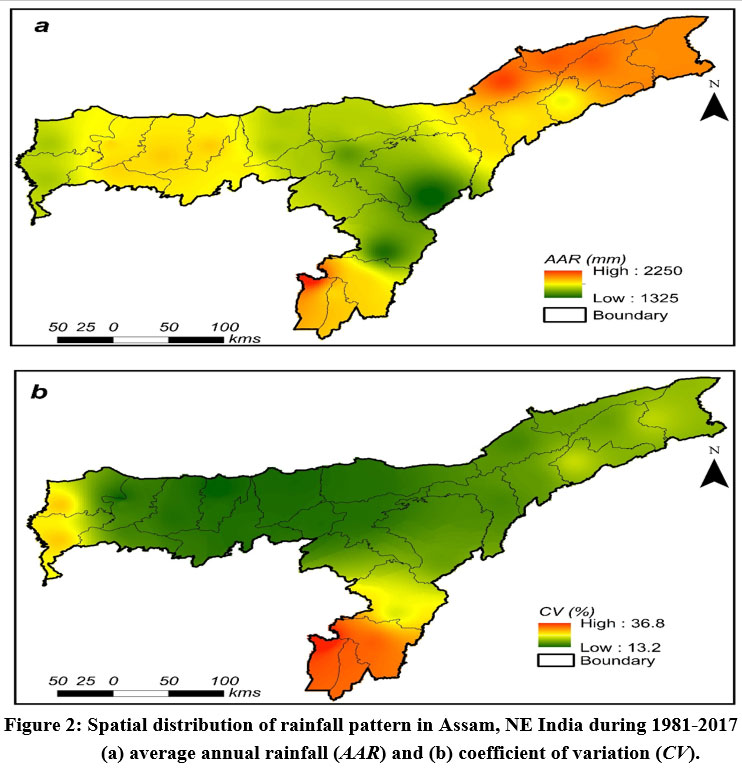 | Figure 2: Spatial distribution of rainfall pattern in Assam, NE India during 1981-2017 a) average annual rainfall (AAR) and b) coefficient of variation (CV).
|
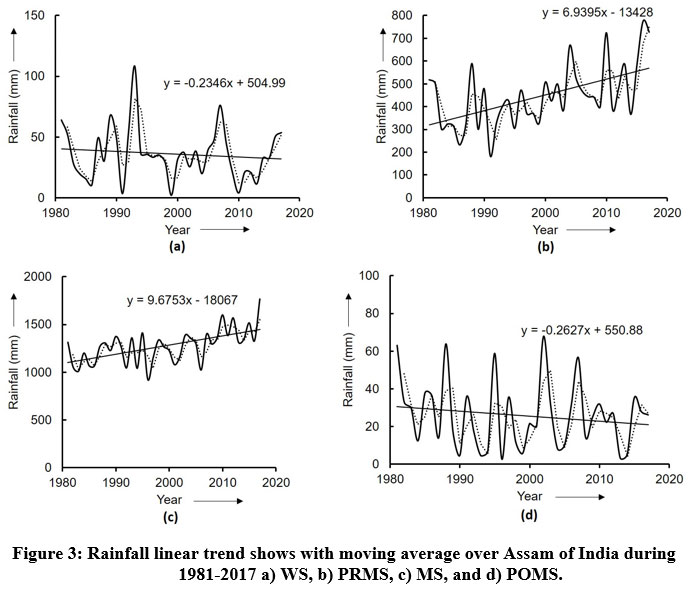 | Figure 3: Rainfall linear trend shows with moving average over Assam of India during 1981-2017 a) WS, b) PRMS, c) MS, and d) POMS.
|
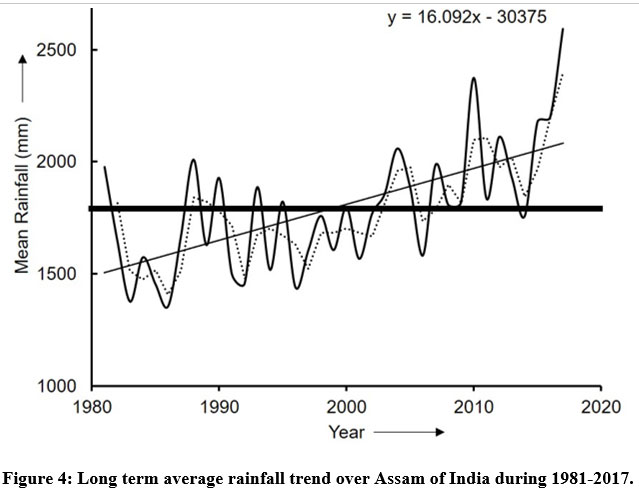 | Figure 4: Long term average rainfall trend over Assam of India during 1981-2017.
|
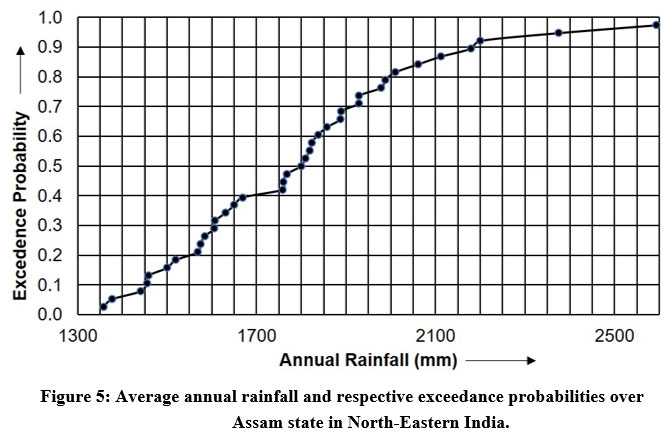 | Figure 5: Average annual rainfall and respective exceedance probabilities over Assam state in North-Eastern India.
|
Conclusions
The long-term rainfall during 1981–2017 over Assam state, NE India was analyzed to examine yearly, monthly, and seasonal trends. Trends in total rainfall are assessed using the MK and Sen’s slope test. Monthly rainfall trends witnessed a decreasing trend in September, December, January, and February. The months of May, June, and August recorded an increasing trend found to be statistically significant. Similarly, annual, PRMS, and MS increasing trends in rainfall witnessed with significant level, while POMS and WS trends were statistically non-significant. In the case of the location-wise rainfall in Assam, the four stations, i.e., Demaji, Dibrugarh, Karimganj, and North Lakhimpur, recorded with above 2000 mm average yearly rainfall, while Diphu and Hulflong noted less than 1500 mm. Karimganj, Hailakand, Silchar, Gossiagaon, and Dhuburi stations witnessed more than 25% of the CV rainfall. On seasonal scales, pre monsoon and monsoon rainfall over Assam witnessed increasing trends with statistically high significance levels. Whereas post monsoon and winter rainfall recorded decreasing trends, but the trend was statistically non-significant. Therefore, the stations for collecting data may need to be increased for analyzing trends in rainfall to arrive at reasonable conclusions in the present study.
Climate change can impact people’s livelihoods, particularly those who are dependent on natural resources. Assam is considered a global biodiversity hotspot since it supports varied ethnic and folk groups with a rich cultural heritage and traditional knowledge of the environment. The increased carbon footprint in Assam could be attributed to changing land use pattern, urbanization, growth of population, the use of fossil fuels, shifting cultivation along with deforestation, and other factors. The available evidence shows that the decline of forest cover and significant growth of population from about 8 million (1951) to 32 million (2011) also put pressure on the natural resources of the area. To make appropriate adaptation and mitigation plans by considering future climates, the concerned authorities must take necessary steps for establishing eco-restoration, education and awareness programs, and development of mechanisms at the regional and national levels coordination in protecting and conserving the natural resources of Assam. The decrease of rainfall in the POMS and the WS, and sudden rainfall events are a cause of great concern because they may have implications for the ecosystem as well as human health. It has been reported that flash floods in several parts of the state are occurring due to unprecedented and sudden heavy rainfall. The Nor’westers, locally called Bordoisila, comprise violent thunderstorms accompanied by strong winds. They raise alarm about changing of climates, which needs to be combated with suitable adaptation plans to avoid economic burden in the future. In view of the accelerated growth of extreme weather events, for example, floods and heatwaves in NE India in general and Assam in particular, the future studies need to be conducted by using daily rainfall and rainy days data for long-term historical time series. Due to the non-availability of data and data discontinuities, the present study only focused on monthly, seasonal, and yearly rainfall analysis for the period 1981-2017 to assess the rainfall trends. The distribution of established meteorological stations in the study area is relatively scarce and it is also impossible to establish them everywhere because of unsupported topography. Hence, considering the limitations of meteorological stations in the area, further research is possible by using long-term satellite-based rainfall estimates, which have become important sources across the globe for getting precipitation data for sparse regions.
Acknowledgment
We are grateful to NASA and India Meteorological Department for providing access to download the precipitation data from their website for academic and research purposes.
Conflict of Interest
The authors declare no conflict of interest.
Funding Sources
No funds/ grants were received for the present research work.
References
- Guhathakurta P, Sreejith O. P, Menon P. A. Impact of Climate Changes on Extreme Rainfall Events and Flood Risk in India. Journal of Earth System Science. 2011, 120 (3), 359-373.
- Ray K. C, Sinha, Srivastava A. K. Is there any Change in Extreme Events Like Heavy Rainfall? Current Science. 2000, 79(2), 155-158.
- Dore M. H. I. Climate Change and Changes in Global Precipitation Patterns: What Do We Know? Environment International. 2005, 31, 1167-1181.
- Goswami B. N, Venugopal V, Sangupta D, Madhusoodanan M. S, Xavier P. K. Increasing Trend of Extreme Rain Events Over India in a Warming Environment. Science. 2006, 314 (5804), 1442–1445.
- Malik N, Bookhagen B, Marwan N, Kurths J. Analysis of Spatial and Temporal Extreme Mosoonal Rainfall over South Asia using Complex Networks. Climate Dynamics. 2012, 39, 971-987.
- IPCC. Global warming of 1.5?. Special report, Intergovernmental Panel on Climate Change. 2020, 616.
- Guhathakurta P, Rajeevan M. Trends in Rainfall Pattern Over India. International Journal of Climatology. 2008, 28, 1453–1469.
- Gharphalia B. J, Deka R. L, Islam A. N, Dutta P, Medhi K. Variability and Trends of Rainfall Events in the Brahmaputra Valley of Assam, India. International Journal of Current Microbiology and Applied Science. 2018, 7(11), 1902-1912.
- Shepherd J. M, Pierce H. F, Negri A. J. Rainfall Modification by Major Urban Areas: Observations from Spaceborne Rain Radar on the TRMM Satellite. Journal of Applied Meteorology and Climatology. 2002, 41(7), 689-701.
- Francisco J. T. G, Thomas K. Precipitation-Temperature Variability and Drought Episodes in Northwest Baja California, México. Journal of Hydrology: Regional Studies. 2020, 27, https://doi.org/10.1016/j.ejrh.2019.100653.
- Ramkar P, Yadav S. M. Spatiotemporal Drought Assessment of a Semi-Arid Part of Middle Tapi River Basin, India. International Journal of Disaster Risk Reduction. 2018, 28, 414-426, DOI:10.1016/j.ijdrr.2018.03.025.
- Bhutiyani M. R, Kale V. S, Pawar N. J. Long-Term Trends in Maximum, Minimum and Mean Annual Air Temperatures across the Northwestern Himalaya during the Twentieth Century. Climatic Changes. 2007, 85, 159–177.
- Yang J, Tan C, Zhan T. Spatial and Temporal Variations in Air Temperature and Precipitation in the Chinese Himalayas during the 1971-2007. International Journal of Climatology. 2012, 33, 2622-2632.
- Dash S. K, Saraswat V, Panda S. K, Sharma N. A Study of Changes in Rainfall and Temperature Patterns at Four Cities and Corresponding Meteorological Subdivisions over Coastal Regions of India. Global and Planetary Change. 2013, 108, 175-194, https://doi.org/10.1016/j.gloplacha.2013.06.004.
- Santosh M. P, Deepak K, Mahesh K. J, Jan A, Spatial and Temporal Trends of Mean and Extreme Rainfall and Temperature for the 33 Urban Centers of the Arid and Semi-Arid State of Rajasthan, India. Atmospheric Research. 2014, 138, 73-90, https://doi.org/10.1016/j.atmosres.2013.10.024.
- Kothyari U. C, Singh V. P, Aravamuthan V. An Investigation of Changes in Rainfall and Temperature Regimes of the Ganga Basin in India. Water Resource Management. 1997, 11, 17-34, DOI: 10.1023/A:1017936123283.
- Deka R. L, Mahanta C, Pathak H, Nath K. K, Das S. Trends and Fluctuations of Rainfall Regime in the Brahmaputra and Barak Basins of Assam, India. Theoretical and Applied Climatology. 2013, 114 (61-71), DOI: 10.1007/s00704-012-0820-x.
- Rai R. K, Upadhyay A, Sarkar S, Upadhyay A. M, Singh V. P. GIUH based transfer function for Gomti River basin of India. Journal of Spatial Hydrology. 2009, 9, 24-50.
- Deepak J, Brijesh K. Y, Sunil M, Surajit C, Anil K. K. Identification of Trends in Rainfall, Rainy Days and 24h Maximum Rainfall over Subtropical Assam in Northeast India. Comptes Rendus Geoscience. 2012, 344(1), 1-13, https://doi.org/10.1016/j.crte.2011.11.002.
- Alemu Z. A, Dioha M. O. Climate Change and Trend Analysis of Temperature: The Case of Addis Ababa, Ethiopia. Environmental System Research. 2020, 9, 27, DOI: 10.1186/s40068-020-00190-5.
- Namita, C. and Soham, B. Long period trend analysis of precipitation and temperature of West Sikkim, India. Mausam. 2022, 73, 2, 413-422, DOI:https://doi.org/10.54302/mausam.v73i2.5484.
- ASAPCC. Assam State Action Plan on Climate Change (2015-2020), Department of Environment and Forests, Government of Assam. 2015.
- Begum, Asfika and Mahanta, Ratul. Spatio-temporal trend determination of temperature and rainfall for climate change and variability in Assam state, India. 2022, 45 – 58.
- Borah S. B, Sivasankar T, Ramy M. N. S, Raju P. L. N. Flood Inundation Mapping and Monitoring in Kaziranga National Park, Assam using Sentinel-1 SAR data. Environment Monitoring and Assessment. 2018, 190, 9, 1-11.
- Mann H. B. Nonparametric Tests against Trend. Econometrica. 1945, 13(3), 245-259.
- Kendall M. G. Rank Correlation Methods. Griffin, London. 1975, 160.
- Ahmed M, Hoque A, Islam MDK. A Trend Analysis of Climatic Variables in the Karimganj District of Assam, India. Indian Journal of Science and Technology. 2022, 15(10): 442-450. https://doi.org/10.17485/IJST/v15i10.109.
- Priyanka, S. and Naresh, K. Analysis of trend and temporal variability in rainfall over Northeast India. Mausam. April 2022, 73(2), 307-314. DOI:https://doi.org/10.54302/mausam.v73i2.5479
- Praveen, B., Talukdar, S., Mahato, S., Mondal, J., Sharma, P., Islam, A. R. M., and Rahman, A. Analyzing trend and forecasting of rainfall changes in India using non-parametrical and machine learning approaches. Scientific reports. 2020, 10(1), 1-21.
- Mallick, J., Talukdar, S., Alsubih, M. et al. Analysing the trend of rainfall in Asir region of Saudi Arabia using the family of Mann-Kendall tests, innovative trend analysis, and detrended fluctuation analysis. Theor Appl Climatol. 2021, 143, 823–841. https://doi.org/10.1007/s00704-020-03448-1
- Muthoni, F.K., Odongo, V.O., Ochieng, J. et al. Long-term spatial-temporal trends and variability of rainfall over Eastern and Southern Africa. Theor Appl Climatol. 2019, 137, 1869–1882. https://doi.org/10.1007/s00704-018-2712-1
- Arab Amiri, M. and Goci?, M.,. Innovative trend analysis of annual precipitation in Serbia during 1946–2019. Environmental Earth Sciences. 2021, 80(23), pp.1-15.
- Bartels, R.J., Black, A.W. and Keim, B.D.,. Trends in precipitation days in the United States. International Journal of Climatology. 2020, 40(2), pp.1038-1048.
- Yildirim, G., Rahman, A. Homogeneity and trend analysis of rainfall and droughts over Southeast Australia. Nat Hazards. 2022, 112, 1657–1683. https://doi.org/10.1007/s11069-022-05243-9 Barnard G. A. Significance Tests for 2 x 2 tables. Biometrika. 1947, 34, 123-138.
- Barnard G. A. Significance Tests for 2 x 2 tables. Biometrika. 1947, 34, 123-138.
- Sen P. K. Estimates of the Regression Coefficient Based on Kendall's Tau. Journal American Statistical Association. 1968, 63(324), 379-89.
- Shekhar, K. and Nageswara Rao, K. Analysis of temperature and precipitation for assessment of climate change during 20th century in Beas river basin. Mausam. April 2021, 72, (2), 489-506.
- Burrough, P.A., and McDonnell, R.A. Principles of geographical information systems for land resources assessment, Oxford University Press, New York, 1998.
- Alashan S. Combination of Modified Man-Kendall Method and Sen Innovative Trend Analysis. Engineering Reports. 2020, DOI: 10.1002/eng2.12131.
- Abegaz WB. and Mekoya A. Rainfall variability and trends over Central Ethiopia. Int J Env Sci Nat Res. doi.org/10.19080/IJESNR.2020.24.556144.
- Goyal, M.K. Statistical Analysis of Long Term Trends of Rainfall During 1901–2002 at Assam, India. Water Resour Manage. 2014, 28, 1501–1515. https://doi.org/10.1007/s11269-014-0529-y
- Deka RL, Mahanta C, Pathak H, Nath KK, Das S. Trends and fluctuations of rainfall regime in the Brahmaputra and Barak basins of Assam, India. Theor Appl Climatol. 2013, 114:61–71.
- Lairenjam, C., Hodam, S., Bandyopadhyay, A. and Bhadra, A. Historical and temporal trends of climatic parameters in North East India. Global NEST Journal. 2017, 19(4), 547-561.
- Kumar V, Jain S. K, Sing Y. Analysis of Long-Term Rainfall Trends in India. Hydrological Sciences Journal. 2010, 55(4), 484-496, DOI: 10.1080/02626667.2010.481373.
- Kumar R. K, Pant G. B, Parthasarathy B, Sontakke N. A. Spatial and Sub-Seasonal Pattern of Long-Term Trends of Indian Summer Monsoon Rainfall. International Journal of Climatology. 1992, 12(3), 257-268.
- Dash S. K, Jenamani R. K, Kalsi S. R, Panda S. K. Some Evidence of Climate Change in Twentieth-Century India. Climatic Change. 2007, 85, 299-321.


