Interlinkages Between Total Nitrogen and DOC Levels at an Urban Site of Saharsa District of Bihar (India)
DOI: http://dx.doi.org/10.12944/CWE.16.Special-Issue1.07
Copy the following to cite this article:
Roy A, Kulshrestha U. Interlinkages Between Total Nitrogen and DOC Levels at an Urban Site of Saharsa District of Bihar (India). Curr World Environ 2021; SI1. DOI:http://dx.doi.org/10.12944/CWE.16.Special-Issue1.07
Copy the following to cite this URL:
Roy A, Kulshrestha U. Interlinkages Between Total Nitrogen and DOC Levels at an Urban Site of Saharsa District of Bihar (India). Curr World Environ 2021; SI1. Available From : https://bit.ly/2SCiz2p
Download article (pdf)
Citation Manager
Publish History
Select type of program for download
| Endnote EndNote format (Mac & Win) | |
| Reference Manager Ris format (Win only) | |
| Procite Ris format (Win only) | |
| Medlars Format | |
| RefWorks Format RefWorks format (Mac & Win) | |
| BibTex Format BibTex format (Mac & Win) |
Article Publishing History
| Received: | 02-01-2021 |
|---|---|
| Accepted: | 20-05-2021 |
| Reviewed by: | 
 Alzira Dinis
|
| Second Review by: |

 Arpit Bhatt
|
| Final Approval by: | Dr. Monika J. Kulshrestha |
Introduction
Air pollution is perceived as a major issue due to increased urbanization and industrialization. Nitrogen is a major atmospheric constituent. It makes up around 78% by volume of the Earth’s atmosphere. The inert nitrogen is utilized by converting into different reactive compounds such as NH3, NO2, protein, urea etc. These nitrogen compounds are called reactive nitrogen species (Nr) which are chemically, biologically, photo chemically and radioactively active species1-2. NH3 and NOX are the major reactive nitrogen species which play important role in the atmospheric chemistry and nutrient supply2. Major sources of atmospheric NH3 include the nitrogen fixation, Haber-Bosch process and human excreta. NH3 is a highly soluble in water and can be corrosive at high concentration. NH3 emitted in the air is either deposited directly through dry deposition or gets transformed into an NH4+ aerosols. These NH4+aerosols play an important role in acid rain, nutrient supply and the radiative forcing.
Sources of atmospheric NOx include transport, industries, lightning, combustion of fossil fuels and biomass burning3-5. Deposition of anthropogenic constituents via wet and dry removal processes from the atmosphere has adverse impacts on terrestrial and aquatic ecosystems6. The elevated concentrations of NOX result in increased concentration of troposphere. High concentrations of nitrogenous compounds cause environmental problems such as eutrophication, soil acidification. Reaction of NO2 with OH and forms nitric acid (HNO3) which is deposited on the Earth’s surface7. Nitrous oxide (N2O) is mainly emitted by soils and paddy cultivation. N2O is a potent greenhouse gas which plays an important role in the ozone destruction in the stratosphere.
In spite of continuous emissions of Nr species, atmosphere keeps on cleaning itself and the constituents are scavenged in due course of time through wet deposition and dry deposition8. Wet deposition occurs in the form of rain, snow or fog. Wet deposition plays an important role in removing the organic carbon from the atmosphere9. A fraction of such carbon is soluble in rain water called dissolved organic carbon (DOC) which passes easily through the filter.The natural source of organic compounds includes VOCs, bio aerosols, from vegetation, forest fires, sea and volcanoes. The anthropogenic source includes combustion of coal, petroleum, fossil fuels, biomass burning, fugitive emission and Haber Bosch nitrogen fixation10. According to reports, half of the primary organic carbon is transformed into secondary organic aerosols (SOA). About 60% of OC is removed from the atmosphere through wet atmospheric deposition while 40% through dry deposition process. It is reported that atmospheric DOC can influence cloud albedo and cloud condensation nuclei, rainwater pH, photochemical processes and visibility11. Coinciding the importance of DOC, the present study was carried out to determine the DOC content in rainwater and to correlate its associated nitrogenous compounds in order to identify their co-variation and common source linkages. Apart from this, the study also aimed to determine the concentration of NO3- and NH4+ at the site as well as to find out the dominance of local vs transported sources of carbon and Nr species in the wet deposition at the study area.
Methodology
Sampling Site
As shown in Fig. 1, the siteSaharsatown is a district headquarter (25.88°N, 86.6°E) located in the eastern Bihar and falls in the northern plains of India. The location helps in estimating the air quality of the region as well. The district occupies an area of 1,687km2 at an altitude of 44 mamsl. The area has a population of 19,00,661. The district is surrounded by the river Kosi on the western side. Agriculture is the main occupation of people in the district. The main crops grown in the district are paddy, maize, jute, wheat, barley and sugarcane. Major sources of pollution at the site include vehicular emission, domestic cooking, biomass burning, chimneys and road dust. As the site lies close to the Indo-Nepal and Indo-Bangladesh borders, it would help in the study of trans-boundary pollution.
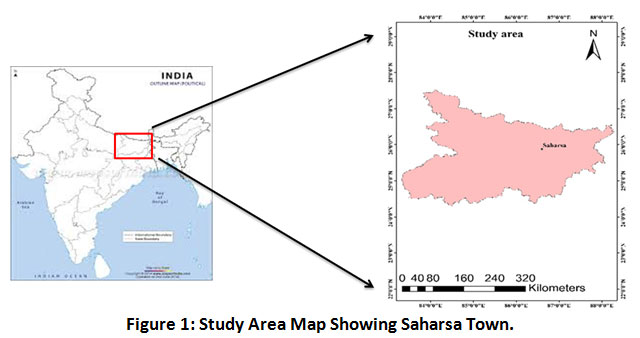 |
Figure 1: Study Area Map Showing Saharsa Town. Click here to view Figure |
Sample Collection
The sample collection was carried out at the terrace of a building at a height of 20m. An assembly of polythene funnel of 20cm diameter fitted onto 2L capacity polythene bottle was used for the collection of rain water. The samples were collected on event basis. After each rain event, the volume of the sample was measured using a measuring cylinder which was properly washed with de-ionized water. After the collection, samples were kept in prewashed small polythene bottles of 125ml volume. A small amount of thymol was added to the samples for preservation. A total of 18 samples were collected from July to October 2018. Further, the samples were brought to the laboratory and kept at 4°C in a refrigerator before analysis.
Chemical Analysis
After the collection of samples, pH and electrical conductivity of the samples were measured immediately. The NO3- and NH4+were analyzed by spectrophotometric method12. NH4+ was measured by colorimetrically using the indophenol blue method with the help of UV-vis spectrophotometer (Perkin Elmer, USA). The NO3- was determined by using the TRI solution method usingUV-vis spectrophotometer13.The bicarbonate ion (HCO3-) and alkalinity of samples were measured using titration method14.
The DOC in rainwater was determined by high temperature combustionwith a normal sensitivity catalyst technique using Shimadzu TOC analyzer. The DOC determination involves two steps – i) quantification of total carbon(TC)and ii). determination of inorganic carbon (IC). The standard for TC was prepared by dissolving potassium hydrogen phthalate in ultrapure water while the standard for IC measurement was prepared from a mixture of anhydrous sodium carbonate and sodium hydrogen carbonate. For the TC measurements, the sample was injected into the combustion tube. TC is the sum of IC and DOC (in filtered sample).For IC measurements, sample was acidified with H3PO4 and purged with a CO2 free carrier gas in order to remove and measure CO2 produced by the inorganic species.
Results and Discussion
pH Variation and Ionic Composition of Rainwater
Table 1 gives the descriptive statistics of different parameters measured in rainwater in mg/L. The pH values in the samples ranged from 5.5 to 7.68 with a mean value of 6.52(Fig. 2) The alkaline nature of the observed sample is mainly because of high loadings of suspended CaCO3 richparticulate matter in the atmosphere which is a common feature of Indian region6,15.However, one out of 18 samples was having acidic (pH below 5.6) which was due to prolonged and continuous rain. The continuous rainsresult in settling down of dust particles from atmosphere due to which the buffering capacity of rain water against sulphate and nitrate becomes low. Generally, as mentioned earlier the particulate matter in India consists of CaCO3 that results in high pH of rainwater in the region16.It was further confirmed by high values of bicarbonate ion (HCO3-) and alkalinity of samples. The concentration of HCO3 varied from 19.99 to 48 mg/L with an average value of 27.90 mg/L. The concentration of alkalinity varied from 16.39 to 39.36 mg/L with an average value of 22.90 mg/L. The conductivity of the samples varied from 1.91 to 4.91 µS/cm with an average of 0.77.
Table 1: Descriptive Statistics of Various Parameters.
|
N=18 |
PH |
Conductivity (µS/cm) |
NH4+ (mg/L) |
NO3- (mg/L) |
TOC (mg/L) |
IC (mg/L) |
TC (mg/L) |
TN (mg/L) |
ON (mg/L) |
|
Mean |
6.52 |
1.91 |
0.84 |
2.91 |
1.91 |
2.16 |
4.34 |
1.88 |
0.74 |
|
Max |
7.68 |
4.91 |
3.2 |
11.84 |
4.31 |
6.12 |
9.08 |
4.37 |
3.75 |
|
Min |
5.5 |
0.77 |
0 |
0.26 |
0.77 |
0.38 |
1.93 |
0.48 |
0.01 |
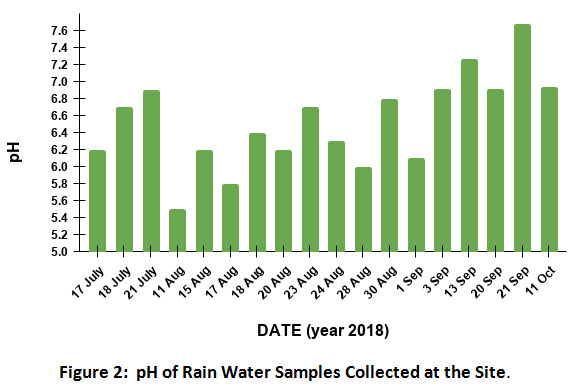 |
Figure 2: pH of Rain Water Samples Collected at the Site. Click here to view Figure |
Variation of NO3-andNH4+
In rainwater, N is mainly present as NO3- andNH4+ions17.In order to consider their equivalents for chemical transformation, NO3- andNH4+were calculated inµeq/L for further discussion in this section. The concentration of NO3- in the samples varied from 4.2 to 191µeq/Lwith an average of 52µeq/L. The sources of NO3-mainly include combustion of fossil fuel, biomass burning, brick kilns and vehicular emission at the site18. The Fig. 3 shows the variation in the pattern of NO3-and NH4+with time in the region.The sudden increase in the level of NO3- on 30th August 2018 might be due to heavy precipitation (13mm) occurred through strong lightning. Additionally, NO3- associated with crustal particulate matter might have beenwashed out.The lightning breaks N2 formingNO and NO2which are oxidized to NO3.In the reaction mentioned below, nitric oxide (NO) reacts with molecular oxygen to form nitrogen dioxide (NO2) which further reacts with ozone (O3) and forms nitrate (NO3).
2NO + O2 → 2NO2….[1]
NO2 + O3 → NO3 + O2….[2]
NO3 + NO → 2NO2….[3]
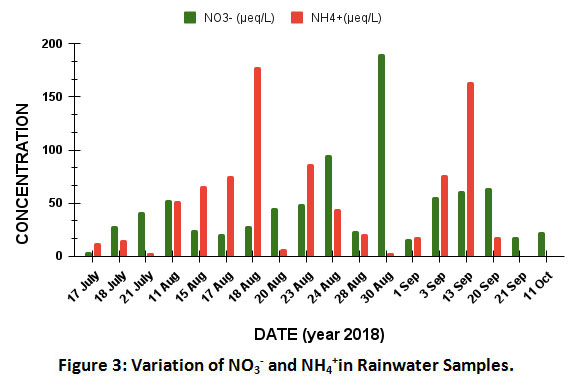 |
Figure 3: Variation of NO3- and NH4+in Rainwater Samples. Click here to view Figure |
The concentrations of NH4+ varied from 0 to 177.8µeq/L with an average of 51.1µeq/L. The Fig. 5 shows the variation in the pattern of NH4+ in the region. The higher levels of NH4+in rain water are mainly due to the release of NH3 from various sources such as use of ammonia containing fertilizers in agriculture, emissions from livestock, excreta of animal and human being as well as biomass burning in the area 5,13. NH3 readily reacts with H2SO4 and HNO3 forming respective salts19.Generally, due to abundance of CaCO3in air, free H2SO4 is not present in this region. When rain is continued for a longer period, the crustal material is washed out resulting in H2SO4and (NH4)2SO4formation8,15,20.
NH3 + H2SO4 → NH4HSO4
NH3 + NH4HSO4 → (NH4)2SO4
The present concentrations of NH4+and NO3- are not so high and hence, are not a threat to the soil fertility at present, due to very high critical load values in this region21.
Total nitrogen (TN) is the sum total of all the organic and inorganic nitrogen compounds present in the sample. NH3 is the major contributor in TN. The concentration of total nitrogen varied from 34.6 to 312.6µeq/L with an average of 138.2µeq/L (Fig.4). The high level of TN on 21 July 2018 indicates organic nitrogen to be one of the sources, apart from inorganic nitrogen. This needs further investigation.
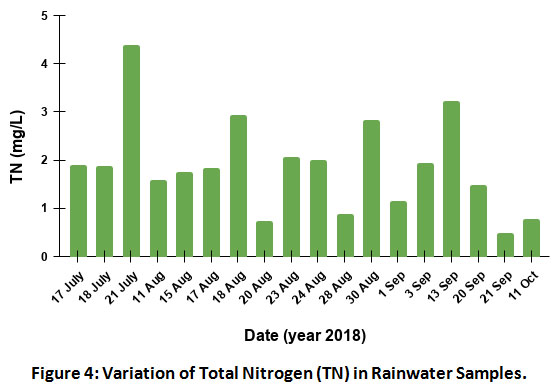 |
Figure 4: Variation of Total Nitrogen (TN) in Rainwater Samples. Click here to view Figure |
Water soluble organic Nitrogen is the deposition of organic nitrogen as gases or particles in precipitation.In order to evaluate the concentration of organic nitrogen in rain water, we have included NH4+and NO3-. TheNO2-is excluded as it is an unstable ion and is considered as a minor species in the rain water10. Organic nitrogen in atmosphere consists of a large number of reactive compounds, from small molecules to complex biological polymers. Some Organic nitrogen compounds have phytotoxicity effect and possess serious impact on human health. Organic nitrogen is derived as the difference in the measured concentration of dissolved inorganic nitrogen (DIN) and total nitrogen in the sample.
ON = TN-(NO3-+NH4+)
Emission of organic nitrogen in the atmosphere is either as particle phase or gas phase that further reacts to form the secondary particles. It is quite difficult to identify the exact source because through many continuous chain reactions in the atmosphere, formation of the secondary pollutants occurs. Source of precursors (e.g. formation of organic nitrates through photochemical reactions of hydrocarbons and nitrogen oxides may be recognized, but no single source is identifiable22. Some of the prominent sources of organic N compound areamines, amino acids, nitrophenols, urea, alkyl amides etc. There are different studies that show the identification of organic N based on the correlations with other species (NO3-, NH4+) whose source is known. DON has shown correlation with NH4+and with ammonium and amino acids23.
The concentration of dissolved organic nitrogen varied from 267.8 to 0.9µeq/L with an average of 49.9µeq/L at the site (Fig 5). The concentration of DON is very much dependent on the volume of the amount of rain collected. DON is quite high in the first three samples because of the low volume of the precipitation collected i.e. 0.67mm (first day), 0.48mm (second day) and 0.26mm (third day). Sources of organic N compounds is from the use of fertilizers in the agricultural land (Urea), livestock & animal husbandry (Amines and Urea), landfills (amines), and biomass burning (nitrophenols)24.
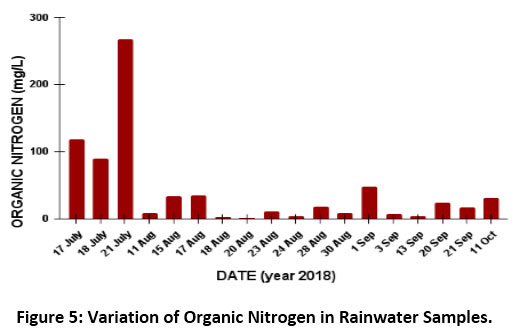 |
Figure 5: Variation of Organic Nitrogen in Rainwater Samples. Click here to view Figure |
Backward Trajectory Analysis
Back-trajectories were generated using the HYSPLIT 4 model of the Air Resources Laboratory of NOAA. The back trajectory helps in demonstrating trans-boundary and long range transport of air pollution. In this study, back trajectory of single event from every month (July 2018 to October 2018) has been shown in Fig.6. Back-trajectories were calculated up to 1000 m above ground level (AGL) for 72-h at 00:00 UTC for each of the rain event. In July, during monsoon, the air masses were coming from the horn of Africa. In August, these were coming from the central part of Indian Ocean and Bay of Bengal that contributedthese pollutants. But all these have passed through Bangladesh. In September and October also, these were coming from Bangladesh area. The possibility of trans-boundary pollution from nearby countries cannot be ruled out.
The airmass trajectories are used tofigure out the source region as well as different factors relating to atmosphere and climate such as transport of pollutants, air quality, climatology,source apportionment, meteorology, residence time analysis, precipitation chemistry25-27. Several studies have been reported on long range and transboundary transport of pollution using airmass trajectories.
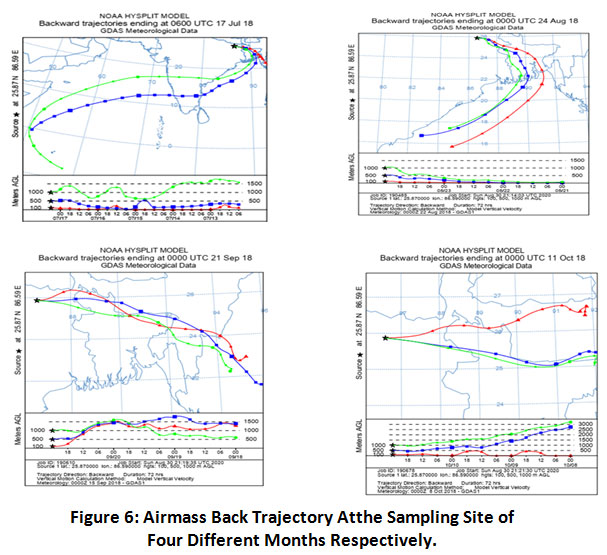 |
Figure 6: Airmass Back Trajectory Atthe Sampling Site of Four Different Months Respectively. Click here to view Figure |
Variation of TOC, TC, IC & TN
At this site, the concentration of inorganic carbon (IC)varied from 0.38 to 6.12mg/L with an average of 2.16mg/L(Fig. 7a). Inorganic carbon includes carbonate and bicarbonate present in rain water28. Sources of carbon at the site included the biomass burning by the local people, fossil fuel burning mainly coal in the brick kilns, domestic cooking, by Barauni Oil Refinery and vehicular emissions. However, carbon can be transported from the nearby countries also as mentioned in the backward trajectory section.
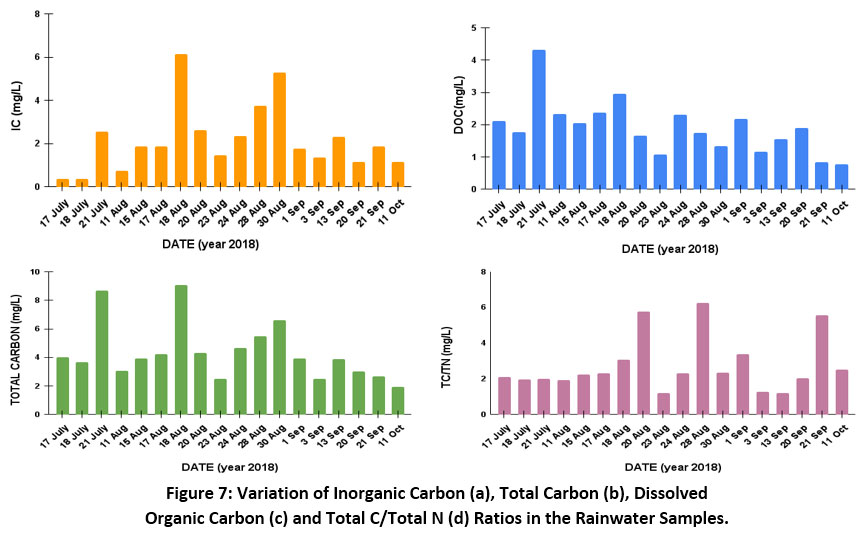 |
Figure 7: Variation of Inorganic Carbon (a), Total Carbon (b), Dissolved Organic Carbon (c) and Total C/Total N (d) Ratios in the Rainwater Samples. Click here to view Figure |
The total carbon (TC) in the precipitation is the sum of total organic carbon and inorganic carbon. The concentration of TC at the site varied from 1.93 to 9.08 mg/L with an average of 4.34 mg/L as shown in Fig. 7(b). The sources of TCare mainly the biomass burning, domestic cooking, brick kilns etc.
The dissolved organic carbon (DOC) in this study represents TOC as the samples were filtered29. Figure 7(c) shows the concentration of dissolved organic carbon that varied from 0.77 to 4.31 mg/L with an average value 1.91 mg/L.In the wet deposition process, the organic particles present get scavenged from the atmosphere and dissolve in the water, thereby contributing in the concentration of total organic carbon. During the early days of rain events, the organic compounds are scavenged more from the atmosphere than the later stages of rainfall30-31. Therefore, the concentration of DOC is more in such samples.Another factor that determines more efficient scavenging of organic compounds from the atmosphere is the lower rate of precipitation in each event of rain.
Figure. 7(d) shows the ratio between total carbon (TC) and total nitrogen (TN). The high value of TC/TN ratio gives the dominant carbon source in the samples.Anthropogenic activities near site generally include burning ofbiomass, household waste and plastics which releases carbon into the atmosphere. Domestic cooking plays an important role in the carbon emission which might be a factor for high C/N ratios.
Conclusions
The average value of pH of the rain water samples at the study site in Saharsa district of Bihar was recorded as 6.67 having the range from 5.50 to 7.68. This range of pH is similar to other sites reported in earlier studies in north India. The high loading of CaCO3 rich suspended particulate matter in the atmosphere results in the higher pH of rain water. Further, due to presence of carbonate or bicarbonate ion, the inorganic carbon concentration in the samples ranged from 0.36 to 6.12 mg/L. The average concentration of total carbon was 4.34 mg/L and total organic carbon was 1.91 mg/L. In this study, the NH4+had an average value of 0.84 mg/L while NO3-as2.91 mg/L in rain water. The probable sources of NH4+contributionsinclude fertilizer application in agriculture fields, human excreta and rearing of domestic animal could be the reason while that of NO3-include biomass burning, automobileemissions, coal burningand presence of brick kilns around the area. However, the back trajectory analysis showed an influence of trans-boundary pollution transported from Bay of Bengal and Bangladesh side too. The study suggests to carry out long term measurements of rain chemistry in order to quantify the local vs trans-boundary pollution at this site.
Acknowledgement
We sincerely acknowledge the financial support received from DST PURSE programme. The author, Akanksha Roy acknowledges the award of JRF received from UGC, India which helped in the completion of this work. This study is a part of our group activities viz. DRS-NET-India group and UKRI GCRF South Asian Hub project.
Conflict of Interest
No conflict of interest.
Funding Source
No funding source.
References
- Galloway, J. N., Schlesinger, W. H., Levy, H., Michaels, A., &Schnoor, J. L. (1995). Nitrogen fixation: Anthropogenic enhancementâ€environmental response. Global biogeochemical cycles, 9(2), 235-252.
CrossRef - Katoch, A., &Kulshrestha, U. C. (2020). Study of Risk Assessment of Indoor NH3 in Two Urban Households of NCR-Delhi. Current World Environment, 15(2), 163.
CrossRef - Seinfeld, J. H., Pandis, S. N., &Noone, K. (1998). Atmospheric chemistry and physics: from air pollution to climate change. PhT, 51(10), 88.
CrossRef - Dentener, F., Drevet, J., Lamarque, J. F., Bey, I., Eickhout, B., Fiore, A. M., ... & Lawrence, M. (2006). Nitrogen and sulfur deposition on regional and global scales: A multimodel evaluation. Global biogeochemical cycles, 20(4).
CrossRef - Lobert, J. M., Scharffe, D. H., Hao, W. M., &Crutzen, P. J. (1990). Importance of biomass burning in the atmospheric budgets of nitrogen-containing gases. Nature, 346(6284), 552-554.
CrossRef - Sharma, A., &Kulshrestha, U. C. (2020). Wet deposition and long-range transport of major ions related to snow at Northwestern Himalayas (India). Aerosol and Air Quality Research, 20(6), 1249-1265.
CrossRef - Tiwari, R., &Kulshrestha, U. (2019). Wintertime distribution and atmospheric interactions of reactive nitrogen species along the urban transect of Delhi–NCR. Atmospheric environment, 209, 40-53.
CrossRef - Kulshrestha, U. (2013). Acid rain (pp. 8-22). Taylor and Francis, Manila Typesetting Company, New York.
- Sonwani, S., &Kulshrestha, U. C. (2019). PM 10 carbonaceous aerosols and their real-time wet scavenging during monsoon and non-monsoon seasons at Delhi, India. Journal of Atmospheric Chemistry, 76(3), 171-200.
CrossRef - Naseem M, Kulshrestha U. C. An Overview of Atmospheric Reactive Nitrogen Research: South Asian Perspective. Curr World Environ 2019;14(1).
CrossRef - Galloway, J. N., Aber, J. D., Erisman, J. W., Seitzinger, S. P., Howarth, R. W., Cowling, E. B., & Cosby, B. J. (2003). The nitrogen cascade. Bioscience, 53(4), 341-356.
CrossRef - Kumar, B., Singh, S., Gupta, G. P., Lone, F. A., &Kulshrestha, U. C. (2016). Long range transport and wet deposition fluxes of major chemical species in snow at Gulmarg in North Western Himalayas (India). Aerosol and air quality research, 16(3), 606-617.
CrossRef - Singh S. &Kulshrestha U. C. Abundance and distribution of gaseous ammonia and particulate ammonium at Delhi, India. Biogeosciences. 2012;9(12):5023.
CrossRef - Noguchi, I., & Hara, H. (2004). Ionic imbalance due to hydrogen carbonate from Asian dust. Atmospheric Environment, 38(40), 6969-6976.
CrossRef - Kulshrestha U. C., Kulshrestha M. J., Sekar R., Sastry G. S. R. &Vairamani M. Chemical characteristics of rainwater at an urban site of south-central India. Atmospheric Environment. 2003;37(21):3019-3026.
CrossRef - Chaturvedi, M., &Kulshrestha, U. (2020, May). Reactive nitrogen fluxes and scavenging patterns through sequential sampling over Mathura, India. In EGU General Assembly Conference Abstracts (p. 21779).
CrossRef - Xie, Y.X., Xiong, Z.Q., Xing, G.X., Sun, G.Q., Zhu, Z.L., 2007. Assessment of nitrogen pollutant sources in surface waters of Taihu Lake region. Pedosphere 17,
200e208.
CrossRef - Singh, S., &Kulshrestha, U. C. (2014). Rural versus urban gaseous inorganic reactive nitrogen in the Indo-Gangetic plains (IGP) of India. Environmental Research Letters, 9(12), 125004.
CrossRef - Singh, S., Sharma, A., Kumar, B., &Kulshrestha, U. C. (2017). Wet deposition fluxes of atmospheric inorganic reactive nitrogen at an urban and rural site in the Indo-Gangetic Plain. Atmospheric Pollution Research, 8(4), 669-677.
CrossRef - Kulshrestha U. C. Mutius, Reddy L. A. K., Satyanarayana J. &Kulshrestha M. J. Real-time wet scavenging of major chemical constituents of aerosols and role of rain intensity in Indian region. Atmospheric Environment. 2009;43(32):5123-5127.
CrossRef - Sharma, D., &Kulshrestha, U. C. (2018). Chemistry of atmospheric dust and critical load assessment in Delhi region (India). Chemistry and Ecology, 34(5), 470-481.
CrossRef - Matsumoto, K., Takusagawa, F., Suzuki, H., & Horiuchi, K. (2018). Water-soluble organic nitrogen in the aerosols and rainwater at an urban site in Japan: implications for the nitrogen composition in the atmospheric deposition. Atmospheric Environment, 191, 267-272.
CrossRef - Ham, Y. S., & Tamiya, S. (2007). Contribution of dissolved organic nitrogen deposition to total dissolved nitrogen deposition under intensive agricultural activities. Water, air, and soil pollution, 178(1-4), 5-13.
CrossRef - Cape, J. N., Cornell, S. E., Jickells, T. D., &Nemitz, E. (2011). Organic nitrogen in the atmosphere—Where does it come from? A review of sources and methods. Atmospheric Research, 102(1-2), 30-48.
CrossRef - Kulshrestha U and Mishra M. 2020. A Review on Long Range Transport of Air Pollution in South Asia. VayuMandal 46(2), 21-30.
- Kumar, B., Gupta, G. P., Singh, S., Lone, F. A., &Kulshrestha, U. C. (2016). Atmospheric Deposition of Reactive Nitrogen and Other Species in Relation with Long Range Transport and Land Use and Land Cover Change in North Western Himalayas. IORE Journal of Environmental Science, 2, 1-17.
CrossRef - Kulshrestha, U., & Kumar, B. (2014). Airmass trajectories and long range transport of pollutants: review of wet deposition scenario in South Asia. Advances in Meteorology, 2014.
CrossRef - Mishra, M., and Kulshrestha, U. (2016). “Chemical characteristics and deposition fluxes of dustcarbonmixed coarse aerosols at three sites of Delhi, NCR.” Journal of Atmospheric Chemistry,Vol.74, Issue-4, pp 399-421. https://doi.org/10.1007/s10874-016-9349-1 (ISSN:1573-0662).
CrossRef - Pan, Y., Wang, Y., Xin, J., Tang, G., Song, T., Wang, Y., ... & Wu, F. (2010). Study on dissolved organic carbon in precipitation in Northern China. Atmospheric Environment, 44(19), 2350-2357.
CrossRef - Sempere, R., & Kawamura, K. (1994). Comparative distributions of dicarboxylic acids and related polar compounds in snow, rain and aerosols from urban atmosphere. Atmospheric Environment, 28(3), 449-459.
CrossRef - Willey, J. D., Kieber, R. J., Eyman, M. S., & Avery Jr, G. B. (2000). Rainwater dissolved organic carbon: concentrations and global flux. Global Biogeochemical Cycles, 14(1), 139-148.
CrossRef


