Diurnal Variation of Ambient NH3 in Relation with Agricultural Activities and Meteorological Factors at a Rural Site in North India
Sudesh
and U. C. Kulshrestha
*

http://dx.doi.org/10.12944/CWE.16.Special-Issue1.02
Copy the following to cite this article:
Sudesh S, Kulshrestha U. C. Diurnal Variation of Ambient NH3 in Relation with Agricultural Activities and Meteorological Factors at a Rural Site in North India. Curr World Environ 2021; SI1. DOI:http://dx.doi.org/10.12944/CWE.16.Special-Issue1.02
Copy the following to cite this URL:
Sudesh S, Kulshrestha U. C. Diurnal Variation of Ambient NH3 in Relation with Agricultural Activities and Meteorological Factors at a Rural Site in North India. Curr World Environ 2021; SI1. Available From : https://bit.ly/37snlUW
Download article (pdf) Citation Manager Publish History

Introduction
The biogeochemical cycling of nitrogen is of vital importance due to the role of nitrogen in both aquatic and terrestrial ecosystems. However, global nitrogen cycle is being disturbed by the unchecked increase in food and energy production resulting in the accumulation of Reactive Nitrogen (Nr) in various environmental matrices. Generally, Nr refers to any formof nitrogen compound that is biologically active, photo chemically reactive and radioactively active in the biosphere and atmosphere of theearth.1-2Nr includes inorganic reduced form of N (NH3, NH4+), inorganic oxidized forms (NOx, NO3-, N2O, HONO) & organic nitrogen compounds.3However, these Nr species are extremely important in atmospheric chemistry. Henceforth, the monitoring of Agricultural nitrogen air emissions and understanding their behaviour in atmosphere is crucial due to impending environmental and human health concern of the latter.One of the major sources of the incessant increase in the nitrogen air emissions is the agriculture activities followed by livestock, human waste, transport sector. Ammonia is one of the most important reactive Nitrogen (Nr) compounds emitted from agricultural sources. Other minor anthropogenic sources ofatmospheric NH3emissions include animal manure, slash burning and industries4along with the natural sources such as forest fires, soils and oceans.5-6. In India, IGP has been reported as hotspot of both NH3 and NH4+ emissions due to intense agricultural activities in the region.7 The major contributor for NH3 emissions in agricultural systems includes inorganic fertilizers, livestock manure, increased biological N-fixation, biomass burning and residue added to the field after crop harvesting.For instance, as reported byMisselbrook et al.,8agricultural sector alone is responsible for about 90% of the total atmospheric NH3 emissions. According to Vitousek et al.,9human interventions have approximately doubled the fluxes of Nr species viz NH3, NOx,NH4+, NO3−, and N2O10 .Human activities contribute approximately 170 Tg year-1 of Nr into agroecosystems, where inorganic fertilizer additions account for about 80 Tg Nr annually.11 For Indian Scenario, Aneja et al.,12 reported the highest contribution of fertilizer application and livestock towards NH3 as 2696.6 Gg and 1704.8 Gg respectively. Among various inorganic fertilizers, urea isthe most widely used N fertilizer in south Asia.13 Furthermore,urea is the highest contributor (~ 94%) of NH3 because of its large scale use and nitrogen content is maximum among all other fertilizers being used in India.14 Urea alone contributes 2481.5 Gg NH3whereas di-ammonium phosphate (DAP), NPK, ammonium phosphate contributes 124.8 Gg, 89.7 Gg and 0.6 Gg NH3respectively, annually. Also, the rate of increase of urea in agricultural fields is estimated to be 92% per year, thus adding to the Nr budget.1345-55% of these Nr inputs are recovered by crop biomass whereas remaining is lost from agricultural systems via. leaching, erosion (32–45 Tg N year−1) and denitrification(26–60 Tg N year−1).10-11Hence directly or indirectly influences the Nitrogen cycle.
A remarkable portion of N-fertilizer or excessreactive soil N (Nr) is lost through volatilization in the form of ammonia(NH3) and surface run off which significantly contributes to the Nitrogen loss. Bouwman et al., 15 reported that 10–30% of the applied N fertilizer is lost through volatilization process. Once NH3 is applied to the soil by fertilizer addition, NH4+ gets retained on the exchange sites. NH4+ is either nitrified to nitrate (NO3-), or decomposed to NH3, depending on soil and environmental conditions. High temperature inhibits the nitrification process as reported by Grunditz and Dalhammar,16and hence, ammonia volatilization increases with increase in temperature.In agroecosystems, NH3 emissions can be reduced by minimizing the N input, increasing the efficiency of N fertilizers.17
Some studies have been carried out by research groups for NH3 inventories in Asian region18 which mainly relied on emission factors. However, no country-specific emission factor for NH3 is available, there is high uncertainty in the emission estimates of NH3 in India.19 As reported by Parashar et al 20NH3 emissions from fertilizers and livestock are estimated to be 1175 Gg and 1433 Gg, respectively. According to the estimates given by Yang et al,21 the concentration of gaseous ammonia varied from 1.3 to 17.2 μg m−3 throughout the year. These concentrations were observed at an agricultural field site which was remarkably higher in the summer than winter.
Fate of atmospheric ammonia (NH3) is highly variable.NH3 is the most abundant alkaline constituent in theatmosphere22and a precursor molecule for secondary aerosol formation causing severe air pollution in East and South Asia by contributing ambient levels of fine particulate matter (PM2.5).23Transformation of atmospheric NH3 into NH4+via chemical processes of precursor gases (NH3, SO2, NOx) occurs either by condensation or by direct nucleation. The major inorganic compounds formed through the gas-to-particle formation process are ammonium bisulfate (NH4HSO4), ammonium sulfate (NH4)2SO4, ammonium nitrate (NH4NO3) and ammonium chloride (NH4Cl).Due to the substantial increment in atmospheric NH3 emissions and its transformation, more ammonium (NH4+) is returned to terrestrial and aquatic ecosystems via dry and wet deposition mechanisms.In temperate regions, precipitation is the main scavenging mechanism whereas in dry regions (with no or little rainfall) dry deposition is the dominating mechanism for the removal of atmospheric pollutants. Since, in India~ 90 % of precipitation occurs during monsoon period (June to September), dry deposition is the dominating mechanism for the scavenging of atmospheric pollutants throughout the year.24 Moreover, the fate of Nr species is determined by atmospheric acidity, particulate loading, land use dynamics, and photochemistry of the atmosphere.25The deposition of NH3 and NH4+in various compartments across the globe causes a cascade of environmental problems such as eutrophication of terrestrial and aquatic ecosystem, biodiversity loss,forest damage, water and soil acidification.26-27Hence its role in atmospheric phenomenon such as neutralisation of cloud water, precipitation and aerosol formation typically in the fine particle size range is pivotal.28
In addition, the formation of ammonium particulates increases the residence time of NH3 in the atmosphere thereby influencing the geographic distribution of acidic species. Also,deposition of these fine particles deep into the lungs causes morbidity and mortality in humans, alterations in visibility and climate.29Henceforth,monitoring of atmospheric NH3in agricultural fields is one of the decisive parameters needs to be considered. For this the study was conducted at a rural site in Jhajjar district of Haryana with the following objectives- i). to quantify the NH3 concentration and its variation during different growing stages of crops sown in our study area and ii).to study the effect of meteorological parameters in order to identify the possible transformations of NH3.
NH3 emission rate from various agricultural activities and its downwind concentration mainly depends on meteorological conditions. There exists a positive relationship between incident solar radiation/air temperature and NH3 emission from surface-applied fertilizers.30-32 Solar radiation increases NH3emission by increasing the atmospheric turbulence and hence,NH3evaporates from the surface. Apart from that evaporation of water due to increasing air temperature increases the total N concentration at the surface. Consequently, the NH3 at the surface is transported upwards by atmospheric turbulence and sideways, by advection. Hence, NH3 emission levels are related to wind speed, relative humidity and temperature.32Higher humidity and lower temperature favours the formation of NH4+ aerosols in presence of NO2 and SO2.
Methodology
Site Description
A study was conducted at a rural site in Chhuchhakwas village of Jhajjar district in Haryana (Fig. 1). It lies between 28°22’ - 28°49’ North latitudes, and 76°18’ -76°59’ East longitudes. The village is located at a distance of 13 kms from Jhajjar district which lies in the south-east part of the Haryana state covering total geographical area of 1834 sq.km. The climate characteristics of this area are hot summer, cold winter and moderate rainfall of about 444 mm. This area comprises approximately 87.03% land under agriculture and 6.77% build up area, indicating very less development in terms of urbanization. The district covers an forest area of 41 km2, net sown area of 1670 km2 and cultivable area of 1760 km2 (Agriculture department Jhajjar). The sampling site represents a typical rural atmosphere surrounded by agricultural fields in all directions.
 |
Figure 1: Map of the Sampling Site Click here to view figure |
Meteorological Data
Temperature, relative humidity and wind data of the study region for every month (July to October) were downloaded from theworldweatheronline.com.Table 1 shows the mean values of all above mentioned meteorological parameters during the sampling period.
Table 1: Monthly Variation of Temperature, Wind Speed and Relative Humidity During the Sampling Period
|
Month |
Temperature (0C) |
Wind speed (mph) |
Relative humidity (%) |
|
July, 2017 |
37.40 |
9 |
39.46 |
|
August, 2017 |
35.83 |
7 |
52.13 |
|
September, 2017 |
35.28 |
4 |
38.06 |
|
October, 2017 |
34.86 |
3 |
32.40 |
Experimental Setup
Collection of gaseous NH3samples was performed on 6 hr basis during both daytime and night time (8am-2pm and 10pm-4am) from July to October 2017 using a sampling assembly (Fig. 2) consisting of a low volume pump operating at a flow rate of 1 LPM. Ammonia gas was absorbed in absorbing solution (20 ml of 25 mM H2SO4) in a standard impinger for 6hours.33 The aerosol samples were collected on thePTFE filters (diameter 47 mm and pore size 0.2µm) placed upstream to the impingers. Filter pack was connected to the impinger through silicon tubing. Collected gaseous NH3 samples in absorbing solution were transferred into centrifuge tubes, preserved in refrigerator and analyzedby catalyzed Indophenol-blue method. It includes photometric determination of NH3 which is based on reaction with phenol and hypochlorite producing Indophenol, intensely blue in alkaline medium which is further analysed using spectrophotometer at 630nm.The collection efficiency of impinger technique for NH3capture was estimated by using two impingers in series (Fig. 2), using the formula:
Collection efficiency = η2∗100/(η1 + η2) - 1)
where η1 and η2 are the values of optical density in impingers 1 and 2, respectively (Fig. 2)
 |
Figure 2: Flow Diagram of Sampling Assembly Click here to view figure |
Hence, collection efficiency of the NH3 capture using this method was estimated as 67%.Furthermore, certainty and reliability in data collection was maintained by rejection of daily samples if any disruption was noted or post-sampling flow rate was reduced by more than 10% of the pre-sampling flow rate.
Agriculture and Cropping Pattern
Thefarming practices in Jhajjar district are dominated by agriculture activities and animal husbandry. The main crops sown in this region are Kharif cropsand Rabi crops.The word “Kharif” is Arabic for autumn since the season coincides with the beginning of autumn, also known as monsoon crops. These are the crops that are cultivated at the onset of the monsoon season around June and harvested by September or Octobereg.Oryza Sativa (Paddy), pearl millet (bajra), gossypium (cotton), Cyamopsistetragonoloba (guar) etc. and Rabi crops are agricultural crops that are sown in winter in month of November and harvested in Marcheg. Triticum aestivum (Wheat), Brassica juncea(mustard),Hordeum Vulgare(barley), etc.
Results and Discussion
Concentration of NH3 Over the Study Period
Table 2 gives the concentration of NH3 over the various periods (growing, post-fertilizer, grain filling, post-harvest) of the kharif crop(mainly pearl millet in our study area). Growing time in the month of July shows the least NH3 concentration with an average value 29.68 µg m-3 as compared to all other time phases. These values can be assumed as background values. Nitrogen fertiliser can either be incorporated into the soil (basal dressing) before growing the crop or applied to the soil surface (top dressing). In basal dressing, nitrogen fertiliser is placed below the soil layer which limits the rates of nitrification, denitrification, volatilization and therefore, enhance efficiency of N fertilizer use.34 As Diammonium phosphate (DAP) fertilizer is mainly used in basal dressing (30 kg/hectare) prior to growing, the levels were very less as compared to the levels after top dressing (commonly urea) fertilizer application. The levels increased markedly after urea was applied on the soil surface on 1st August with an application rate~100kg/hectare. Among various fertilizers being used in India, the NH3concentrations peaked in conjunction with the application of urea. Contribution from urea is highest not only because of its excessive usage in Indian agriculture but also due to the large emission factor for NH3 emissions.35The average concentrations during day and night time were measured as 96 µg m-3and 149 µg m-3respectively.The levels of NH3 are very high during grain filling and post-harvest period.As plant uptake of soil-Ndecreases towards maturity, NH3 volatilization from soil increases. This may be responsible for higher NH3 emissiontowards maturity.For further analysis during these months,variation of NH3 was related with wind directions as described below (Fig. 7).
Table 2: Day-Night Concentration of NH3 Over Various Time Periods of the Kharif Crop (Pearl Millet in our Study Area)
|
Date |
Sampling periods |
Day time NH3 conc.(µgm-3) |
Night time NH3 conc.(µgm-3) |
|
09 July 2017 |
|
1 |
- |
|
10 July 2017 |
|
34 |
- |
|
11 July 2017 |
Sowing period |
41 |
- |
|
12 July 2017 |
|
45 |
- |
|
13 July 2017 |
|
25 |
- |
|
02 Aug 2017 |
|
115 |
163 |
|
03 Aug 2017 |
Post-fertilizer |
122 |
88 |
|
04 Aug 2017 |
addition |
84 |
190 |
|
05 Aug 2017 |
|
63 |
154 |
|
12 Sept 2017 |
|
141 |
170 |
|
13 Sept 2017 |
Grain filling |
187 |
139 |
|
14 Sept 2017 |
|
125 |
144 |
|
15 Sept 2017 |
|
98 |
121 |
|
08 Oct 2017 |
|
56 |
176 |
|
09 Oct 2017 |
Post-harvest |
104 |
234 |
|
10 Oct 2017 |
|
117 |
249 |
|
11 Oct 2017 |
|
151 |
184 |
Diurnal Variation of NH3 Over the Study Period
Fig.3 shows the diurnal variability in NH3 concentration over the study period. NH3 concentration is higher during night time as compared to the day time. Similar variation in NH3 emissions were also reported by other researchers.36 During day time NH3 concentration varied from 1 to 187µgm-3 and during night time it lies in the range 88 to 249 µgm-3. The mean concentration of NH3 for the day and night time was found to be 89 and 168µgm-3 respectively. Fig.4 shows the variation of average day and night time concentration of NH3 over the sampling months. Higher NH3 concentrations observed during night time might be due to stable atmospheric conditions (less turbulence) which resulted in reduced dispersion of gaseous NH3 in the atmosphere because of the accumulation and inefficient vertical mixing within a relative shallow boundary. This pattern is in consistent with the studies by other researchers.37-38
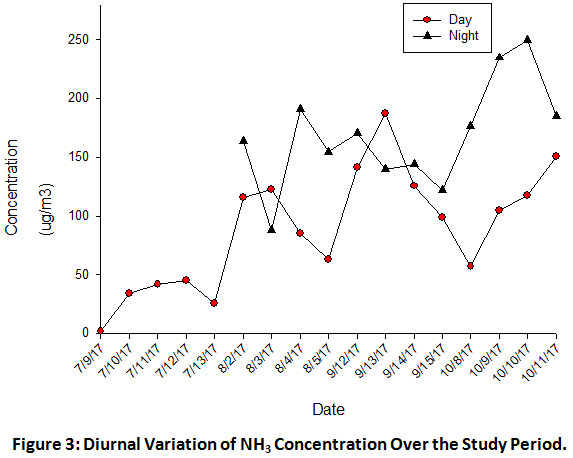 |
Figure 3: Diurnal Variation of NH3 Concentration Over the Study Period. Click here to view figure |
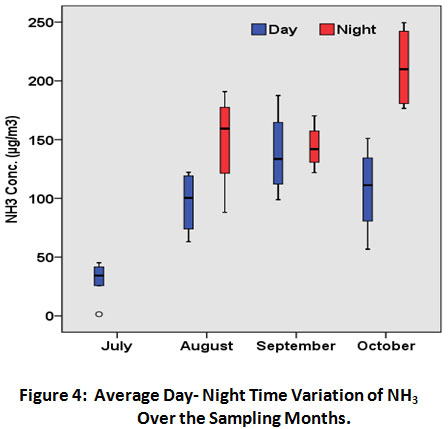 |
Figure 4: Average Day- Night Time Variation of NH3 Over the Sampling Months. Click here to view figure |
Meteorological Data
Mean temperature during the sampling periods over the month of July, August, September, October were observed to be 37.4°C, 35.83°C, 35.28°C and 34.86oC respectively whereas the average relative humidity levels were found to be 39.46%, 52.125%, 38.06% and 32.40% respectively.The prevailing wind speed and directions were mostly in the range 2–7 mphwith distinct patterns in W, E, NW and ESE directions.
Variation of NH3 with temperature and relative humidity is as represented in Fig. 5. There was no significant correlation observed betweenNH3 concentration with temperature and relative humidity in our catchment (Fig. 6). Levels of NH3 are negatively correlated with temperature and relative humidity during daytime. In contrast, NH3 concentration are positively correlated with temperature & negatively with relative humidity during night time.The relation can be explained on the fact that high temperature and low relative humidity conditionsfavours the formation of NH3 from NH4+. The reason being, in summer, particulate ammonium nitrate is volatile, and hence, NH4NO3 will be in gaseous phase.39
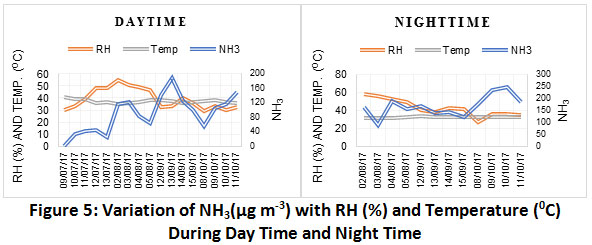 |
Figure 5: Variation of NH3(µg m-3) with RH (%) and Temperature (0C) During Day Time and Night Time. Click here to view figure |
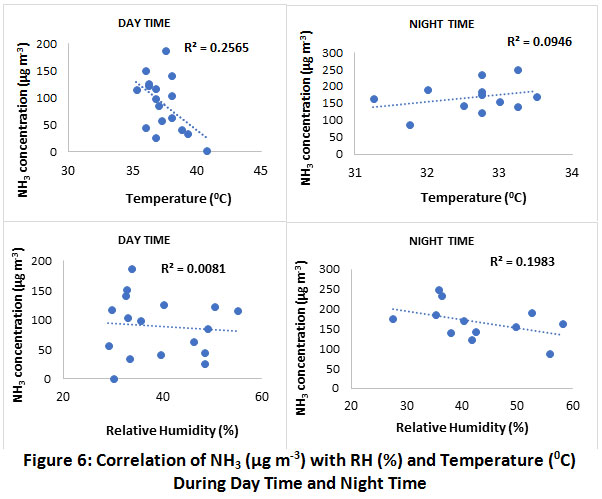 |
Figure 6: Correlation of NH3 (µg m-3) with RH (%) and Temperature (0C) During Day Time and Night Time. Click here to view figure |
Possible Sources of NH3
Since, NH3is either subjected to dry deposition or readily converted to NH4+. Therefore, high levels of gaseous NH3 are expected close to the surface and at less distance from the emission sources.40-41 Hence, there might be some local emission sources near the observation site. Wind rose plots suggested higher concentration from the west direction of the sampling site in the month of July and August (Fig.7). Application of large amount of inorganic nitrogen fertilizers in the nearby agricultural fields might be contributing to ambient NH3 concentration in these sampling months. Several researchers from various parts of the world also reported similar observations.42-43During the grain filling period, in the month of September, the levels of ammonia were considerably high, and the prevailing wind direction was mainly northwest (Fig.7c). As this village is in the northwest direction of the sampling site, livestock population, solid waste generation might be contributing towards these high NH3 levels. In addition, winds were very diverse majorly from E and ESE direction during post harvest period in October. In addition to biomass burning, there may be various sources like animal waste, solid waste, etc. from nearby areas.
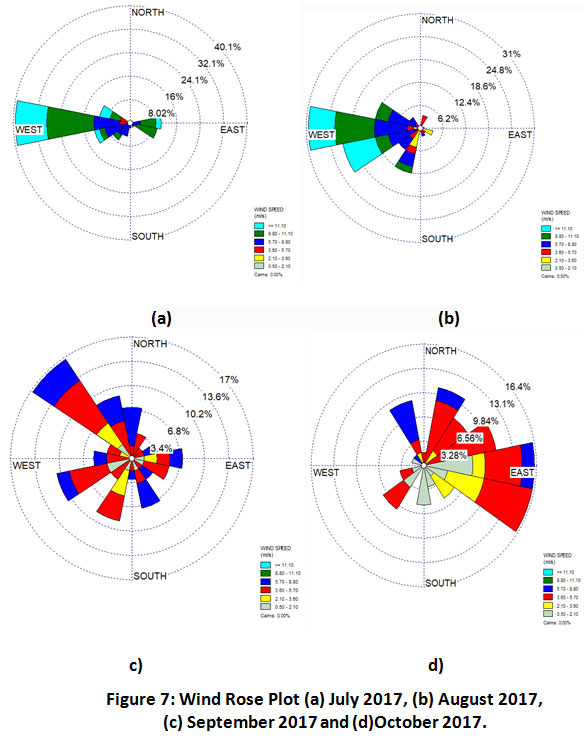 |
Figure 7: Wind Rose Plot (a) July 2017, (b) August 2017, (c) September 2017 and (d)October 2017. Click here to view figure |
It is observed that the NH3 concentration during day & night time on 8 October, 2017 was 56µg m-3& 176 µg m-3 (Table 3). Wind rose diagrams were plotted to understand the significant gap between the diurnal values on this particular day (Fig.8). It can be inferred that there were only minor changes in wind directions during day and night time. Hence, the high NH3 levels starting from night time (8 October, 2017) can be attributed to the onset of biomass burning during post harvest period. However, to rule out any other possibility further investigation is required.
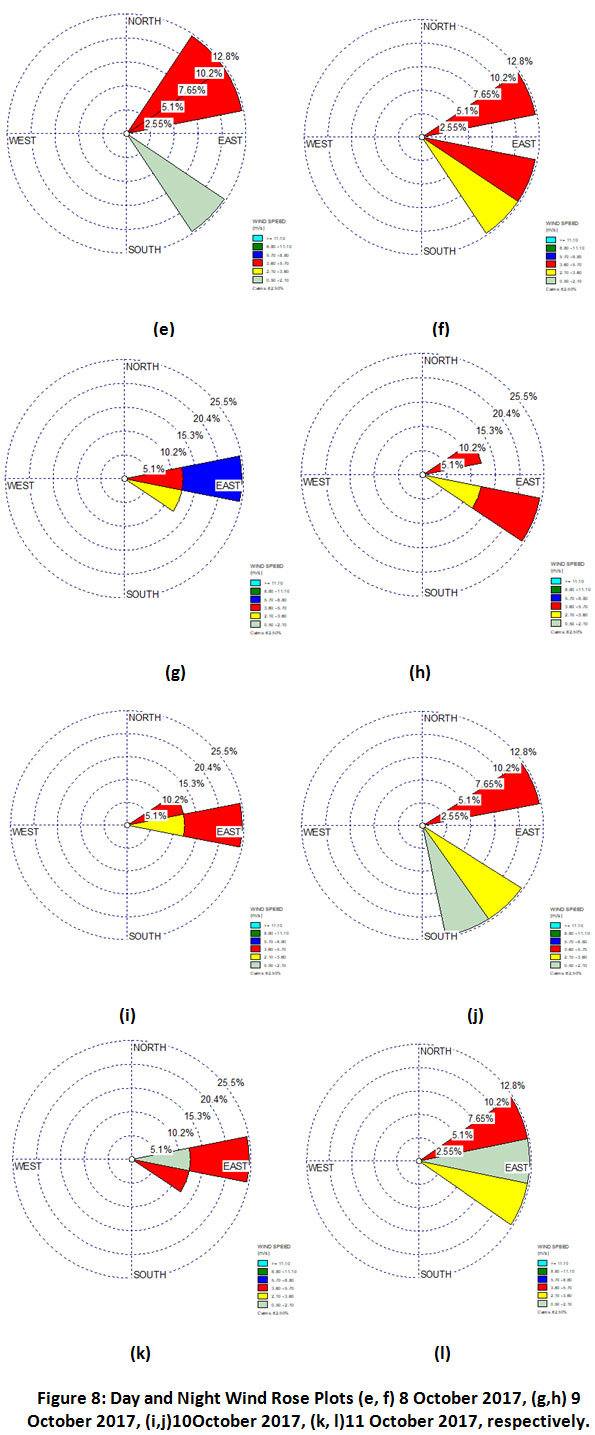 |
Figure 8: Day and Night Wind Rose Plots (e, f) 8 October 2017, (g,h) 9 October 2017, (i,j)10October 2017, (k, l)11 October 2017, respectively. |
Table 3: Comparison of Ambient NH3 Concentrations at Various Characteristic Sites Worldwide
|
Site |
Background |
Period |
NH3 (µg m-3) |
Reference |
|
North Carolina (USA) |
Agricultural |
July-September 2004 |
11.1 |
Wilson and Serre44 |
|
Dongbeiwang (China) |
Suburban-agricultural |
|
9.5 |
Shen et al. 45 |
|
Beijing (China) |
Urban |
August 2007 |
24.3 |
Lanniello et al. 46 |
|
Dhangadi (Nepal) |
Regional |
September 1999-June 2001 |
14.6 |
Carmichael et al. 47 |
|
Agra (India) |
Urban |
July-September |
10.8 |
Parmar et al. 48 |
|
Okhla, New Delhi (India) |
Urban industrial |
October 2012 -September 2013 |
40.7 |
Singh and Kulshrestha14 |
|
Mai, U.P (India) |
Rural-agricultural |
October 2012 -September 2013 |
50.5 |
Singh and Kulshrestha14 |
|
Chhuchhakwas, Haryana (India) |
Rural-agricultural |
July 2017 Aug 2017 Sept 2017 Oct 2017 |
29.7 122.9 141.2 159.5 |
Present study |
Comparison of Concentrations of Gaseous NH3 Withother Studies
Generally, levels of atmospheric NH3 are high in tropical regions as compared to temperate regions. This is probably due to high temperature in tropical regions resulting in higher evaporation rates of gaseous NH3 from agricultural soils, animal waste and other sources.In addition, abundance of alkaline dust in tropics favours the existence of alkaline NH3 in its gaseous form. In contrast,dominance of H2SO4 in acidified atmosphere in most of the temperate areas results in the formation of NH4+ and SO42- aerosols.38Table 4 gives a comparison of NH3concentrations at various sites worldwide.
Conclusion
Average NH3 level in the growing period,when DAP was incorporated into the soil was very less i.e. 29.68µgm-3. This is because addition into the soil increases the efficiency of fertilizer use. The concentration reached to considerably high levels, 96.53µgm-3 and 149.40µgm-3 during day and night time respectively, after addition of N-fertilizer (urea) on the soil surface. Wind direction indicated nearby agricultural fields to be the main source of these high levels. Average NH3concentration during day and night time were observed to be 138.41µg m-3 and 144.01µg m-3 respectively prior to crop harvesting. Such high levels might be due to the contribution from livestock, sewage, etc. as the winds were predominantly from North-west (village) direction during this sampling period. Ambient NH3concentration reached its maxima at night and minima during midday.
The study suggested that in order to reduce anthropogenic forcing of N cycle globally, there is need to address the inefficiency of N fertilization. In addition, there is a need to examine the formation of ammonium aerosols in the air around the agricultural areas in a comprehensive manner in order to address the health and climate issues related to ammonium aerosols.
Acknowledgement
Our sincere thanks to the University Grants Commission (UGC) for awarding the fellowship to Sudesh. We thank the Department of Science and Technology (DST) for extending their financial support through DST-PURSE programme. This work has been a part of DRSNet-India network.
References
- Galloway, J. N., Dentener, F. J., Capone, D. G., Boyer, E. W., Howarth, R. W., Seitzinger, S. P., ... & Karl, D. M. Nitrogen cycles: past, present, and future. Biogeochemistry. 2004;70(2):153-226.
CrossRef - Phoenix, G. K., Hicks, W. K., Cinderby, S., Kuylenstierna, J. C., Stock, W. D., Dentener, F. J., ... & Ashmore, M. R. Atmospheric nitrogen deposition in world biodiversity hotspots: the need for a greater global perspective in assessing N deposition impacts. Global Change Biology. 2006; 12(3): 470-476.
CrossRef - Hertel, O., Skjoth, C. A., Reis, S., Bleeker, A., Harrison, R. M., Cape, J. N., ... &Kulmala, M. Governing processes for reactive nitrogen compounds in the European atmosphere. Biogeosciences. 2012; 9:4921–54.
CrossRef - Sutton, M. A., Dragosits, U., Tang, Y. S., & Fowler, D. Ammonia emissions from non-agricultural sources in the UK. Atmospheric Environment. 2000; 34(6):855-869.
CrossRef - Bouwman, A. F., Lee, D. S., Asman, W. A. H., Dentener, F. J., Van Der Hoek, K. W., & Olivier, J. G. J. A global highâ€resolution emission inventory for ammonia. Global biogeochemical cycles. 1997; 11(4):561-587.
CrossRef - Lee, S., Baumann, K., Schauer, J. J., Sheesley, R. J., Naeher, L. P., Meinardi, S., ... & Clements, M. Gaseous and particulate emissions from prescribed burning in Georgia. Environmental science & technology. 2005; 39(23):9049-9056.
CrossRef - Mishra, M., Kulshrestha, U.C. Extreme air pollution events spiking ionic levels at urban and rural sites of Indo-Gangetic plain. Aerosol and Air Quality Research. 2020; 20:1266-1281.
CrossRef - Misselbrook, T. H., Van Der Weerden, T. J., Pain, B. F., Jarvis, S. C., Chambers, B. J., Smith, K. A., Phillips, V.R&Demmers, T. G. M. Ammonia emission factors for UK agriculture. Atmospheric environment. 2000; 34(6): 871-880.
CrossRef - Vitousek, P. M., Aber, J. D., Howarth, R. W., Likens, G. E., Matson, P. A., Schindler, D. W., Schlesinger, W.H. & Tilman, D. G. Human alteration of the global nitrogen cycle: sources and consequences. Ecological applications. 1997; 7(3):737-750.
CrossRef - Galloway, J. N., & Cowling, E. B. Reactive nitrogen and the world: 200 years of change. AMBIO: A Journal of the Human Environment. 2002; 31(2): 64-71.
CrossRef - Smil, V. Nitrogen in crop production: An account of global flows. Global biogeochemical cycles. 1999; 13(2): 647-662.
CrossRef - Aneja, V. P., Schlesinger, W. H., Erisman, J. W., Behera, S. N., Sharma, M., &Battye, W. Reactive nitrogen emissions from crop and livestock farming in India. Atmospheric environment. 2012; 47:92-103.
CrossRef - Schwab, G. J., & Murdock, L. W. Nitrogen transformation inhibitors and controlled release urea. Extension Report. Lexington, KY: University of Kentucky College of Agriculture. 2005.
- Singh, S.,Kulshrestha, U.C. Rural versus urban gaseous inorganic reactive nitrogen in the Indo-Gangetic plains (IGP) of India. Environmental Research Letters. 2014; 9(12):125004.
CrossRef - Bouwman, A. F., Boumans, L. J. M., &Batjes, N. H. Estimation of global NH3 volatilization loss from synthetic fertilizers and animal manure applied to arable lands and grasslands. Global Biogeochemical Cycles. 2002; 16(2):8-1.
CrossRef - Grunditz, C., &Dalhammar, G. Development of nitrification inhibition assays using pure cultures of Nitrosomonas and Nitrobacter. Water research. 2001; 35(2):433-440.
CrossRef - Van Egmond, K., Bresser, T., &Bouwman, L. The European nitrogen case. AMBIO: A Journal of the Human Environment. 2002; 31(2):72-78.
CrossRef - Zhao, D. W., & Wang, A. P. (1994). Estimation of anthropogenic ammonia emissions in Asia. Atmospheric Environment, 28, 689–694. https://doi.org/10.1016/1352-2310(94)90045-0.
CrossRef - Beusen, A. H. W., Bouwman, A. F., Heuberger, P. S. C., Van Drecht, G., & Van Der Hoek, K. W. (2008). Bottom-up uncertainty estimates of global ammonia emissions from global agricultural production systems. Atmospheric Environment, 42(24), 6067-6077.
CrossRef - Parashar, D. C., Kulshrestha, U. C., & Sharma, C. (1998). Anthropogenic emissions of NO x, NH 3 and N 2 O in India. Nutrient cycling in agroecosystems, 52(2-3), 255-259.
CrossRef - Yang, R., Hayashi, K., Zhu, B., Li, F., & Yan, X. (2010). Atmospheric NH3 and NO2 concentration and nitrogen deposition in an agricultural catchment of Eastern China. Science of the Total Environment, 408(20), 4624-4632.
CrossRef - Aneja, V.P., Schlesinger, W.H., Knighton, R., Jennings, G., Niyogi, D., Gillam, W., Duke, C. Proc. Of the workshop on agricultural air quality: State of Science; Potomac, MD, North Carolina state University, Releigh, NC. 2006.
- Xu, R. T., Pan, S. F., Chen, J., Chen, G. S., Yang, J., Dangal, S. R. S., ... & Tian, H. Q. (2018). Halfâ€century ammonia emissions from agricultural systems in Southern Asia: Magnitude, spatiotemporal patterns, and implications for human health. GeoHealth, 2(1), 40-53.
CrossRef - Naseem, M., &Kulshrestha, U. C. (2017). An Overview of Atmospheric Reactive Nitrogen Research: South Asian Perspective. Current World Environment, 14(1), 10.
CrossRef - Vet R., Artz R. S., Carou S., Shaw M., Ro C.U., Aas W. & Hou A. A global assessmentof precipitation chemistry and deposition ofsulfur, nitrogen, sea salt, base cations, organicacids, acidity and pH, and phosphorus.Atmospheric Environment. 2014;93:3-100.
CrossRef - Bouwman, A. F., Van Vuuren, D. P., Derwent, R. G., &Posch, M. A global analysis of acidification and eutrophication of terrestrial ecosystems. Water, Air, and Soil Pollution. 2002; 141(1-4):349-382.
CrossRef - Bouwman, A. F., Lee, D. S., Asman, W. A. H., Dentener, F. J., Van Der Hoek, K. W., & Olivier, J. G. J. A global highâ€resolution emission inventory for ammonia. Global biogeochemical cycles. 1997; 11(4):561-587.
CrossRef - Aneja, V. P., Chauhan, J. P., & Walker, J. T. Characterization of atmospheric ammonia emissions from swine waste storage and treatment lagoons. Journal of Geophysical Research: Atmospheres. 2000; 105(D9):11535-11545.
CrossRef - Asman, W. A., & van Jaarsveld, H. A. A variable-resolution transport model applied for NHχ in Europe. Atmospheric Environment. Part A. General Topics. 1992; 26(3): 445-464.
CrossRef - Sommer, S. G., Olesen, J. E., & Christensen, B. T. Effects of temperature, wind speed and air humidity on ammonia volatilization from surface applied cattle slurry. The Journal of Agricultural Science. 1991; 117(1):91-100.
CrossRef - Braschkat, J., Mannheim, T., &Marschner, H. Estimation of ammonia losses after application of liquid cattle manure on grassland. ZeitschriftfürPflanzenernährung und Bodenkunde. 1997; 160(2):117-123.
CrossRef - Sommer, S. G., Friis, E., Bach, A., &Schjørring, J. K. Ammonia volatilization from pig slurry applied with trail hoses or broadspread to winter wheat: effects of crop developmental stage, microclimate, and leaf ammonia absorption. Journal of Environmental Quality. 1997; 26(4):1153-1160.
CrossRef - Tiwari, R., Kulshrestha, U. Wintertime distribution and atmospheric interactions of reactive nitrogenspecies along the urban transect of Delhi – NCR. Atmospheric Environment. 2019; 209: 40-53.
CrossRef - Linquist, B. A., Hill, J. E., Mutters, R. G., Greer, C. A., Hartley, C., Ruark, M. D., & Van Kessel, C. Assessing the necessity of surface-applied preplant nitrogen fertilizer in rice systems. Agronomy Journal. 2009; 101(4):906-915.
CrossRef - Sharma, C., Tiwari, M. K., & Pathak, H. Estimates of emission and deposition of reactive nitrogenous species for India. Current Science. 2008; 1439-1446.
- Walker, J.T., Whitall, D.R., Robarge, W., &Paerl, H.W.Ambient ammonia and ammonium aerosol across a region ofvariable ammonia emission density. Atmospheric Environment. 2004; 38: 1235–1246.
CrossRef - Burkhardt, J., Sutton, M. A., Milford, C., Storeton-West, R. L., & Fowler, D. Ammonia concentrations at a site in southern Scotland from 2 yr of continuous measurements. Atmospheric Environment. 1998; 32(3):325-331.
CrossRef - Singh, S., Kulshrestha, U. C. Abundance and distribution of gaseous ammonia and particulate ammonium at Delhi, India. Biogeosciences. 2012; 9(12):5023-5029.
CrossRef - Seinfeld, J.H., Pandis, S.N.Atmospheric Chemistry and Physics. Wiley-Interscience, New York. 1998.
- Ferm, M. Atmospheric ammonia and ammonium transport in Europe and critical loads: a review. Nutrient Cycling in Agroecosystems. 1998; 51(1):5-17.
CrossRef - Lee, S., Baumann, K., Schauer, J. J., Sheesley, R. J., Naeher, L. P., Meinardi, S., Blake, D.R., Edgerton, E.S., Russell, A.G. and Clements, M. Gaseous and particulate emissions from prescribed burning in Georgia. Environmental science & technology. 2005; 39(23):9049-9056.
CrossRef - Sakurai, T., Fujita, S. I., Hayami, H., &Furuhashi, N. A case study of high ammonia concentration in the nighttime by means of modeling analysis in the Kanto region of Japan. Atmospheric Environment. 2003; 37(31):4461-4465.
CrossRef - Whitehead, J. D., Longley, I. D., & Gallagher, M. W. Seasonal and diurnal variation in atmospheric ammonia in an urban environment measured using a quantum cascade laser absorption spectrometer. Water, air, and soil pollution. 2007;183:317-329.
CrossRef - Wilson, S. M., & Serre, M. L. Use of passive samplers to measure atmospheric ammonia levels in a high-density industrial hog farm area of eastern North Carolina. Atmospheric Environment. 2007; 41(28):6074-6086.
CrossRef - Shen, J. L., Tang, A. H., Liu, X. J., Fangmeier, A., Goulding, K. T. W., & Zhang, F. S. High concentrations and dry deposition of reactive nitrogen species at two sites in the North China Plain. Environmental Pollution. 2009; 157(11):3106-3113.
CrossRef - Ianniello, A., Spataro, F., Esposito, G., Allegrini, I., Rantica, E., Ancora, M. P., Hu, M., & Zhu, T. Occurrence of gas phase ammonia in the area of Beijing (China). Atmospheric Chemistry and Physics. 2010; 10(19):9487-9503.
CrossRef - Carmichael, G. R., Ferm, M., Thongboonchoo, N., Woo, J. H., Chan, L. Y., Murano, K.,Viet, P.H., Mossberg, C., Bala, R., Boonjawat, J., &Upatum, P. Measurements of sulfur dioxide, ozone and ammonia concentrations in Asia, Africa, and South America using passive samplers. Atmospheric Environment. 2003; 37(9-10):1293-1308.
CrossRef - Parmar, R. S., Satsangi, G. S., Lakhani, A., Srivastava, S. S., & Prakash, S. Simultaneous measurements of ammonia and nitric acid in ambient air at Agra (27 10′ N and 78 05′ E)(India). Atmospheric Environment. 2001; 35(34):5979-5988.
CrossRef


