Review on Conservation of Water by Water Audit
Sanjay Choudhary
*
 , Devendra Dohare
and Shruti Bajpai
, Devendra Dohare
and Shruti Bajpai
http://dx.doi.org/10.12944/CWE.16.3.4
Copy the following to cite this article:
Choudhary S, Dohare D, Bajpai S. Review on Conservation of Water by Water Audit. Curr World Environ 2021;16(3). DOI:http://dx.doi.org/10.12944/CWE.16.3.4
Copy the following to cite this URL:
Choudhary S, Dohare D, Bajpai S. Review on Conservation of Water by Water Audit. Curr World Environ 2021;16(3). Available From:
Download article (pdf)
Citation Manager
Publish History

Introduction
Population growth and people's rising living conditions are driving up demand for premium industrial goods at a tremendous rate.1 Water is the survival of creatures, not just humans, and moreover plants and animals. Ancient people began to live on the river bank, for any human being wants water from birth until death. People will survive for many weeks without eating, although not without water.2 Earth can consists of 70 percent of water, of this 70 percent, in the glaciers, ice and ground-water, only 3 percent of fresh water is contained. Suppose, whole water is equivalent to 5 liter of water vessel, only a teaspoon of water is available for fresh water.3 Just 0.26% of the Earth's overall volume of fresh water is contained in dams, lake and river.4 According to water aid report 2012, almost 88.4 crore individuals do not have access to clean drinking water.5 For example- India receives an average rainfall of 4 trillion m3 per year, while the total annual water supply available is 1.123 trillion m3 per year only, which is distributed unequally with differences occurring from 1090 cm in Meghalaya to 10 cm in Rajasthan.6 Since from wake up each morning, need water for brushing, making food, faucets, irrigating gardens, drinking etc.2 As people do not use water conservatively, some regions face lack of water. Some efforts are taken for the conservative use of water.7 Much water is being diverted by certain unregulated ways. Inadequate water allocation, poor utilization, and a lack of sufficient and sustainable water supplies are all contributing to this problem.
Water loss has a huge influence. The cost of water waste is significant from an economical perspective.21 The yearly water loss quantity in the globe is significant; it is predicted to be 126 billion m3, costing over 3900 crore dollars each year.42 Providing clean water while saving water resources is a tough undertaking since a large amount of the water provided does not get to it is targeted consumers but is deficit or stolen from distribution systems along the route.18, 35 Loss of water is seen as a worldwide problem with substantial implications for water management that necessitates a well-thought-out management plan based on a deeper knowledge of the causes of water loss and the elements that impact it.43 Due to the proper management of uses of water used a tool which is known as Water-Audit. Water audit is one of the most effective methods for keeping track of how much water is used and conserving it.2 This methodology is used to check the operational efficiency and degree of maintenance of waterworks such as irrigation, industry, hydropower, household water supply, thermal power, and others. Objective of study, to permit water distribution network to measure the non-revenue water with grow assurance and determine tasks that can be apply to decrease parts of non-revenue water, in economy point of view.13
Water-Audit
Banks prepare statements of debits and credits for their customers as well as provide a report of money going into and out of accounts, just like any other business. The water audit shows how much water is flowing into and out of the distribution system, as well as how much water flows to the consumer. The International Water Association (IWA)/American Water Work Association (AWWA) has undertaken a large-scale initiative to mitigate the above listed issue with the aid of auditing.9 In other words, water deficit is the difference between total output and total consumption.10 Auditing of water is a comprehensive and scientific study of project water records. It includes auditing of the domestic sector, industrial sector, agriculture sector and other sectors in which water is used.
Advantages of Water-Audit
- It provides judgment methods for utility administrators, directors and operators.
- It helps managers to reduce water system losses efficiently.
- It reduces the wastages of chemicals and power consumption.
- It decreases the maintenance cost.
- Aware the water users about the use of water.
Literature Review
The Government of Maharashtra had initiated “Sujal Nirmal Abhiyan” project under which many ULB participated. Shrivardhan Municipal Council also participated in various work fields of water supply like Water Audit, Energy Audit, providing and Installing Flow Meter. Data gathered from field measurements in 38 Maharashtra towns. Authorized consumption (revenue water) is 1.572 million liters per day (MLD) (54%) and water losses (apparent losses and real losses) is 1.357 MLD (46%). 15% losses in transmission are also considered. So, immediate and long-term improvement is needed in system components like head work, raw water gravity main from intake to Arethi sump and pump house and others.6
Probably, the water network is developing in response to the rising need of the community it represents. Surface water will be exploited first. Leakages should be reduced from the water distribution system. PALM (Pump and Leakage Management) project is targeted to decrease leakage from every water distribution network. A noise is caused by a leak in a pressurized system, the operating principle of acoustic instrument which show the location of leakage. Hydraulic modeling also used for leak detection from water distribution system, in this method does not required any transducer, portable flow meter and other instrument, only monitor pressure reduction in distribution system.10
Avoid water wastage, electricity usage and conveniently prevent water for our future generation by using a water monitoring system. By using a tank water level monitoring system to stop the overflow of water, water pollution monitoring system is used to detect the pollution in water and leak detection monitoring is used to find the location of leak in the distribution system. In water level monitoring, LED, sensors and microcontroller. In water pollution monitoring, pH, turbidity and temperature are monitored. An acoustic leak detector is employed in a leak detection system; when a leak is discovered, an ultrasonic signal is generated, which is signalled by an increment in the LED metre and a rushing sound in the headset. By using wireless sensor networks, the concept of smart offices/homes is completed.8
Vignan’s Foundation for Science Technology & Research (VFSTR) is located in Vadlamudi, Andhra Pradesh. For water audit, components included are girl’s hostel, boy’s hostel, garden and mess. Water supply for girls hostel is .164 MLD and for boy’s hostel is .216 MLD. The average per capita water consumption by girls and boys are 123.63 liter per capita per day (lpcd) and 130.78 lpcd respectively excluding cooking, washing, clothes and utensils which was greater than standard. Water consumption by mess and garden of boys and girls hostel are .0085 MLD and .012 MLD. .0133 MLD of water lost due to the leakage in girl’s hostel and no leak is detected in boy’s hostel. If every vignanites in the hostel thinks to save water each boy can save 58 L of water per day and each girl can save water of 47L / day.11
Quality and quantity of water sources of European Union (EU) territory are in good condition. This conference mainly focused on water and energy efficiency of the system. Areas was selected for study are Larisa (DEYAL), Greece; Kozani (DEYAK), Greece; Korce, Albania; Water Board of Nicosia (WBN), Cyprus; Blagoevgrad, Bulgaria and other two areas of water utility are Prilep and North Macedonia.12
Proposed Methodology
In India, an environmental audit is being carried out in three stages: 14
- Pre Audit process-
- Selection and creation of a team that is familiar with procedure and
- environmental elements and
- Establishment of a plan for auditing.
- Field Process-
- Sampling and monitoring,
- Paperwork including all observations and
- Meetings with staff from the field and
- Post Audit process-
- Preparation of an interim report for an environmental audit and
- Planning of an execution plan to implement the measures proposed.
In water auditing, taken the similar procedure mentioned in the above environmental audit. But today the water balance sheet is also included for water auditing to make calculation easy. The typical water balance or procedure is the structure in the water audit for the categorization and quantification of all water uses.9 There was no universal language for water losses elements and quantification until the early 1990s.15 The International Water Association (IWA) and some other institutions have developed instruments and techniques over the last 20 years to help utilities better measure and handle water losses.15, 16 The International Water Association has established an international normative water balance with simple meanings through its Water Depletion Task Force.17, 18 It may also be viewed as individual equations or in a worksheet format. Start reading from the left side of the graphical standard water balance (Table 1), beginning with the device Input group.9
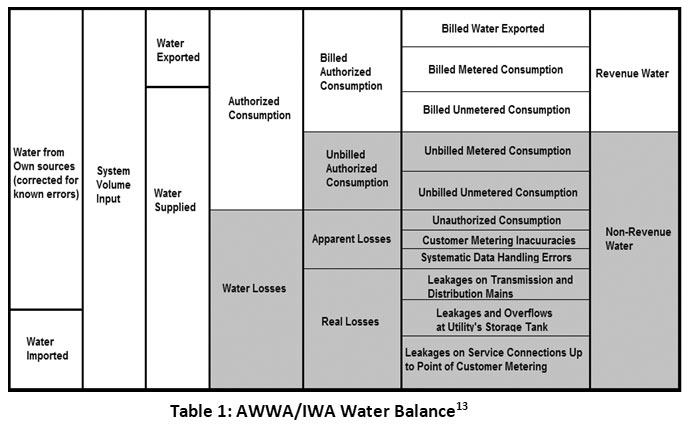 |
Table 1: AWWA/IWA Water Balance13 Click here to view Table |
Water balance is determined through observations or estimates- a) water produced b) water exporting and importing c) consumes water d) lost water.31
Terms used in Water Balance
Water From Own Sources
The amount of water extracted from the water utility's regulated water resources (rivers, lakes, wells, etc.) and then processed for potable water distribution.19
Water Import
It is also known as import or purchased or wholesale. Bulk water is often obtained from a nearby water company or regional water authority and metered at the point of interconnection between the two utilities.19
System Input Volume
The cumulative water supplied to the facility for water delivery. It is the number of all output meter readings from all suppliers for the audit’s year. The determination of System Input is the first stage in finishing the conventional water balance. Various sources might be included in this category. Multiple wells, lakes, or surface water intakes may be owned by a system. Metering at the source determines the quantity of water input in to balance. These meters are commonly referred to as master meters. A number of procedures can be used to test the master meters’ reliability. Water running through the meter into a vessel of fixed volume for a specified period of time is the most basic sort of test and another method is install a standard benchmark meter adjacent the master metre.32
Water Supplied = System Input Volume – Water Exported19
Water Exported
Bulk water is supplied to adjacent water systems that are located outside of the service region.19
Authorized Consumption
Water use in domestic and industrial use, firefighting, municipal fountains, golf courses, urban landscape watering, pipe flushing, city offices, water treatment plant use, dust control, and building activities are all forms of permitted consumption.
Authorized Consumption = Billed Authorized Consumption - Unbilled Authorized Consumption19
- Billed Metered- Water that is metered and paid for in accordance with the meter.
- Billed Unmetered- Projected water sales but not metered like dust management trucks and company forms that use approved water collected through fire hydrants or other non-metered applications.
- Unbilled Metered- Water assessed but not paid, such as city/government offices, watering of public parks, use of water treatment plants, certain use of fire stations, and drain flushing.
- Unbilled Unmetered- Estimated water, just like most line flushing that is not paid or metered.
Revenue Water
These really are generally the key categories from which revenue can be generated by the service. It consists of exported and billed metered and unmetered water from billed wholesale water.
Non-revenue Water (NRW)
This term is the amount of apparent loss, actual loss, and permitted consumption that is unbilled. Water which enters the distribution network but it does not generate money for the utility is referred to as non-revenue water.31
NRW = System Input Volume – Billed Authorized Consumption21,30
Water Losses
The worldwide mean water loss level is 35% of the water generated, which accounts for 0.0486 trillion m3 per year.20 Water Losses classified into two types-
Water Losses = Water Supplied – Authorized Consumption19
- Apparent Losses- Errors in water flow estimation, accounting errors, and improper utilization all lead to this water.9,27 Water is delivered to an end consumer, including illicit use, but this is not adequately quantified or reported in this category.32 Apparent losses are often referred to as "paper losses" because it consist of water not sufficiently reported on paper9. It is oftentimes generally more expensive than actual losses.29
Most developing countries' water firms impose minimal or flat-rate charges, water prices that are subsidized by the government, or supply water for free. Customers (both house and non-household) frequently vandalize or bypass meters to avoid paying, especially on low prices. Mounting a certified 'check' meter downstream of the meter under test can ensure meter reliability.34
- Real Losses- It is also known as “physical losses”. Mostly infrastructure leakage: mains, valves, distribution network, and reservoir overflow. . Physical losses occurs due leakages and pipe bursts in water delivery systems cause near 1/3rd of total abstracted water for urban uses to be lost.25, 26 Leaks in the transmission, distribution, and branch lines, as well as water tank overflows, are all too responsible.29 Many factors affect it, including soil properties, pipe material specifications, closeness to electrical currents, pressure regime, and so forth. Other important elements that might affect performance of the system and lead to huge real losses include: supply continuity, mains length, number of service connections, customer meter placement on service connections, and normal operating pressure.33 It's crucial to keep meticulous records on leak spots, repairs, and losses.32
ILI (Infrastructure Leakage Index)- It is the proportion of CARL (Current Annual Real Losses) to UARL (Unavoidable Annual Real Losses).31, 35, 36, 37 Allan Lambert noticed the need for a real-losses performance measure in 1997, that would allow international comparisons of systems with widely disparate features.31, 32 Despite the fact that a well-managed system can get an ILI of 1 (CARL=UARL).31 CARL (liters/day) is occurred due to the real losses in network.
UARL (liters/day) = (18 x Lm + 0.8 x Nc + 25 x Lp) x P 31, 33, 36, 39
Here, Lm = Length of mains (km), Nc =number of service connections, Lp =the the total length of underground pipe between the curb and the consumer's meter (km) and P = the network's average operating pressure (m)
The whole network can be covered, from starting point to user. So, the whole network split up into 2 networks – Supply network and Demand network. Supply network comprises source works, untreated water conveyance, treatment plants, treated water conveyance, sumps, Master Balancing Reservoirs (MBRs) and Elevated Service Reservoirs (ESRs) and Demand network comprises as compared to the supply side, distribution system, connections, metering, and other activities are more time consuming. When water supply is operated with a number of reservoirs, it is split into a series of District Metered Area (DMAs) based on the number of reservoirs and pipeline network structure.6 DMAs are a creative design and management technology that makes water delivery systems operate more efficiently.22 The most efficient method for reducing the period of unreported leaks is a continuously monitored DMA. Observing nighttime flows allows for the early detection of unreported leaks and gives the information needed to make the best use of leak-locating efforts. Water Flow should be measured with help of water meter like mechanical, electromagnetic and ultrasonic meters.23 if there is no water meter so flow rate measure with help of vessel and stop-watch.24
Result and Discussions
This section contains the results and discussions of the literature review written above-
In this article, population of the towns of Maharashtra covered ranges from 5760 to 138546 people (Gondia). The net water supply to the municipalities covered ranges from 0.42 MLD (Panhala) to 31.98 MLD (Panhala) (Satara). The net LPCD rate of water delivery to the towns covered in this data ranges from 15 LPCD (Sailu, where the source is insufficient and an augmentation plan is used) to 269 LPCD (Satara, where the source was strong and 25% of the water was available from gravity). The proportion of unbilled authorized consumption (mainly stand post supply) as perexisting water supply to the towns covered ranges from 0% (for 9 towns often in the Nagpur region, where 100% stand posts are transformed into group connections) to 8.55 % (for Sailu, where the LPCD rate is low because people are hesitant to pay water charges on a flat rate basis). Unbilled unauthorised consumption is nil or minor in 9 towns and exceeds 10% in the Marathawada area, where the system is poorly controlled. The amount of reservoir and distribution system losses was within an acceptable range, i.e. 15%, that can be brought to 10% only in 5 towns, between 15% and 30% in 13 towns, and beyond 30% in the remaining 20 towns.6 The Maharashtra Sujal Nirmal Abhiyan concept is based on a scientific strategy to reform work and can thus be replicated in other Indian states. Huge investments are required to reduce losses in water works, particularly in the transmission and distribution networks, and it is also important to consider the value of valuable and scarce water sources, as well as the cost of pumping and transportation that goes to waste.
There were two pumps in the girls' hostel. The total amount of water pumped each year is 157.6 ML. On average, Vignan's girl and boy consume 123.6 L and 130.78 L of water each day, excluding cooking, washing clothes, and utensils. Girls and boys consumed 3,62,95,414.2 l of water per year and 7,00,51,150 l of water per year, respectively. The noteworthy statistic is that the majority of the girl’s water is used for bathroom (55%) and face wash (6%), which is twice the amount used for drinking (3%), for bathing (34%) and for brushing (2%) and the majority of the boy’s water is used for bathroom (58%) and face wash (5%), which is twice the amount used for drinking (3%), for bathing (32%) and brushing (2%). CPHEEO's standard water requirement was 135 L/day. The average per capita water requirement of girls and boys was 123.6 l/day and 130.78 L/day respectively excluding cooking washing clothes and utensils. This demonstrates that both girls and boys consumed more water than was required by law.11 Because the institution has a huge roof top, rain water harvesting structures can save a lot of water. Use the water from water purifiers and air conditioners for gardening, since the water from the air conditioners and water purifiers in hostels is just dumped on the ground. Irrigation throughout the day should be avoided as much as possible.
In this research, water losses each connection varies from 72.17m3/connection/year in Korce to 1,254.78m3/connection/year in Kozani, according to the research. Water losses per kilometre of mains vary from 7.63m3/km/year in Korce to 83.36m3/km/year in Kozani. Real losses per connection range from 132.64 liters/connection/day in Larissa to 3,130.55 l/connection/day in Kozani, and real losses per mains length from 4.614.04 l/km/day in Larissa to 75,912 l/km/day in Kozani. In Larissa, the ILI is 2.14, but in Korce, it is 16.2. Non-Revenue Water as a percentage of SIV ranges from 26.98% in Korce to 60.47% in Blagoevgrad. As a proportion of SIV, real losses range from 11.42 percent in Larissa to 52.7 % in Kozani, while apparent losses range from 2.5 percent in WBN to 10.08 % in Blagoevgrad. As a percentage of NRW, real losses range from 42.22 percent in Larissa to 92.94 percent in WBN, while apparent losses range from 7.06 percent in WBN to 36.07 percent in Larissa.12 NRW levels are nearly always high, according to the findings. The main issue in Korce and Kozani is the high degree of real losses. Real losses account for the majority of NRW in the WBN area as well. The level of apparent losses is the most serious issue in Larissa's pilot area.
Conclusions
Water supply and distribution system losses, which can sometimes reach 50 percent of total output, are a significant contributor. The holistic approach to whole water resource, transmission, and effective usage shall be filled in the water audit study in order to save investment costs. Water loss control and detection of leak have always been considered an afterthought in network services. It is possible to take adequate action to conserve water and use it wisely.
The findings reveal that estimating the value of water loss has large uncertainty, which has an effect on the price of water loss. Real losses and apparent losses minimization strategies have a massive effect on the management of real losses and apparent losses minimization techniques.
Extra water pressures cause considerable physical wastage of water in many water distribution networks. The cost-effectiveness of a pressure reducing valve in minimizing water losses was demonstrated. For finding losses like leakages, divide large water distribution network into small DMA’s for accurate work and used electronics gadgets.
The ILI method provides a more solid foundation for technical leakage management evaluating performance. As a fraction of system input volume, there is no link among ILI and NRW.
Another problem is funding for the water distribution network, many people do not pay charges for authorities, so huge revenue is lost, and then make people aware about distribution networks.
Acknowledgements
We would like to thank the team of Google scholar and other article web links.
Funding Source
The author(s) have received no financial support.
Conflict of Interest
The authors do not have any conflict of interest.
References
- Sonvane Ramraje D., Nagarnaik Dr. P. B., Thergaonkar Dr. V. P. A Review- Water Audit. International Journal of Software & Hardware Research in Engineering. 2016; 4(2): 64-68. https://ijournals.in/wp-content/uploads/2017/07/9.4210-Ramraje.compressed.pdf.
- Gandhi Khusbhu, Master Mansi, Sheladiya Raj, Chotaliya Prashant. Water audit for residential area-Surat City. International Journal of Current Engineering and Technology. 2016; 6(5): 1814-1817.
- Kummu M., Guillaume J. H. A., Moel H. de, Eisner S., Flörke M., Porkka M., Siebert S., Veldkamp T. I. E., Ward P. J. The world’s road to water scarcity: shortage and stress in 20th century and pathways towards. Scientific reports 2016; 6(1): 1-16. https://doi.org/10.1038/srep38495.
CrossRef - Shiklomanov Igor A. World water resources: a new appraisal and assessment for the 21st century: a summary of the monograph World water resources. Paris, France: UNESCO International Hydrological Programme, UNESCO-IHP; 1998: 2-36.
- American Water Works Association. Water Audits and Loss Control Programs:M36. 4. American Water Works Association; 2016.
- Kulkarni Vijay, Gokhale P. N., Kalbar Pradip, Singh Nandlal. New Initiatives - Drinking Water Sector: Water and Energy Audit Tools for Assessment Water Supply Schemes. Proceeding of 46th Indian Water Works Association Convention; 2014; Bangalore. https://www.researchgate.net/publication/309865295_New_Initiatives_-_Drinking_Water_Sector_Water_and_Energy_Audit_Tools_for_Assessment_of_Water_Supply_Schemes
- Master Mansi, Gandhi Khushbu. Water audit and inevitability of water meter. International Research Journal of Engineering and Technology. 2017; 4(4): 594-598. https://www.irjet.net/archives/V4/i4/IRJET-V4I4120.pdf
- Deepiga Ms T., Sivasankari Ms A. Smart Water Monitoring System Using Wireless Sensor Network at Home/Office. International Research Journal of Engineering and Technology. 2015; 2(4): 1305-1314. https://www.irjet.net/archives/V2/i4/Irjet-v2i4218.pdf
- Chimote Kedar, Bhabhulkar Astashil. Water Audit. National Conference on Innovative Paradigms in Engineering & Technology: 2012. https://research.ijcaonline.org/ncipet/number9/ncipet1069.pdf
- Rogers D. Leaking water networks: an economic and environmental disaster. 12th International Conference on Computing and Control for the Water Industry: 2014. https://doi.org/10.1016/j.proeng.2014.02.157.
CrossRef - Perli Monisha, Sundar M. Subash, Devi Ch. Rama, Babu K. Ajay, Akula Ravali. Evaluating water losses and planning of reduce water losses reduction strategies in Vignan's Foundation for Science, Technology and Research, Vadlamudi : A case study. International Journal of Agriculture Sciences. 2018; 10(19): 7331-7335. https://bioinfopublication.org/files/articles/10_19_18_IJAS.pdf
- Kanakoudis Vasilis, Tsitsifli Stavroula, Papadopoulou Anastasia, Keramaris Evangelos. WATenERgy CYCLE: Assessing Water Use Efficiency in the Balkan-Mediterranean Area. Rio de Janeiro Brazil: 2018; Brazil. https://www.researchgate.net/publication/338682583_WATenERgy_CYCLE_Assessing_water_use_efficiency_in_the_Balkan-Mediterranean_Area
- Skeens Brian, E. P. Beyond Water Audits into Asset Management: The Process of Non-Revenue Water Reduction and Revenue Enhancement Activities. In Pipelines 2015; 2015; Baltimore. https://doi.org/10.1061/9780784479360.112.
CrossRef - Badrinath S. D., Raman N. S. Environmental Audit: Indian Scenario. Journal of Environmental Engineering. 1995; 121(6):472-477. https://doi.org/10.1061/(ASCE)0733-9372(1995)121:6(472)
CrossRef - Frauendorfer Rudolf, Liemberger Roland. The Issues and Challenges of Reducing Non-Revenue Water. Mandaluyong City, Philliphines: Asian Development Bank; 2010.
https://www.adb.org/sites/default/files/publication/27473/reducing-nonrevenue-water.pdf - United States Environmental Protection Agency. Water audits and water loss control for public water systems. Washington DC: USA Office of Water (4606 M); 2013. https://www.epa.gov/sites/default/files/2015-04/documents/epa816f13002.pdf
- Farley M, Trow S. Losses in Water Distribution Networks: A Practitioners’ Guide to Assessment, Monitoring and Control. Water Intell. UK: International Water Association Publishing; 2007. https://doi.org/10.2166/9781780402642.
CrossRef - Lambert A., Charalambous B., Fantozzi M., KovaÄ J., Rizzo A., St John S. Galea. 14 Years’ Experience of using IWA Best Practice Water Balance and Water Loss Performance Indicators in Europe. Proceedings of IWA Specialized Conference: Water loss. 1st April 2014; Vienna, Austria.
- California Department of Water Resources:Water Audit Manual. State of California: California Department of Water Resources; 2016. 1-66. https://cawaterlibrary.net/wp-content/uploads/2017/06/DWR-Water-Audit-Manual-FINAL.pdf
- Farley M., Wyeth G., Ghazali Z. B. M., Istandar A., Singh Sher, Dijk N., Raksakulthai V., Kirkwood E. The manager’s non-revenue water handbook: a guide to understanding water losses. USA: United States of America: United States Agency for International Development (USAID); 2008. https://bear.warrington.ufl.edu/centers/purc/DOCS/PAPERS/other/BERG/SandysSelections/1302_The_Managers_NonRevenue.pdf
- Al-Omari Abbas. A Methodology for the Breakdown of NRW into Real and Administrative Losses. Water Resource Management. 2013; 27(7): 1913-1930. https://doi.org/10.1007/s11269-013-0262-y.
CrossRef - Han Rui, Liu Jun. Spectral Clustering and Genetic Algorithm for Design of District Metered Areas in Water Distribution Systems. XVIII International Conference on Water Distribution Systems Analysis, WDSA2016; 2017. https://doi.org/10.1016/j.proeng.2017.03.221.
CrossRef - Advisory on Water Meter, Instrumentation and SCADA. India: Ministry of Housing and Urban Affairs, Government of India; 2020. http://mohua.gov.in/pdf/5efc2893a6f0bAdvisory_on_Water_Meter_Instrumentation_and_SCADA_Final.pdf
- Draft General for Water Audit and Water Conservation. India: Central Water Commission; 2017. http://old.cwc.gov.in/main/downloads/DraftGuideline_Water_Audit.pdf
- Mounce S. R., Boxall J. B., Machell J. Development and Verification of an Online Artificial Intelligence System for Detection of Bursts and Other Abnormal Flows. Journal Water Resource Planning and Management. 2010; 136(3): 309-318. https://doi.org/10.1061/(ASCE)WR.1943-5452.0000030.
CrossRef - Nazif Sara, Karamouz Mohammad, Tabesh Massoud, Moridi Ali. Pressure Management Model for Urban Water Distribution Networks. Water Resource management. 2010; 24(3): 437–458. https://doi.org/10.1007/s11269-009-9454-x.
CrossRef - Z. Ahmad Fuad, S. Eddy H., Y. Badronnisa, I. Syazwani. Water leak detection method in water distribution network. IOP Conference Series- Earth and Environmental Science; 2019. https://iopscience.iop.org/article/10.1088/1755-1315/357/1/012033/pdf.
CrossRef - AL-Washali Taha, Sharma Saroj, Kennedy Maria. Methods of Assessment of Water Losses in Water Supply Systems: a Review. Water Resource Management. 2016; 30(14): 4985-5001. https://doi.org/10.1007/s11269-016-1503-7.
CrossRef - Pickard Brian, Vilagos Jeff, Nestel Glenn, Lanning Daniel, Kuhr Stephen, Fernandez Rudy. Reducing Non-Revenue Water—It's Good Business:[A Case Study Featuring Tampa Water Department's Non-Revenue Water Reduction Strategy Utilizing the Latest AWWA Water Audit Methods and Tools]. World Environmental and Water Resources Congress 2007: Restoring Our Natural Habitat: 1-10. https://ascelibrary.org/doi/abs/10.1061/40927(243)532
- Sapient Techno Consultants. Preliminary Water Audit: Estimation of Water Losses and Strategy for Loss Reduction, City of Kalol, Gujarat, India. Gujarat, India: Centre for Environmental Planning and Technology University; 2010. 1-45.
- Winarni W. Infrastructure Leakage Index (ILI) as Water Losses Indicator. Civil Engineering Dimension. 2009; 11(2): 126-134. http://203.189.120.189/ejournal/index.php/civ/article/viewFile/17230/17771
- Ganorkar R. A., Khedikar Isha. P. Water Audit. International Journal of advanced Engineering Sciences and Technologies. 2011; 8(1): 039 – 048.
- Hamilton S., Mckenzie R., Seago C. A review of performance indicators for real losses from water supply systems. United Kingdom: UK House of commons Report; 2006. 1-9.
- Farley M., Liemberger R. Developing a Non-Revenue Water Reduction Strategy Part 2: Planning and Implementing the Strategy. In Conference Proceedings, IWA World Water Congress; 2004. https://www.researchgate.net/profile/Roland-Liemberger/publication/239582015_Developing_a_non-revenue_water_reduction_strategy_planning_and_implementing_the_strategy/links/59a65840a6fdcc61fcfae700/Developing-a-non-revenue-water-reduction-strategy-planning-and-implementing-the-strategy.pdf
- Lambert A.O., Brown T.G., Takizawa M., Weimer D. A review of performance indicators for real losses from water supply systems. Journal of Water Supply: Research and Technology—AQUA. 1999; 48(6): 227-237.
CrossRef - Lambert A. Ten years experience in using the UARL formula to calculate infrastructure leakage index. Proceedings of IWA Specialized Conference: Water Loss 2009; 2009; Cape Town, South Africa.
- Karadirek I. E., Kara S., Yilmaz G., Muhammetoglu A., Muhammetoglu H. Implementation of hydraulic modelling for water-loss reduction through pressure management. Water Resources Management. 2012; 26(9): 2555-2568. 10.1007/s11269-012-0032-2.
CrossRef - Liemberger R., Farley M. Developing a Non-Revenue Water Reduction Strategy, Part 1: Investigating and Assessing Water Losses. IWA Congress: 2004.
- AL-Washali Taha, Sharma Saroj, Lupoja Robert, AL-Nozaily Fadhl, Haidera Mansour, Kennedy Maria. Assessment of water losses in distribution networks: Methods, applications, uncertainties, and implications in intermittent supply. Resources, Conservation & Recycling. 2020; 152: 1-11. https://doi.org/10.1016/j.resconrec.2019.104515.
CrossRef - Sturm R., Thornton J. Proactive leakage management using District Metered Areas (DMA) and pressure management—Is it applicable in North America?. Leakage 2005 Confernce; 2005; Canada.
- Thornton J., Reinhard S., Kunkel G. Water Loss Control. USA: Mc Graw Hill; 2008.
- Liemberger R., Wyatt A. Quantifying the Global Non-Revenue Water Problem. Water Supply. 2019; 19(3): 831-837.
CrossRef - Koelbl J, Mayr E, Theuretzbacher-Fritz H, Neunteufel R, Perfler R. Benchmarking the process of physical water loss management. Proceedings of the 5th IWA Water Loss Reduction Specialist Conference; 2009; Cape Town, South Africa.


