Investigating Day and Nighttime Variability of Major Water-Soluble Inorganic Species and Role of Reactive Nitrogen Species in PM2.5 and PM10 - A Two Year Study
Subhash Chandra1
 , Monika J Kulshrestha2
*
and Ruchi Singh3
, Monika J Kulshrestha2
*
and Ruchi Singh3
1
Vivekananda College, University of Delhi,
Vivek Vihar,
New Delhi-110095,
India
2
CSIR-National Physical Laboratory,
New Delhi-110012,
India
3
Shriram Institute for Industrial Research,
New Delhi-110007,
India
4
http://dx.doi.org/10.12944/CWE.16.Special-Issue1.03
Copy the following to cite this article:
Chandra S, Kulshrestha M. J, Singh R. Investigating Day and Nighttime Variability of Major Water-Soluble Inorganic Species and Role of Reactive Nitrogen Species in PM2.5 and PM10 - A Two Year Study. Curr World Environ 2021; SI1. DOI:http://dx.doi.org/10.12944/CWE.16.Special-Issue1.03
Copy the following to cite this URL:
Chandra S, Kulshrestha M. J, Singh R. Investigating Day and Nighttime Variability of Major Water-Soluble Inorganic Species and Role of Reactive Nitrogen Species in PM2.5 and PM10 - A Two Year Study. Curr World Environ 2021; SI1.
Download article (pdf)
Citation Manager
Publish History

Introduction
The physicochemical properties of the atmosphere get affected by particulate matter by altering its composition and thus may alter ambient air quality, visibility, cloud formation, and consecutively energy entering, absorbed, reflected, and emitted by earth system1-3. Moreover, it can also affect human health adversely and may also alter the ecosystem4-6. Therefore, the chemical characterization of PM is necessary for the development of an air quality improvement programme to control the implications7-8. Delhi is considered a city where PM load is usually higher than the permissible limits, and hence its chemical description is needed at regular intervals of time. The primary sources of pollutants impacting the air of Delhi are the burning of fossil and biomass fuels, rapid urbanization, industrialization, and transportation9-11. Due to the potential effect of water-soluble components on rain chemistry, human health, and air quality, water-soluble inorganic components are studied extensively12-16. Several anthropogenic activities such as agricultural, vehicular, industrial, and burning of biomass consecutively transform secondary inorganic particles such as sulphate and nitrate9,17-19.
Delhi is a typical site for studying the chemistry of primary pollutants and the role of the transformation of secondary pollutants due to the high loading of particulate matter. In India, most studies on chemical characteristics are reported on a 24 hours basis sampling, whereas data on day and nighttime during different seasons forPM is limited. This study presents the temporal variability (day and nighttime) of the chemical composition of ambient aerosols for the years 2012 and 2013.The importance of day and nighttime variability, and the role of seasonal and transport patterns of long-range major water-soluble ionic species (WSIS), including reactive nitrogen species inPM2.5 and PM10 aerosols at a site in central Delhi, have been discussed.
Methodology
Site Description
The samples (PM10 and PM2.5) were collected at the terrace of CSIR-National Physical Laboratory (28°38?N, 77°10?E; 218 m amsl) (Fig.1), New Delhi. The site is located in central Delhi, surrounded by IARI farmland, commercial and residential areas. The site also experiences local, regional, and long-range transport of pollutants depending on meteorological conditions. Therefore, the study site is under the influence of both local as well as transported particulate matter.
Among the local sources,~7.4 million automotive and registered factories (~8000), including rubber/plastic, chemical, metal, and, leather affect the level of pollutants in the city. The study area also experiences the seasonality in the transport of pollutants from regional to distant sources. During summer,the site is under the influence of local to regional transport from North-west while in winter regional to long-range transport. In addition, calm wind conditions, lower mixing height with haze and, foggy conditions prevail in winter, whereas in summer, frequent dust storms and higher mixing height have been observed at the study site.
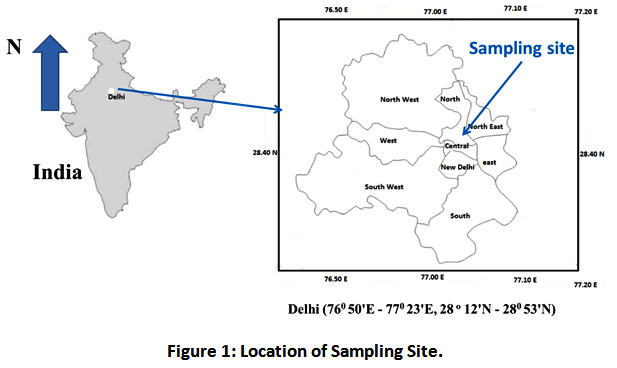 | Figure 1: Location of Sampling Site. Click here to view Figure |
Sampling of PM10and PM2.5
High and low volume samplers were used for collecting PM10(n= 160), and PM2.5 (n = 188) samples respectively. The pre-combusted (at 550ºC for 5h)Whatman Quartz Microfibre filters (QM-A) were used to collectsamples. The samples were stored in desiccators for 24 h beforeand after sample collection. Respirable particle sampler (PM10, Envirotech, APM 460 BL) and fine particulate sampler (PM2.5, Envirotech, APM 550) were run for 12 hrs daytime (07:00–19:00h) and 12 hrs nighttime(19:00–07:00h next day). After collecting samples, filters were stored at low temperature in a refrigerator till further analysis.PM10 sampler was operated in the flow range of 0.9-1.4 m3/minwhile PM2.5 sampler at a 1 m3/hr flow rate.
Analysis
For the analysis of WSIS, filter cuts (0.536 cm2 area) of collected samples were extracted in de-ionized water (Millipore, specific resistance: 18.2 M?-cm)using a sonicatorfor 90 minutes. A microporous membrane filter (PALL, Ultipor N Nylon 6, 6-Membrane, pore size 0.45-µm diameter 25 mm) was used to filter the extracted solution. After the extraction, water-soluble cations (Na+, K+, NH4+,Ca2+ and Mg2+) and anions (Cl-,SO42- and NO3-) in PM2.5 and PM10 aerosols were determined using Ion Chromatograph (Metrohm 883). Similarly,the concentrations of these water-soluble ionic species werealso estimated in blank filters. Every time, before the analysis, a three-point calibration curve was also achieved for each species.
Meteorological Parameters and Trajectory Analysis
For the years 2012 and 2013, meteorological parameters such as temperature (T), relative humidity (RH), and mixing height (MH) were downloaded from http://ready.arl.noaa.gov/READYamet.php link. A clear seasonality was observed for T, which was lowestin winter and highest in summer months. The highest monthly mean value of Twas observed in May, while minima were recorded in January. The monthly mean of T varied from approximately 10oC to 40oC. A higher difference between day and nighttime mean temperature was observed during winter and summer compared to the monsoon season. The monthly mean of RH varied from approx. 15 to 75%. The diurnal variation of RH revealed higher nighttime levels than daytime. The mixing height (MH) at the site represented the potential of convective current in the lower atmosphere. MH for winter months was observed a few hundred meters, while for summer months it went up to few thousand meters. Day and nighttime mean mixing height explain, much higher daytime value compared to nighttime during summer season, while this difference gradually decreases during monsoon and winter seasons (Fig.2).
 | Figure 2: Meteorological Conditions During Sampling Period. Click here to view Figure |
Results and Discussion
Annual Mean Day and Nighttime WSIS in PM2.5 and PM10
Fig.3 shows two years’average of mass concentrations of major ionic species in fine and coarse particles. Almost similar levels of Ca2+ and Mg2+were observed during the day and nighttime in fine mode,while in coarse mode,significant variation with higher daytime valueswere observed. Daytime and nighttime levels of Ca2+ in PM10 were observed as 7.32 µg m-3 and 4.25 µg m-3, respectively. The higher daytime levels might be due to more resuspension of crustal Ca2+ due to agricultural and commercial activities, as thesoil is theprime source of Ca2+. On the contrary, higher levels of NH4+ and K+ were observed in nighttime compared to daytime in both PM2.5 and PM10 among cations. NH4+was observed as 1.49 µg m-3 during the day and 2.50 µg m-3 during the nighttime in fine modewhile 2.39 and 5.54 µg m-3, respectively in the coarse mode. A similar trend was also reported from other study20, which reported higher nighttime levels of NH4+ owing to the variation in emission sources and temperature difference during nighttime. Day and nighttime levels of K+ were observed as 1.11 and 1.65 µg m-3 infine and 2.69 and 3.74 µg m-3 in coarse particles, respectively. Both the anionic species showed the same trend with higher levels in nighttime than daytime. During the day and nighttime,NO3- was observed as 3.18 and 4.75 µg m-3 in PM2.5 while 7.37 and 9.47 µg m-3 in PM10 respectively. The high concentrations of NO3-during nighttime might be due to the formation of NO3-through hydrolysis of N2O5under high humidity conditions and stability of NH4NO3 at a lower temperature during nighttime21-22. Similarly, low concentrations of NO3- during daytime might be due to evaporative loss of NH4NO3 at higher temperature23-24. A similar trend was also reported in an earlier study at Kanpur25, with a higherNO3- in nighttime (12.9 µg m-3) than daytime (5.4 µg m-3) in PM10. Day and nighttime levels of SO42- were observed as 8.66 and 9.25 µg m-3 in PM2.5 while12.80 and 12.95 µg m-3 in PM10, respectively.
 | Figure 3: Annual Mean Day and Nighttime Concentrations of WSIS in PM2.5 and PM10. Click here to view Figure |
The two years mean (daytime + nighttime) concentration difference in PM2.5 and PM10 was observed the highest for Ca2+while lowest for Mg2+. Around 5 times higher concentration of Ca2+ was observed in PM10(5.8 µg/m3) compared to PM2.5 (0.8 µg/m3). These observations are consistent with the other study, which reported higher Ca2+in coarse than fine particulate matter20. The mean concentration of Mg2+ was 0.1 and 0.6 µg/m3 in PM2.5 and PM10, respectively. Similarly, NO3- and SO42- were observed with ~4.5 and 3.9 times higher concentrations in PM10thanPM2.5, respectively. The levels of NO3-were observed as 4.0 and 8.4 µg/m3 in PM2.5 and PM10. SO42- was observed as 9.0 and 12.9 µg/m3 in PM2.5 and PM10, respectively. K+ showed ~ 1.8 times mean concentration in PM10 (3.2 µg/m3) compared to PM2.5 (1.4 µg/m3).
Variation of WSIS in PM2.5 and PM10
Several studies on water-soluble ionic species in particulate matter over Delhi and other cities of India have been carried out earlier9,25-26. For example, Chandra et al.9 reported that the secondary inorganic aerosols (NO3-, SO42- and NH4+) contributed up to 85% of the annual average concentration.
In this study, the highest difference was observed forCa2+, which showed ~9 times higher mean concentration in PM10 than PM2.5 in the daytime(Fig.4). The levels for NH4+, K+, and Mg2+ were observed as 1.6, 2.4, and 5.4 times higher in PM10 than PM2.5. For NO3- and SO42- , ~2.3 and 1.5 times higher mean concentrations were observed in PM10 than PM2.5. This suggested the dominance of Ca2+ and Mg2+among all species in coarse mode, while the dominance of NO3- and SO42-in fine mode. In daytime, the trend of WSIS in PM2.5 and PM10was observed as SO42->NO3-> NH4+> K+> Ca2+> Mg2+and SO42->NO3->Ca2+>K+ > NH4+>Mg2+ respectively. Previous studies27-28 also showed the dominance of SO42-, NO3-and NH4+ in PM2.5 and PM10.
During nighttime, the trends of WSIS in PM2.5 and PM10 were observed as SO42->NO3-> NH4+> K+> Ca2+> Mg2+ and SO42->NO3->NH4+> Ca2+>K+>Mg2+ respectively. Among cations,~ 5.3 times higher Ca2+ was observed in PM10 compared to PM2.5. Similarly, 2.2, 2.3 and, 3.2 times higher levels for NH4+, K+, and Mg2+ were observed in PM10 than PM2.5. NO3- and SO42- also showed ~2 and 1.4 times higher levels in PM10 than PM2.5, respectively.
 | Figure 4: Mean Concentrations of WSIS During Day and Nighttime in PM2.5 and PM10. Click here to view Figure |
Comparison of WSIS for the Year 2012 vs. 2013
A comparative study of WSIS in PM2.5 and PM10 was done for 2012 vs. 2013 (Fig. 5). In PM2.5,daytime concentration difference between 2012 and 2013 was observed as the highest for NO3- (5.01 and 1.36 µg/m3) and the lowest for Mg2+ (0.16 and 0.07µg/m3). On the other hand, inPM10, the day time difference between 2012 and 2013 was the highest forCa2+ (10.12 and 4.51 µg/m3) and the lowest for Mg2+ (0.93 and 0.47 µg/m3).
In the day time, all WSIS in PM2.5 and PM10 were found higher in 2012 compared to 2013 except K+. K+ in PM10 showed comparable levels in both 2012 (2.64 µg/m3) and 2013 (2.73 µg/m3). In 2012, NH4+, and Ca2+ in PM10 were 3.53 and 10.12 µg/m3 respectively. Significantly high daytime Ca2+ in PM10 suggested their dominance in coarse mode and favourable meteorological conditions due to solar, wind, and anthropogenic activities that induce mineral resuspension from the earth’scrust. The daytime NO3- and SO42- in PM10 were observed as 8.97 and 13.41 µg/m3 for 2012 and 5.78 and 12.18 µg/m3 for 2013,respectively. Moreover, daytime NO3- and SO42- in PM2.5 were observed as 5.01 and 10.31 µg/m3 for 2012 and 1.36 and 7.01 µg/m3 for 2013,respectively.
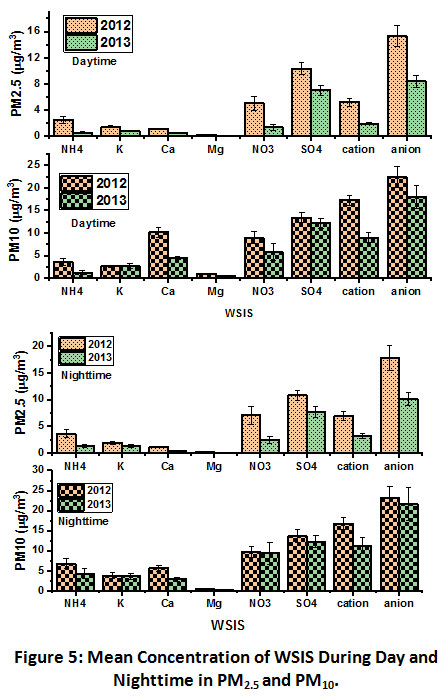 | Figure 5: Mean Concentration of WSIS During Day and Nighttime in PM2.5 and PM10. Click here to view Figure |
In the nighttime, levels of all WSIS were observed higher in 2012 compared to 2013 in PM2.5 and PM10. In PM2.5, NH4+, K+, and Ca2+ were found 3.67, 1.94 and 1.17 µg/m3 in 2012, and 1.33, 1.37 and 0.45 µg/m3 respectively in 2013. Moreover,in PM10, levels of NH4+, K+, and Ca2+ were found as 6.80, 3.80, and 5.60 µg/m3 in 2012, and 4.29, 3.67, and 2.89 µg/m3 respectively in 2013. The nighttime levels of NO3- and SO42- in PM2.5 were observed as 7.06 and 10.80 µg/m3 for 2012 and 2.45 and 7.70 µg/m3 respectively in 2013. Moreover, nighttime levels of NO3- and SO42- in PM10 were observed as 9.57 and 13.63 µg/m3 for 2012 and 9.36, and 12.27 µg/m3 respectively in 2013. These observations are analogous to another study that also reported a similar trend20.
Seasonal Variation of WSIS During 2012 and 2013
Time series of WSIS fromJanuary 2012 to December 2013 are presented in Fig.6. The frequency of high peaks of WSIS was recorded during the winter months and low in monsoon months. This seasonal pattern might be due to change in meteorological parameters. K+ showed a clear peak in both fine and coarse mode particles during the post-monsoon time, which suggested their relation with biomass/crop residue burning in nearby states. Earlier studies also suggested high K+ concentrations during the biomass burning period. Ahigher concentration of other ionic species such as NH4+, Ca2+, Mg2+, NO3- and SO42- was observed in the winter. Compared to other seasons,the high concentration trend in winter might be due to prevailing calm wind conditions and lower mixing height, restricting the dilution of WSIS in the atmosphere. High Ca2+ was noticed during the summer season, with higher levels observed in PM10 than PM2.5. Ca2+peaks in summer might be attributed to higher wind speed and temperature, which facilitate soil resuspension in the atmosphere. The only SO42- showed some peaks in the monsoon season, which might be due to their formation in fine mode.
 | Figure 6: Temporal Variability in Concentrations of WSIS in PM2.5 and PM10. Click here to view Figure |
The concentration of Mg2+ has followed almost the same pattern of variation as Ca2+ in both PM2.5 and PM10 during all seasons. However, in post-monsoon seasons,Mg2+ showed some extra peaks due to Fire crackers burning in the Diwali festival. Moreover, higher levels of NH4+, NO3- and SO42- were observed during the post-monsoon and winter months.
The concentration of each season during both daytime and nighttime was estimated to observe the seasonal mean variation for both years(Fig. 7). In the winterdaytime,?cations and anions were observed as 5.69 and 17.40 µg/m3 in PM2.5 and 15.08 and 32. 29 µg/m3 respectively in PM10.Whereas in monsoon season, the concentration was as lowas 1.88 and 10.62 µg/m3 in PM2.5 and 6.07 and 7.55 µg/m3, respectively in PM10. Results indicated that during winter, cations concentration in PM2.5 rises 3 times than that of monsoon, while in PM10, the rise was onlyup to 2.5 times. Significantly higher concentrations of cations during daytime in winters than monsoon indicated accumulation of particles transported from the long-range area and local sources like biomass burning, transport, brick kiln, etc. The highest concentration of pollutants during the winter months was also reported in previous studies owing to the lowering of boundary layer height and effect of source strength9,25. The concentration of Ca2+ during daytime summer (10.33 µg/m3) was noticed much higher compared to monsoon (4.39 µg/m3) in PM10, while in PM2.5,the concentrations in both seasons observed in a similar range (0.89 and 0.86 µg/m3 respectively). The higher Ca2+ was also reported in summer months (3.5 µg/m3) compared to winter (2.0 µg/m3) in PM10 aerosols at Kanpur29. During monsoon, a significant reduction of Ca2+ concentration in PM10 might be due to efficient wash out due to coarse mode existence and efficiently settling down these particles during rain. Moreover, the higher average value of Ca2+observed in daytime summer compared to winter might be due to high wind flow that carries a large amount of soil dust whereas, during winter and monsoon, meteorological conditions suppressed dust resuspension (Fig. 7). In the present study,NO3- and SO42-also showed significant seasonal variations in PM2.5 and PM10. A sharp reduction in the concentration of NO3- was observed in daytime summer just after winter in both PM2.5 and PM10 aerosols. For the winter and summer seasons, NO3- concentrations were observed as 7.51 and 1.16µg/m3 in PM2.5 and 13.49 and 2.08 µg/m3 in PM10,respectively. The sharp reduction in daytime summer concentration NO3-might be due to the photochemical oxidation process of NOx consumed to form secondary atmospheric pollutants. A different seasonal variation was noticed in SO42- in different size particulate matter, where daytime maximum concentration was observed in the rainy season (10.62 µg/m3) in PM2.5 and in winter (18.79 µg/m3) in PM10. Higher SO42- in monsoon might be due to their preferable formation in fine mode. An earlier study has also reported a higher percentage of SO42- in monsoon than pre-monsoon during both day and nighttime26. In the daytime, K+ showed the highest level during post-monsoon in PM2.5 and PM10, i.e., 2.14 and 4.40 µg/m3, respectively. The rise of K+ concertation in post-monsoon was attributed to large-scale crop residue burning by farmers in nearby states.
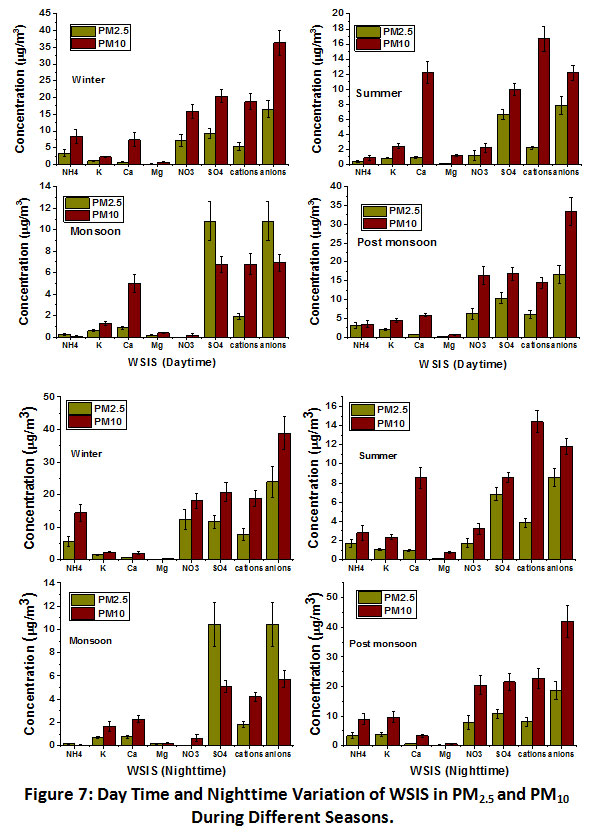 | Figure 7: Day Time and Nighttime Variation of WSIS in PM2.5 and PM10 During Different Seasons. Click here to view Figure |
At nighttime, the seasonal variation of all WSIS followed an almost similar trend with a slight difference in magnitude. The ?cations and ?anions levels in nighttime winter were observed 8.09 and 24.73 µg/m3 in PM2.5and 15.95 and 37.18 µg/m3in PM10, respectively. NH4+ was observed as the highest in nighttime winter while the lowest in monsoon in PM2.5 (5.81 and 0.17 µg/m3 respectively) and PM10 (11.42 and 0.03 µg/m3) respectively. During summer and post-monsoon,NH4+levels were observed as 1.72 and 3.33 µg/m3 in PM2.5 and 2.87 and 8.92 µg/m3in PM10, respectively. The highernighttime concentration of NH4+ in winter, summer and post-monsoon might be due to lower mixing height compared to daytime (Fig.2). In nighttime, K+ concentrations were observed the highest in post-monsoon and least in monsoon in PM2.5 (3.79 and 0.67 µg/m3 )and PM10 (9.39 and 1.58 µg/m3)respectively.On the contrary, Ca2+ levels were noticed as the highest in summer season (0.95 and 7.24 µg/m3) in both PM2.5 and PM10respectively. The highest level of K+ in post-monsoon was attributed to biomass burning while the highest level of Ca2+ in summer attributed to more active crustal sources. In this study, summer nighttimeCa2+was noticed slightly lower than daytime despite lower mixing height, which might be due to more soil resuspension in daytime. Similar to daytime, NO3- concentration during nighttime of summer observed with sharp reduction in its level compared to winter. Summer and winter night time levels of NO3- were observed as 1.71 and 12.64 µg/m3in PM2.5 and 3.04 and 17.64 µg/m3in PM10, respectively. Moreover, during night time of winter and summer seasons,SO42- concentrations were observed as 12.09 and 6.89 µg/m3in PM2.5 and 19.54 and 8.86 µg/m3in PM10, respectively. SO42-concertation in nighttime of monsoon were observed as 10.13 and 5.01 µg/m3 in PM2.5 and PM10respectively, suggesting the preferable formation of fine mode SO42- compared to coarse mode.
Percent Distribution of WSIS in PM2.5 and PM2.5-10
An analysis to observe the dominance of WSIS in PM2.5 and PM2.5-10 was done. In this analysis PM2.5 has been subtracted from PM10, which gives PM2.5-10. The percentage of Ca2+ in PM2.5-10 was 89% and 81% during day and nighttime, respectively (Fig.8). Whereas, percentage distribution study of SO42- reveals their dominance in PM2.5. The fine mode SO42- was found 68% and 71% during day and nighttime,respectively. A higher percentage in fine mode suggested their origin as secondary aerosol (via gas-to-particle conversion).
A comparative study on the sum of all cations and anions suggesteda higher percentage of cations in PM2.5-10in daytime (73%) andnighttime (63%) and a higher percentage of anions in fine mode in both daytime (59%) and nighttime (62%)respevtively. Earlier studies also suggested the cations such as Ca2+ and Mg2+ of crustal origin and NO3- and SO42- from anthropogenic sources. The fine mode existence of NH4+ was noticed higher in the daytime (63%) compared to nighttime (45%). At the same time,K+ depicted a comparable percentage in fine mode during daytime (59%) and nighttime (56%).
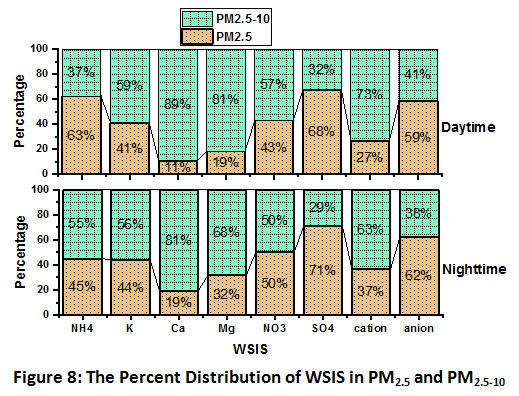 | Figure 8: The Percent Distribution of WSIS in PM2.5 and PM2.5-10. Click here to view Figure |
NO3-/SO42-mass ratios in PM2.5 and PM10
The mass ratio of NO3-/SO42-has been widely used by several researchers as amarker for the relative contribution of mobile vs. stationary sources of nitrogen and sulphur species in the atmosphere17, 30. The mass ratios (NO3-/SO42?)at the study site suggestedthe dominance of source type. Ratio values>1 indicate the prevalence of mobile sources, whereas the mass ratios value<1 suggeststhe dominance of stationary sources31. In this study, the seasonal average mass ratios of NO3-/SO42- in PM2.5 and PM10were observed in daytime and nighttime (Fig.9). The mass ratioswere found in the range of 0.1- 1.3 during different seasons of 2012 and 2013.In general,NO3-/SO42- mass ratios showedcomparatively higher values in winter and post-monsoon whereas least values in summer and monsoonperiod. The results of this ratio analysis suggestedthedominance of stationary sources over mobilesources in the winter period, which might be facilitated byprevailing calm wind conditions.
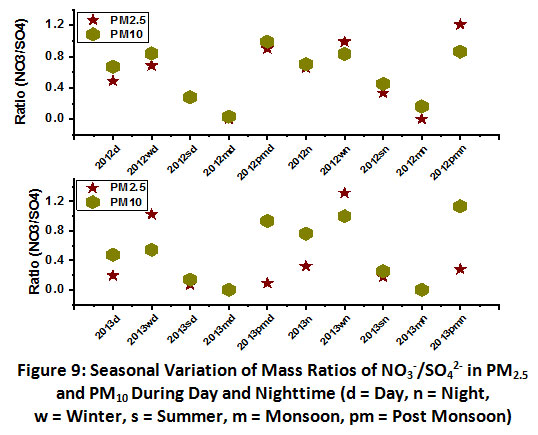 | Figure 9: Seasonal Variation of Mass Ratios of NO3-/SO42- in PM2.5 and PM10 During Day and Nighttime. Click here to view Figure |
Behaviour of Reactive Nitrogen During Day and Nighttimein PM2.5 and PM10
The acidic species such as H2SO4 and HNO3 are considered secondary air pollutantsformed in the atmosphere viathe oxidation process of their primary gaseous precursors (SO2 and NOx) in the atmosphere32.The neutralization of these acidic species in the atmosphere is done by alkaline ions such as NH4+ and Ca2+. Therefore, the availability and correlation among these acidic and alkaline species decide the acidic/alkaline nature of dry/wet deposition.
Therefore, a correlation study between nitrogenous cation (NH4+) and anion (NO3-) in both during the day and nighttime in PM2.5 and PM10, was done (Fig.10). In PM2.5, the correlation coefficient (r) between NH4+ and NO3- was observed higher in daytime (r= 0.84) compared to nighttime (r=0.67). On the contrary, in PM10 higher correlation was observed between NH4+ and NO3- in nighttime (r=0.73) compared to daytime (r= 0.67). The result suggested that fine mode NH4+ has a higher affinity with NO3- in the daytime, whereas coarse mode NH4+ showed a higher affinity with NO3- in the nighttime. These results suggested that these ions were secondary in nature, and NH4+ mainly existed as (NH4)2SO4 and NH4NO3 during the day and nighttime.
 | Figure 10: Correlation Between NH4+ and NO3- During Day and Nighttimein PM2.5 and PM10. Click here to view Figure |
Principal Component Analysis of WSIS in PM2.5 and PM10
To study the origin and sources of major water-soluble inorganic species, Principal Component Analysis (PCA) was performed. PCA is a multivariate technique used to convert data intoasmall dataset of theindependent variable or principal components (PCs)33. Factor loading >0.50 was included for the source apportionment. Data analysis for PM10 and PM2.5 was performed during theday and nighttime for 2012-2013 (Table 1). For coarse fraction analysis,a total of 3 PCs were extracted, explaining 87.4% and 91.81 % of data during the day and nighttime, respectively. In PM10,no significant difference was observed during the day and nighttime PCA analysis. PC1 in both day and nighttime explained maximum emission,reflectingthesignificantcontribution from anthropogenic sources of air pollution, i.e., SO2 and NOx, which eventually converts into secondary aerosol formation. PC2 explained ~ 31 % data and showed high correlations of Ca2+and Mg2+. Therefore, this PC indicates emissions from crustal sources or windblown dust. PC3 explained ~ 10 % data during theday and nighttime with the correlation between NH4+, K+, and Ca2+ indicating biomass burning and secondary aerosol formation.
For the fine mode particles,a total of3 & 4 PCs were extracted during the day and nighttime, respectively, explaining >80 % data. The first PC explained maximum data with high correlations of SO42- and NO3- with NH4+ and K+ indicating anthropogenic emissions including vehicular and biomass burning and consecutive secondary aerosol formation. During thedaytime, PC2 explained 30% data with high correlations of Ca2+ and Mg2+ indicating crustal sources. But during nighttime, PC2 showed a positive correlation of Ca2+ and Mg2+and a negative correlation of NH4+ and NO3-. This suggested crustal sources and secondary aerosol formation at low temperatures in the fine mode particles. Similarly, PC3 showed anegative correlation between K+ and SO42- with Ca2+ during the daytime, whereas K+was negatively correlated with Ca2+ and SO42-during nighttimein PC4. This suggested biomass burning and secondary aerosol formation. These results indicated that in the fine mode particles, secondary aerosol formations are more prominent than coarse mode, and at low temperature, SO2 and NOx also participate in other chemical conversions than their sulphate and nitrate salts.
Table 1: Principal Component Analysis of WSIS in PM2.5& PM10
Conclusions
Two years of continuous study ofwater-soluble ionic species in PM2.5 andPM10 at a site in central Delhi provides comprehensive data on thebehaviour of these species during day and night time. The results showed that the mean levels of both ?cations and ?anions were higher in nighttimethan daytime in PM2.5 and PM10. Furthermore, it revealedthe higher average concentration of Ca2+ and Mg2+ in the daytime compared to nighttime, while higher values of K+, NH4+, NO3- and SO42- in nighttimecompared to daytime in PM2.5 and PM10. A higher daytime Ca2+ indicated the role of active crustal sources. While thelower daytime value of NO3- might be due to thephotochemical oxidation process of NOx in thedaytime. Moreover, the differentlevels in day and nighttimewere noticed higher in PM2.5 compared to PM10. Among anions,significantvariation was observed in NO3-, showing ~ 49% higher in the nighttime than daytime, while for SO42- only ~9% higher values were noticed in thenighttime. The higher variation of NO3- level might be due to their active participation in thedaytime photo-oxidation process. The higher day and nighttime difference of Ca2+ and Mg2+wereobserved in PM10 compared to PM2.5, suggesting their dominance in thecoarse mode. In PM10, the highest Ca2+ concentration was observed in daytime summer and least in nighttime monsoon,indicating the role of loose soil and meteorological conditions. The higher daytime SO42- concentration in monsoon compared to summer indicatedthe preferable formation of secondary aerosols in fine mode. A highcorrelation was observed between NO3- and NH4+ in fine and coarse mode particlesin the day and nighttime.Also, NH4+levels were found to be in good correlation to SO42- and NO3-,indicatingthe role of secondary aerosolformation. In both day and nighttime, NH4+ mainly existed as(NH4)2SO4 and NH4NO3.
Acknowledgements
The authors are thankful to the Director, CSIR-NPL, New Delhi,for encouraging and support this study. Subhash Chandra is grateful for his CSIR Fellowship (JRF and SRF) for carrying out this work, and Ruchi Singh is grateful for her DST fellowship(SRF) during the study period(Grant No. GAP-113332). Partial funding from Grant No. PSC-0112 for consumables is gratefully acknowledged.
References
- James H, and Boucher O. 2000. Estimates of the Direct and Indirect Radiative Forcing Due To Tropospheric Aerosols’ a Review.Review of geophysics. 1999; 513-43.
CrossRef - Satheesh S. K, and MoorthyK. K. Radiative Effects of Natural Aerosols: A Review.Atmospheric Environment. 2005; 39(11): 2089-2110.
CrossRef - Xiao S. et al. Long-Term Trends in Visibility and Impacts of Aerosol Composition on Visibility Impairment in Baoji, China.Atmospheric Research. 2014;149: 88-95.
CrossRef - Chandra S,Kulshrestha M. J, Singh R, and Singh N. Chemical Characteristics of Trace Metals in PM10 and Their Concentrated Weighted Trajectory Analysis at Central Delhi, India. Journal of Environmental Sciences. 2017;55: 184-96.
CrossRef - Granat L,Norman M, Leck C, Kulshrestha U, C, Rodhe H. Wet Scavenging of Sulfur Compounds and Other Constituents during the Indian Ocean Experiment (INDOEX).Journal of Geophysical Research: Atmospheres. 2002;107(D19):8025
CrossRef - Satyanarayana J, Reddy L. A. K, Kulshrestha M. J, Rao R. Chemical Composition of Rain Water and Influence of Airmass Trajectories at a Rural Site in an Ecological Sensitive Area of Western Ghats (India). Journal of Atmospheric Chemistry. 2010; 66(3):101-116.
CrossRef - Lee. C. T, Chuang M. T, Chan C. C et al. 2006. Aerosol Characteristics from the Taiwan Aerosol Supersite in the Asian Yellow-Dust Periods of 2002.Atmospheric Environment. 2006;40(18):3409-18.
CrossRef - Rengarajan R, Sudheer A. K, and Sarin M. M. Aerosol Acidity and Secondary Organic Aerosol Formation during Wintertime over Urban Environment in Western India.Atmospheric Environment. 2011;45(11):1940-45.
CrossRef - Chandra S, Kulshrestha M. J, Kumar B, and Kotnala R. K. Investigating Daytime and Night-Time Differences with the Seasonal Trend and Sources of Inorganic Fine Aerosols in Indo-Gangetic Plain. Journal of Earth System Science. 2019;128(2).
CrossRef - Saud T, saxena M, Singh D. P, Saraswati, Dahiya M, Sharma S. K, Datta A, Gadi R, Mandal T. K. Spatial Variation of Chemical Constituents from the Burning of Commonly Used Biomass Fuels in Rural Areas of the Indo-Gangetic Plain (IGP), India. Atmospheric Environment. 2013;71:158–69.
CrossRef - Singh R, Kulshrestha M. J, Kumar B, and Chandra S. Impact of Anthropogenic Emissions and Open Biomass Burning on Carbonaceous Aerosols in Urban and Rural Environments of Indo-Gangetic Plain.Air Quality, Atmosphere & Health. 2016;9:809-822 http://link.springer.com/10.1007/s11869-015-0377-9 (November 13, 2015).
CrossRef - Kulshrestha, U. C, ReddyA.K, Satyanarayana J. and Kulshrestha M, J. Real-Time Wet Scavenging of Major Chemical Constituents of Aerosols and Role of Rain Intensity in Indian Region.Atmospheric Environment. 2009:43(32):5123–27.
CrossRef - Kulshrestha U. C, Raman R. S, Kulshrestha M. J, rao T. N.Secondary Aerosol Formation and Identification of Regional Source Locations by PSCF Analysis in the Indo-Gangetic Region of India.Journal of Atmospheric Chemistry. 2009;63(1):33–47.
CrossRef - Rastogi N, and Sarin M M. Long-Term Characterization of Ionic Species in Aerosols from Urban and High-Altitude Sites in Western India: Role of Mineral Dust and Anthropogenic Sources. Atmospheric Environment. 2005;39:5541–54.
CrossRef - Sharma M, Kishore S, Tripathi S. N., and Behera S. N. Role of Atmospheric Ammonia in the Formation of Inorganic Secondary Particulate Matter: A Study at Kanpur, India.Journal of Atmospheric Chemistry. 2007; 58(1):1–17.
CrossRef - Tiwari S, Srivastava M. K, and Bisht D. S. Chemical Characteristics of Water Soluble Components of Fine Particulate Matter, PM 2.5, at Delhi, India.Journal Earth Science India. 2008:1(3):72–86. http://www.earthscienceindia.info/.
- Khoder M. I. and Hassan S. K. Weekday/weekend differences in ambient aerosol level and chemical characteristics of water-soluble components in the city centre.Atmos. Environ. 2008; 42:7483–7493.
CrossRef - Kumar P, Kumar R, and Yadav S. Water-Soluble Ions and Carbon Content of Size-Segregated Aerosols in New Delhi , India?: Direct and Indirect Influences of Firework Displays. Environment Science and Pollution Research. 2016;23:20749-20760.
CrossRef - Tiwari S, Dumka U. C, Kaskaoutis D. G, Ram K, Panicker A. S, Shrivastava M. K, Tiwari S, Attri S. D, Soni V. K, Pandey A. K.Aerosol Chemical Characterization and Role of Carbonaceous Aerosol on Radiative Effect over Varanasi in Central Indo-Gangetic Plain.Atmospheric Environment. 2016;125:437-449.
CrossRef - Hsu Y. C, Lai M. H, Wang W. C, Chiang H. L. & Shieh Z. X. 2008. Characteristics of Water-Soluble Ionic Species in Fine (PM2.5) and Coarse Particulate Matter (PM10–2.5) in Kaohsiung, Southern Taiwan. Journal of the Air & Waste Management Association. 2008;58(12):1579-1589.
CrossRef - Guo S, Hu M, Wang Z. B, Slanina J, Zhao Y. L. Size-resolved aerosol water- soluble ionic compositions in the summer of Beijing: implication of regional secondary formation. Atmos. Chem. Phys.2010;10:947-959.
CrossRef - Kundu S, Kawamura K, Andreae T, Hofferd A, Andreae M. O. Diurnal variation in the water-soluble inorganic ions, organic carbon and isotopic compositions of total carbon and nitrogen in biomass burning aerosols from the LBA-SMOCC campaign in Rondônia, Brazil. J. Aerosol Sci. 2010;41:118-133.
CrossRef - Seinfeld J.H, Pandis S. N. Atmospheric Chemistry and Physics: From Air Pollution to Climate Change. John Willey & Sons, Inc, Hoboken, New Jersey. 1998.
CrossRef - Pathak R.K, Wu W. S, Wang T. Summertime PM2.5 ionic species in four major cities of China: nitrate formation in an ammonia-deficient atmosphere. Atmos. Chem. Phys. 2009; 9;1711-1722.
CrossRef - Ram K, and SarinM.M.Day–Night Variability of EC, OC, WSOC and Inorganic Ions in Urban Environment of Indo-Gangetic Plain: Implications to Secondary Aerosol Formation.Atmospheric Environment. 2011;45(2):460–68.
CrossRef - Bisht D, Dumka U. C, Kaskaoutis D. G, Pipal A. S, Shrivastava A. K, Soni V. K, Attri S. D, Sateesh M, Tiwari S.Carbonaceous Aerosols and Pollutants over Delhi Urban Environment: Temporal Evolution, Source Apportionment and Radiative Forcing. The Science of the total environment. 2015;521–522:431–45.
CrossRef - Dao X, Wang Z, LvY, Teng E, Zhang L, Wang C. Chemical Characteristics of Water Soluble Ions in Particulate Matter in Three Metropolitan Areas in the North China Plain. PLoSOne. 2014;9(12):e113831.
CrossRef - Deshmukh D. K, Debi M. K, Tsai Y. I, Mkoma S. L.Water Soluble Ions in PM2.5 and PM1 Aerosols in Durg City, Chhattisgarh, India Aerosol and Air Quality Research. 2011;11: 696–708.
CrossRef - Ram K, SarinM. M. and. TripathiS. N. 2012. Temporal Trends in Atmospheric PM?.?, PM??, Elemental Carbon, Organic Carbon, Water-Soluble Organic Carbon, and Optical Properties: Impact of Biomass Burning Emissions in the Indo-Gangetic Plain. Environmental science & technology. 2012;46(2):686–95.
CrossRef - Xiao H. and Liu C. Chemical characteristics of water soluble components in TSP over Guiyang, SW China, 2003; Atmos. Environ. 2004; 38: 6297–6306.
CrossRef - Arimoto R, Duce R. A, Savoie D. L, Prospero J. M, Talbot R, Cullen J. D, Tomza U, Lewis N. F and Ray B. J. Relationships among aerosol constituents from Asia and the North Pacific during Pem-West A; J. Geophys. Res1996;101:2011–2023.
CrossRef - Zhang X. Y. Yang Y, Niu T, Zhang X. C.Atmospheric Aerosol Compositions in China: Spatial/Temporal Variability, Chemical Signature, Regional Haze Distribution and Comparisons with Global Aerosols.Atmospheric Chemistry and Physics. 2012;12(2):779–99.
CrossRef - Jolliffe I. T. Principal Component Analysis, Springer-verlay, New York 2nd edition. 2002.


