Prayagraj: Air Pollution Profile and Policy Recommendations
Sugandh Kumar Choudhary
*

http://dx.doi.org/10.12944/CWE.15.3.19
Copy the following to cite this article:
Choudhary S. K. Prayagraj: Air Pollution Profile and Policy Recommendations. Curr World Environ 2020;15(3). DOI:http://dx.doi.org/10.12944/CWE.15.3.19
Copy the following to cite this URL:
Choudhary S. K. Prayagraj: Air Pollution Profile and Policy Recommendations. Curr World Environ 2020;15(3). Available From: https://bit.ly/2KNsKwY
Download article (pdf)
Citation Manager
Publish History

Introduction
Air pollution affects each one of us irrespective of gender, age income status and geographical location. Cardiovascular and respiratory disease fuels death from lung cancer1, ischemic stroke2, asthma3 causing erosion of quality of life. Air pollutants move deep into our respiratory system and gets absorbed into our blood circulation impairing our brain, heart and lungs.As per WHO’s newsletter4 9 out of 10 people breath air loaded with high pollutant level.“Air pollution threatens us all, but the poorest and most marginalized people bear the brunt of the burden,” says Dr TedrosAdhanomGhebreyesus, Director-General of WHO. As per global ranking of risk -factors causing deaths, Air pollution is the fifth leading risk factor for world – wide mortality. Air pollution is a direct threat to human health as it caused 4.9 million deaths in the year 2017 approximately 147 million years of healthy life lost5. Recent studies have also established that there is a clear link between air pollution and central nervous system diseases6. As per WHO, South – East Asia and Eastern Mediterranean Region has the highest ambient air pollution level. Ambient air pollution in this region is five times more polluted than WHO limits. Given the severity of air pollution and its colossal impact on health, this paper studies major air pollutants such as Nitrogen Dioxide (NO2), Particulate Matter (PM10) and Sulphur Dioxide (SO2) in Prayagraj. Nitrogen dioxide is emitted from fuel burning and when nitrogen reacts with oxygen at high temperature. PM10 is coarse particle formed from construction and road dust. Sulphur dioxide is emitted from burning of coal or oilin power plants. It also comes from factories that make chemicals, papersor fuel.
An inherent relation to nature is what we all enjoy, cherish and it is the most essential aspect of every living being. People above 65 years of age exposed to greenery and clean environment face lower risk of hypertension by 13 per cent and 14 per cent less risk from diabetes7. However unchecked deforestation has led to loss of green cover and destruction of global sink. Growing urbanization and rapid industrialization has led to concretization of cities. Associated investment in road infrastructure has facilitated mobile emitters such as cars and trucks compounding the problem of air pollution. Infants and children are more exposed to respiratory infections and increase their susceptibility to air pollution8. Moreover, children inhale more polluted air than adults as they remain outside for longer preiods9. Ever growing population feeding industrial activity through demand channel, vehicular pollution accompanied by rapid urbanization and burning of fossil fuels pose a serious threat to clean air. Air pollution is ranked among top five risk factors causing deaths for all ages across gender in 201710. As per estimates, more than 6 million deaths were caused by air pollution in 201211 and has emerged as a major health concern. Primary pollutants react with anthropogenic emissions forming secondary pollutants in the atmosphere with climate altering and health damaging effects12. Ambient air pollution is the fifth biggest cause of mortality in India13.
As per report14, increased temperatures due to climatic change and rising level of air pollutants will cause increase in airborne allergens. The report is highly confident that such increased airborne allergens will cause increased respiratory illness, asthma cases other allergic illness. Particulate emissions and ozone traces causes deterioration in health outcomes. Health deterioration due to emissions of pollutants causes premature deaths, lung cancer fall in labour productivity. As per the report air pollution affects different people differently. Women and elderly face the greatest baseline risk due to exposure to pollution. In the U.S. as per an estimate, 6.8 million children shows symptoms of asthma, making it the main cause behind reduced attendance of school going kids.
Air pollution has high mortality rates and disease burden in India being highest in the low Socio – Demographic Index (SDI) states of north India like Uttar Pradesh and Bihar15. State wise all round customised approach to tackle the air pollution and related avoidable deaths is need of the hour.
Air pollution is a national problem, killing 1.2 million Indians every year. It has resulted in loss to the national GDP by around 3 per cent16. According to the report, barring few cities in the southern India, no Indian city comply with NAAQ standards. Air pollution is a critical problem to mankind and straight jacket approach at the central level will only curb pollution to some degree. Customised approach area wise is needed to address major source of air pollutants.
As per a study in New Zealand in Auckland city, PM10 particles in the atmosphere are negatively corelated. However, during the daytime, PM10 particles are positively correlated to temperature due to thermally – induced convection. Overall correlation is moderately negative as the Spearman’s co-efficient stands at -0.45. Relative humidity impacts PM10 particles in a positive way up to a threshold level of 75% of relative humidity. This positive correlation ceases to exists beyond threshold level. This finding is in line with the findings of Barmpadimos. According to study17, PM10 and relative humidity increases up to a level, then PM10 drops suddenly for a period while relative humidity continues to rise.
As per study, out of top 10 cities with worse air quality, seven are from India with Delhi being the world’s most polluted city18. Air – pollution emergency is not restricted to metros but has rapidly penetrated into tier – II cities. Prayagraj recently witnessed largest human gathering with around 120 million pilgrims visiting the city over a period of 48 days.
Air pollutants were studied by Srivastava and Vaishya19 (2009) with two monitoring stations in the city. Pollutants exposure were collected using dust samplers. Other than this particular work, no known exhaustive work is done in the city on air pollutants. Dearth of any pollution related city specific study is surprising given the religious importance of the city. The objective of this paper is to fill this gap and present a comprehensive study of air pollution in Prayagraj. Given that the city comes under the list of Smart city, the study becomes more important to guide the district administration and policy makers to take necessary steps towards curbing air pollution. The paper studies air pollutantsat five monitoring stations fromJanuary, 2016 to January, 2020 (monthly data from Uttar Pradesh Pollution Control Board20). The paper gives a composite air quality index at five monitoring stations after studying air pollutants, namely, Sulphur Dioxide (SO2), Nitrogen Dioxide (NO2) and PM10 particles andhighlights the seasonal impacton air quality.The paper studies best global practices to curb airpollution and recommends customised policy measures to check degrading air quality. It also identifies areas with high exposure to pollutants and gives a representative series of overall air quality in the city. Accordingly the paper is divided into four sub sections. Section 2 gives the overall geographical features of the city and its monitoring stations, section 3 studies individual pollutants i.e. PM10, NO2 and SO2, section 4 studies the composite air quality of Prayagraj and section 5 presents detailed conclusion of the paper.
Prayagraj: Pollution Profile and Geographical Features
The city of Prayagraj, the judicial capital of the state, is among the largest cities of Uttar Pradesh with an area of 5,482 sq. km is situated at the confluence of three rivers – the Ganga, the Yamuna and the invisible Saraswati. Prayagraj is the seventh most populated city in the state with the urban population of 11.43 lakh21. Prayagraj is located at 25.45°N 81.84°E.
Prayagraj witnessed the third highest concentration of PM 2.5 (Annual mean, ug/m3) in the ambient air after Zabol (Iran) and Gwalior out of 2975 cities in the year 201222. The city was ranked twelfth in terms of exposure to PM10. The residents of Allahabad often face the stormy pollutants. Coal-burning power plants, automobile emissions and deforestation accompanied with unchecked construction all leave the holy city, literally, in the dust. Prayagraj is one among thirteen smart cities identified in the state. As per an estimate, total population of the city is projected to cross 2 million by the year 2031. Smart city requires smart planning and providing clean air to its residents is one the most important aspect of development.
The paper studies pollution level w.r.t. PM10, Nitrogen Dioxide and Sulphur Dioxide at five important locations in the city – Rambagh, Crossing Mahalakshmi Talkiez (CMT, near District Court), Johnstonganj, Alopibagh and Bharat Yantra Nigam (BYN, popularly known as Civil Line). Let us know about these areas brief (figure 1 to 3).
Rambagh
The area is close to city railway station and has open spaces like park, schools and colleges thatare airy and spacious as can be seen in the image below. The area sees heavy traffic.
Johnstonganj
Johnstonganj is a highly dense and congested area with negligible green cover. Heavy traffic and vehicle movement is a daily event in the area. It is highly commercialized and pavements are encroached with vehicle parking and small shops. Three to four story buildings withvery fewtree is a common sight in the area.
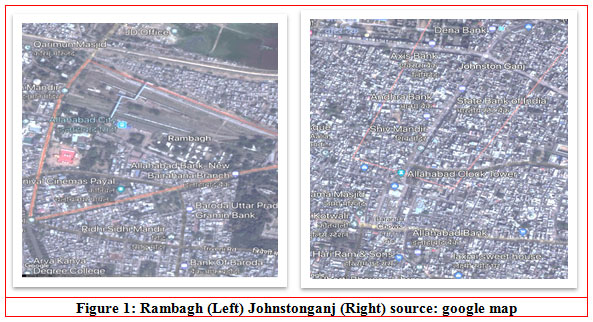 |
Figure 1: Rambagh (Left) Johnstonganj (Right) Click here to view figure |
Alopibagh
Due to its proximity to Old Grand Trunk road, Alopibagh sees high vehicular movement. Thearea is near to river bed and breeze can be experienced in the morning. Wide open space in the vicinity with greenery in patches is evident from the map. It should be noted that three areas – Rambagh, Johnstonganj and Alopibagh – is served by single artery road as these locations lie adjacent to eachother. Heavy vehicular movement crosses through these areas all the time. Congestion and high density are regular feature in all the three areas.
Crossing Mahalakshmi Talkies
The area is popularly known as Civil Line and mostly traders and government employees live here. It has wide roads with low density compared to other three areas discussed earlier. Normal traffic with less congestion can be seen.
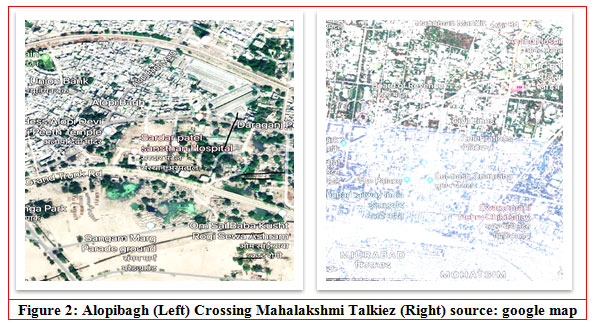 |
Figure 2: Alopibagh (Left) Crossing Mahalakshmi Talkiez (Right) Click here to view figure |
Bharat Yantra Nigam: High Court
The area has wide roads and is less densely populated featuring parks and open spaces with greenery in patches. However, construction activity in this area has accelerated in the last two – three years.
 |
Figure 3: Bharat Yantra Nigam (High Court) Click here to view figure |
Pollutant Analysis: PM10
Particulate matter (PM10) is 10 micrometers or less in diameter. Finely divided solid particles or liquid droplets such as soot, smoke, fly ash, mists, aerosols and dust particles from construction activity form major components of PM10. These particulate matters are so small that it can easily be absorbed into lungs and causes health issues like asthama, irregular heart – beat, heart attacks, reduced lung function and other potentially serious health problems.
It is clear from the graph (Fig 4a) that CMT shows the highest number of peaks indicating higher level of PM10 exposure. It reaches global maxima of 370 µg/m3 in August 2019. Exposure to PM10 remains at elevated level until monsoon. Seasonal effects can be seen as exposure to PM10 gradually declines with the arrival of monsoon between July to September. PM10 level rises during summer and winter season. Fig 4b shows thatPM10 median value is the highest for CMT.Outliers can be seen in Bharat Yantra Nigam and Crossing Mahalakshmi Talkiez but they have been included in the study to maintain realism.
 |
Figure 4: (a) Seasonal impact can be seen with fall in PM10 level during monsoon period (b) CMT area has the highest PM10median level followed by Alopibagh Click here to view figure |
There is very high correlation between PM10 particles for Rambagh, Johnstonganj and Alopibagh. It should be noted that these three locations fall on a single feeder artery road. High degree of correlation can also be seen in particulate matter between CMT and BYN as these two areas are close by (Table 1).
Table 1: Correlation of PM10 area wise
|
Corr. |
byn |
cmt |
johnstonganj |
alopibagh |
rambagh |
|
byn |
1 |
|
|
|
|
|
cmt |
0.93 |
1 |
|
|
|
|
johnstonganj |
0.36 |
0.25 |
1 |
|
|
|
alopibagh |
0.41 |
0.27 |
0.90 |
1 |
|
|
rambagh |
0.44 |
0.32 |
0.86 |
0.93 |
1 |
Rambagh, Alopibagh and Johnstonganj in that order has PM10 close to normal distribution. PM10 at Bharti Yantra Nigam and Crossing Mahalakshmi Talkiez is negatively skewed. It shouldbe noted that Alopibagh shows the highest minimum point of 57. Mean PM10pollutant is the highest mean for CMT followed by Alopibagh.
Table 2: Descriptive statistics of PM10 area wise
|
area |
Mean |
Std. Dev. |
skewness |
kurtosis |
Min |
Max |
|
byn |
189 |
51 |
-1.37 |
4.81 |
39 |
255 |
|
cmt |
235 |
67 |
-0.74 |
3.99 |
53 |
370 |
|
johnstonganj |
182 |
74 |
0.25 |
2.00 |
52 |
344 |
|
alopibagh |
207 |
84 |
-0.22 |
1.68 |
57 |
337 |
|
rambagh |
182 |
78 |
-0.14 |
1.73 |
45 |
310 |
Considering three benchmarks of air quality in terms of PM10: Clean (30 – 100 µg/m3), Moderate (100 – 250 µg/m3) and Polluted (250 – 400 µg/m3),Alopibagh has the highest percentage distribution of PM10 pollutant lying in the polluted categoryfollowed by Crossing Mahalakshmi Talkiez. Rambagh has relativelylower PM10pollutant in comparison to other locationsthough it is only 20 per cent of the entire period under study (Figure 5). Overall, Bharat Yantra Nigam area falls under the category of moderate level of air quality (88 per cent) in terms of PM10 that needs to be watchful. If proper remedial is not undertaken at the earliest, the area is highly likely to attain “Polluted”category.
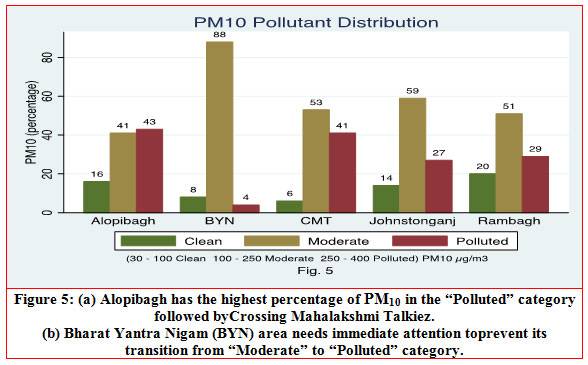 |
Figure 5: (a) Alopibagh has the highest percentage of PM10 in the “Polluted” category followed byCrossing Mahalakshmi Talkiez. b. Bharat Yantra Nigam (BYN) area needs immediate attention toprevent its transition from “Moderate” to “Polluted” category. Click here to view figure |
Pollutant Analysis: Nitrogen Dioxide (NO2)
Nitrogen dioxide mostly emitted from motor vehicle exhaust, burning of fossil fuels, manufacturing industries and food processing. It is critical pollutant in air as it chemically reacts with other pollutants in the air forming photochemical smog having adverse impacts on public health. Continuous exposure to NO2 causes inflammation in lungs thereby reducing its immunity to lung infection. Reduced immunity may cause frequent and more intense asthama attacks.
Nitrogen dioxide component of air pollution is the lowest in BYN area compared to other locations in the city as evident from Fig 6a. Seasonal impact is clearly visible in the trend line at almost all locations. NO2 content rises during winter season and slight fall is visible during monsoon and summer. Average exposure to NO2 level is the highest in Alopibagh, followed by Johnstonganj and Rambagh.Outliers can be seen in Fig. 6b for Crossing Mahalakshmi Talkiez but they have been included in the study to maintain realism.
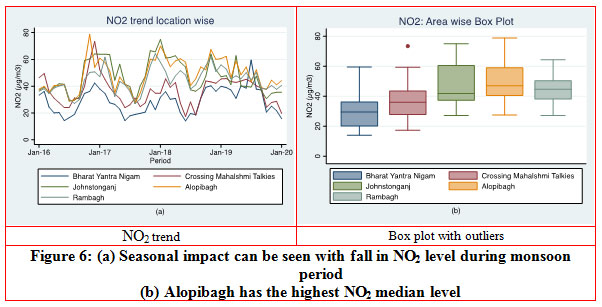 |
Figure 6: (a) Seasonal impact can be seen with fall in NO2 level during monsoon period (b) Alopibagh has the highest NO2 median level Click here to view figure |
Close to 90% correlation can be seen between NO2 level at Alopibagh and Rambagh. Alopibagh, Johnstonganj and Rambagh shows high degree of correlation in NO2 level. However, CMT and BYN exhibits 81% correlation implying that NO2 level between the two location is affected by similar geographical and seasonal factors (Table 3).
Table 3: Correlation of NO2 area wise
|
Corr. |
byn |
cmt |
johnstonganj |
alopibagh |
rambagh |
|
byn |
1 |
||||
|
cmt |
0.81 |
1 |
|||
|
johnstonganj |
0.32 |
0.46 |
1 |
||
|
alopibagh |
0.45 |
0.49 |
0.83 |
1 |
|
|
rambagh |
0.48 |
0.43 |
0.77 |
0.88 |
1 |
NO2 distribution is approximately symmetric at all the locations except CMT. Positive excess Kurtosis at CMT reveals that it has more in the tails than normal distribution (Table 4). Minimum NO2 level is maximum for Alopibagh, Johnstonganj and Rambagh (above 27) highlighting narrow feeder line through which most of automobile passes through.
Table 4: Descriptive statistics of NO2area wise
|
area |
Mean |
Std. Dev. |
skewness |
kurtosis |
Min |
Max |
|
byn |
28.73 |
9.71 |
0.49 |
3.17 |
14.00 |
59.50 |
|
cmt |
36.39 |
10.89 |
0.71 |
4.21 |
17.30 |
73.40 |
|
johnstonganj |
47.25 |
12.52 |
0.36 |
1.88 |
27.10 |
74.98 |
|
alopibagh |
48.84 |
11.59 |
0.22 |
2.45 |
27.50 |
78.80 |
|
rambagh |
44.32 |
9.02 |
0.12 |
2.55 |
27.10 |
64.31 |
Considering three benchmarks of air quality in terms of NO2: clean (10 – 30 µg/m3), moderate (30 – 50 µg/m3) and critical (50 – 80 µg/m3), BYN has least NO2 content in its air followed by CMT. It shows that the area either has wider roads and/or lower vehicular traffic compared to other areas. NO2 content is at critical level for 47 per cent of the time period under study at Alopibagh. This severity of NO2content of air is followed by Johnstonganj and Rambagh. Urgent steps must be taken at CMT as above 60 per cent of the time period shows itsair content to have moderate level of NO2, which if unchecked might come under “Polluted” category(Figure 7).
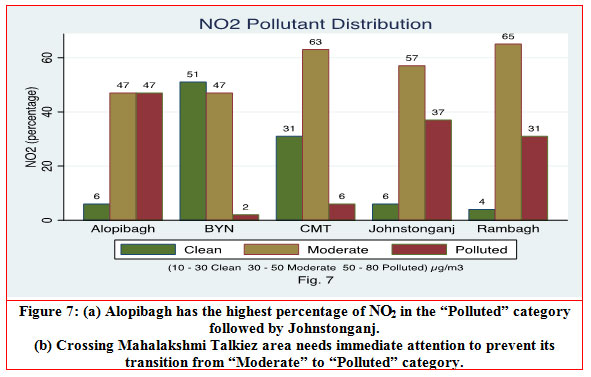 |
Figure 7: (a) Alopibagh has the highest percentage of NO2 in the “Polluted” category followed by Johnstonganj. (b) Crossing Mahalakshmi Talkiez area needs immediate attention to prevent its transition from “Moderate” to “Polluted” category. Click here to view figure |
Pollutant Analysis: Sulphur Dioxide (SO2)
Sulphur dioxide is a gaseous air pollutant which reacts with other compounds forming acid (sulfuric acid, sulfurous acid) and sulfate particles. Sulphur dioxide is emitted from vehicle combustion process, thermal power plants and industrial activities. When inhaled, sulphur dioxide causes breathlessness, irritation in eyes, nose and airways causing coughing and wheezing. Those suffering from asthama are at high risk of getting affected.
Trend shows that SO2 component has spiked above 12 µg/m3 at Rambagh, Johnstonganj and Alopibagh during the onset of winters season in 2016. Similar phenomenon can be witnessed at BYN and CMT during winter season of 2019. It has thereafter remained at higher level throughout the year. Arrival of monsoon does tend to lower SO2 content in the outdoor ambient air quality. SO2 content in air tends to moderate during summer but winters shows clear spike at CMT and BYN during winters of 2019 (Figure 8a).
 |
Figure 8: (a) General trend of increase in SO2 level with fall in temperature can be seen (b) CMT has the highest SO2 median level Click here to view figure |
We can infer from Table 5 that areas closer to each other i.e. Rambagh, Alopibagh and Johnstonganj exhibits very high degree of correlation. Similar observation can be made for SO2 at BYN and CMT as they show higher correlation with each other. CMT and BYN shows slight negative correlation with the rest of other locations (Table 5).
Table 5: Correlation of SO2 area wise
|
Corr. |
byn |
cmt |
johnstonganj |
alopibagh |
rambagh |
|
byn |
1 |
||||
|
cmt |
0.98 |
1 |
|||
|
johnstonganj |
-0.20 |
-0.16 |
1 |
||
|
alopibagh |
-0.09 |
-0.06 |
0.94 |
1 |
|
|
rambagh |
-0.05 |
-0.03 |
0.92 |
0.98 |
1 |
Mean level of SO2 is the highest at CMT followed by BYN. At Rambagh, SO2 is on the lower side. SO2 distribution in air is positively skewed at all the locations. Positive skewness is very high at Rambagh and Alopibagh. Positive excess Kurtosis at all location reveals that it has more in the tails than normal distribution. CMT exhibits higher variance than the rest of the locations (Table 6).
Table 6: Descriptive statistics of SO2 area wise
|
area |
Mean |
Std. Dev. |
skewness |
kurtosis |
Min |
Max |
|
byn |
4.72 |
2.94 |
1.50 |
4.63 |
1.60 |
13.50 |
|
cmt |
5.40 |
3.11 |
1.45 |
4.65 |
2.00 |
15.10 |
|
johnstonganj |
3.63 |
2.60 |
2.65 |
11.38 |
1.58 |
15.50 |
|
alopibagh |
3.87 |
2.72 |
3.24 |
14.20 |
1.70 |
15.80 |
|
rambagh |
3.25 |
2.09 |
3.56 |
16.19 |
1.60 |
12.80 |
Considering three benchmarks of air quality in terms of SO2: less (0 – 3 µg/m3), moderate (3 – 8 µg/m3) and critical (8 – 16 µg/m3), Rambagh has air components relatively free from SO2 for 59 per cent of the entire duration followed by Johnstonganj. SO2 level in air is moderate to critical at CMT and BYN for most of the time period(Figure 13).
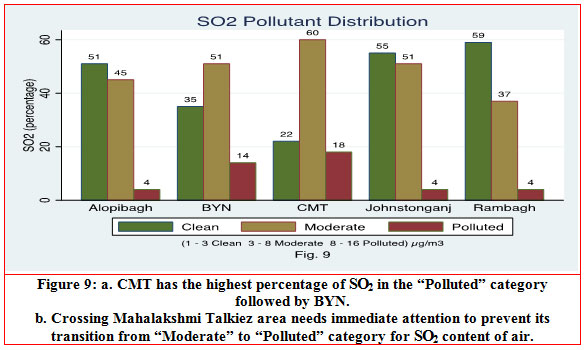 |
Figure 9: (a) CMT has the highest percentage of SO2 in the “Polluted” category followed by BYN. (b) Crossing Mahalakshmi Talkiez area needs immediate attention to prevent its transition from “Moderate” to “Polluted” category for SO2 content of air. Click here to view figure |
Composite Air Qualityat each Station
PM10 sits in our lungs causing upper respiratory problems. Higher exposure to particulate matter can impair development of brain in children24. PM10 causes serious effects on the cardiovascular system25. Exposure to NO2 causes swelling in the inner linings of our lungs resulting in mild shortness of breath and cough26. People suffering from asthma must avoid exposure to NO2 as it causes frequent and sever attacks. An increase in SO2 by 0.005 ppm can cause an increase of emergency room visits for wheezing episodes in children by 12%27.Exposure to SO2 causes shortness of breath and congestion feeling in chest28. Individual pollutants make a cocktail of harmful air quality. To arrive at composite air quality at each station, weights have been allotted to individual pollutants according to Principal Component Analysis, as indicated in the table below.
Table 7: PCA weights
|
Principal Component Weights for pollutants at each location |
|||
|
Area |
PM10 |
NO2 |
SO2 |
|
byn |
0.5564 |
0.3099 |
0.1337 |
|
cmt |
0.4925 |
0.3215 |
0.1861 |
|
johnstonganj |
0.5419 |
0.3512 |
0.1069 |
|
alopibagh |
0.5297 |
0.3733 |
0.097 |
|
rambagh |
0.465 |
0.3643 |
0.1707 |
Air quality at each station is calculated by multiplying pollutants with corresponding weights. Below equation represents the methodology for arriving at air quality.
AQi=W1×PM10+W2×NO2+W3×SO2
AQi=Air Quality at individual locations/station
Composite air quality at each station is further studied for frequency distribution under four categories i.e. Clean (20 – 50 µg/m3), Moderate (50 – 90 µg/m3), Satisfactory (90 – 150 µg/m3) and Critical (10 – 50 µg/m3). Based on these categories, air quality percentage distribution chart is formed for all locations in the city (Figure 10). Below chart indicates that air quality at Alopibagh is at critical level for around 45 percent of the period followed by Johnstonganj for 29 per cent of the duration. Air quality at BYN is of gretar significance as above 85 percent of time, air quality is satisfactory. It may soon experience greater proportion of time under critical category if proper steps for air pollutants control is not taken.
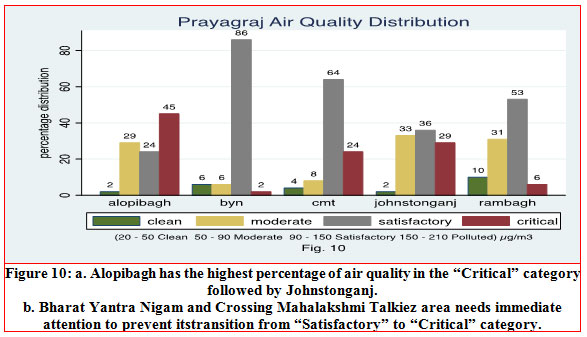 |
Figure 10: (a) Alopibagh has the highest percentage of air quality in the “Critical” category followed by Johnstonganj. (b) Bharat Yantra Nigam and Crossing Mahalakshmi Talkiez area needs immediate attention to prevent itstransition from “Satisfactory” to “Critical” category. Click here to view figure |
Figure 11 is clearly indicative of improvement in the air quality during monsoon season as air pollution falls with the arrival of rainy season. However it must be noted that the magnitude of improvement has slowly reduced during the last two years. Post monsoon, air pollutants content return their normal level of 100 – 150 µg/m3 which is a worrisome scenario.
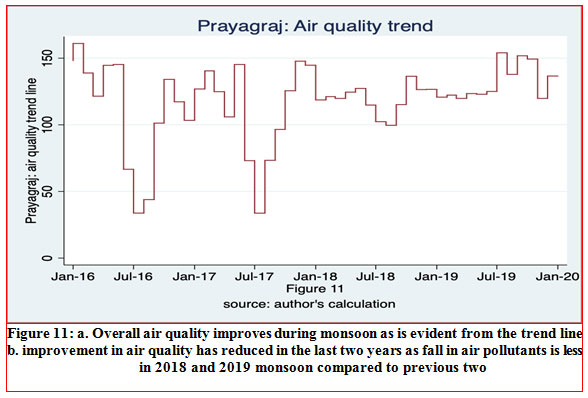 |
Figure 11: (a) Overall air quality improves during monsoon as is evident from the trend line (b) improvement in air quality has reduced in the last two years as fall in air pollutants is less in 2018 and 2019 monsoon compared to previous two Click here to view figure |
Conclusion and Suggestions
The study is purposive as Prayagraj is neither a metro nor a town, neither industrial nor rural. It is more traditional, historical and cultural town surrounded by many semi – rural and semi – urban settlements. Pollution level is measured at five places which although are different in settlements, density and traffic but contagious and so clear-cut demarcation cannot be made between them for the level of pollutants. So, the conclusions drawn cannot be generalized, yet provide important lessons for the policy makers and administrators. The main conclusions can be summarized as following:
- Seasonal impact can be seen on PM10, NO2and SO2 level during monsoon period. The general trend has been that air becomes more cleaner during monsoon. NO2 and SO2 picks up during winter while PM10 content of air rises during summer.
- CMT area has the highest PM10 median level followed by Alopibagh.Dust particles due to construction activity needs to be regulated stringently. General direction by the authority should be issued to pause construction during summer season and stocking of sands, cements and pebbles should be allowed in closed space away from roadside. Covering of construction site can check PM10.
- Bharat Yantra Nigam (BYN) and Crossing Mahalakshmi Talkiez area needs immediate attention to prevent its transition from “Moderate” to “Polluted” category in terms of NO2 and SO2 respectively.Roadside eateries and food joints should be forced to have smokeless bhatties. Traffic management is the key to curb nitrogen dioxide and sulphur dioxide. Diesel vehicles like autos and Vikrams should be replaced by E – rickshaws or original manual rickshaws. Urban alleviated viaducts can be used to reduce the impact of pollutants29.
- Based on the composite air pollution, we conclude that Alopibagh has the highest percentage of air quality in the “Critical” categoryfollowed by Johnstonganj. Bharat Yantra Nigam and Crossing Mahalakshmi Talkiez area needs immediateattention to prevent its transition from “Satisfactory” to “Critical” category.Studies related to air pollution tolerance of plants in Prayagraj30 suggests that plant species named MagniferaIndica has the highest tolerance to air pollutants followed by Aegle Marmelos. These plants must be widely grown along the roadsides.
- Overall air quality improves during monsoon as is evident from the trend line. However, improvement in air quality has reduced in the last two years as fall in air pollutants is lessin 2018 and 2019 monsoon compared to previous two years.
Environmental degradation and increased pollution (air, sound, water) are probably the most discussed, negotiated and diluted issues of 21st century. Seriousness of such environmental threat should be understood well. Time lag between implementation of regulation and introduction of technology is significant in Asian countries compared to European environments31. There is a lot of scope to reduce this time lag for quick redressal towards air pollution. GIS based pollution studies is widely gaining traction. It will be interesting to see what conclusions are arrived at on the basis of GIS study. It will provide holistic study of air pollution in Prayagraj given the lack of coverage of ground based air monitoring stations.
Acknowledgement
I wish to express my sincere gratitude to my guide, Professor Manmohan Krishna, Department of Economics, University of Allahabad for guiding me and through the paper. I also wish to thank my family members and my colleagues for their support and encouragement and continuous push to complete my research paper.
Funding Source
This research paper is completely funded by me with no conflict of interest with any party.
References
- Bentham, G. (1992). Global climate change and humanhealth. GeoJournal, 26, 7–12.
CrossRef - Hong, Y. C., Lee, J. T., Kim, H., & Kwon, H. J. (2002). Air pollution: A new risk factor in ischemic stroke mortality. Stroke, 33(9), 2165-2169.
CrossRef - Beggs, P. J. and Bambrick, H. J. (2005). Is the global rise of asthma an early impact of anthropogenic climate change? Environmental Health Perspectives, 113, 915–919.
CrossRef - http://www.emro.who.int/media/news/9-out-of-10-people-worldwide-breathe-polluted-air.html
- Health Effects Institute. 2019. State of Global Air 2019. Special Report. Boston, MA:Health Effects Institute.
- Genc, Sermin&Zadeoglulari, Zeynep & Fuss, Stefan &Genc, Kursad. (2012). The Adverse Effects of Air Pollution on the Nervous System. Journal of toxicology. 2012.
CrossRef - Wang, Kefeng& Lombard, Joanna &Rundek, Tatjana& Dong, Chuanhui& Gutierrez, Carolina & Byrne, Margaret & Toro, Matthew &Nardi, Maria &Kardys, Jack & Yi, Li &Szapocznik, José & Brown, Scott. (2019). Relationship of Neighborhood Greenness to Heart Disease in 249 405 US Medicare Beneficiaries. Journal of the American Heart Association.
CrossRef - WHO, 2005
- American Academy of Pediatrics, 2004
- State of Global Air, 2019
- WHO 2014a, 2016a
- Fifth Assessment Report, IPCC
- Atkinson, R. & Cohen, A. & Mehta, S. & Anderson, H.. (2011). Systematic review and meta-analysis of epidemiological time-series studies on outdoor air pollution and health in Asia. Air Quality, Atmosphere & Health. 5. 1-9. 10.1007/s11869-010-0123-2.
CrossRef - Climate Change (NIEHS, 2016)
- Lancet Planet Health, 2019
- Airpocalypse: Assessment of Air Pollution in Indian Cities (2017) GreenpeaceInfluence of meteorology on PM10 trends and variability inSwitzerland from 1991 to 2008 (Barmpadimos, C. Hueglin, J. Keller, S. Henne, and A. S. H. Pr´evˆot)
- I. Barmpadimos, C. Hueglin, J. Keller, S. Henee, A, PrécÈt. Influence of meteorology on PM10 trends and variability in Switzerland from 1991 to 2008. Atmo. Chem. Phys. 2011, 11: 1813-1835.
CrossRef - 2018 World Air Quality Report
- Srivastava D, Vaishya RC. Temporal variation of atmospheric pollutants a case study of Allahabad city (India). J Environ Sci Eng. 2013 Apr;55(2):143-52. PMID: 25464690.
- http://www.uppcb.com/ambient_quality.htm
- Census of India 2011, Uttar Pradesh, District Census Handbook Allahabad, Series 10 Part XII - B
- WHO: Global Urban Ambient Air Pollution database 2016 update
- Prayagraj: City Development Plan (2015)
- WHO 2018: Air pollution and child health: prescribing clean air
- Air Pollution and Cardiovascular Disease Sanjay Rajagopalan, Sadeer G. Al-Kindi, Robert D. Brook J Am CollCardiol. 2018 Oct, 72 (17) 2054-2070.
CrossRef - Agency for Toxic Substances and Disease Registry: Medical management guidelines for Nitrogen Oxides
- Buchdahl R, Parker A, Stebbings T, Babiker A. Association between air pollution and acute childhood wheezy episodes: prospective observational study. BMJ. 1996;312(7032):661-665. doi:10.1136/bmj.312.7032.661.
CrossRef - Witek TJ Jr, Schachter EN, Beck GJ, Cain WS, Colice G, Leaderer BP. Respiratory symptoms associated with sulfur dioxide exposure. Int Arch Occup Environ Health. 1985;55(2):179-83.
CrossRef - Cai, Ming & Huang, Yao & Wang, Zhanyong. (2020). Dynamic three-dimensional distribution of traffic pollutant at urban viaduct with the governance strategy.
CrossRef - Kuddus, Mohammed &Kumari, Rashmi&Ramteke, Pramod. (2011). Studies on air pollution tolerance of selected plants in Allahabad city, India. Journal of Environmental Research and Management.
- Gautam S, Kumar P, Yadav A, Tsai CJ. 2016.A review on recent progress in observations, sources, classification and regulations of PM2.5 in Asian environments. Environmental Science and Pollution Research.
CrossRef


