Valve Position Control under pH Influence for PM Evapotranspiration Model
Corresponding author Email: faruk.poyen@gmail.com
DOI: http://dx.doi.org/10.12944/CWE.15.2.12
Copy the following to cite this article:
Poyen F. B, Ghosh A, Kundu P. Valve Position Control under pH Influence for PM Evapotranspiration Model. Curr World Environ 2020; 15(2).
DOI:http://dx.doi.org/10.12944/CWE.15.2.12Copy the following to cite this URL:
Poyen F. B, Ghosh A, Kundu P. Valve Position Control under pH Influence for PM Evapotranspiration Model. Curr World Environ 2020; 15(2). Available from: https://bit.ly/3bkwgXb
Download article (pdf)
Citation Manager
Publish History
Select type of program for download
| Endnote EndNote format (Mac & Win) | |
| Reference Manager Ris format (Win only) | |
| Procite Ris format (Win only) | |
| Medlars Format | |
| RefWorks Format RefWorks format (Mac & Win) | |
| BibTex Format BibTex format (Mac & Win) |
Article Publishing History
| Received: | 10-02-2020 |
|---|---|
| Accepted: | 07-05-2020 |
| Reviewed by: | 
 Seyed Mostafa Biazar
|
| Second Review by: |

 Omid Aminoroayai Yamani
|
| Final Approval by: | Dr Hiren B Soni |
Introduction
Evapotranspiration is defined as the loss of surface water from field and water bodies in the form of both evaporation and transpiration. Studies has revealed the underground freshwater storage is quickly getting exhausted.1 Also due to different types of contamination, like Arsenic and other heavy metals, the natural salinity and pH are getting altered.2 Due to the high salinity content, the evaporation rate is getting influenced and it is causing a change in the hydrological cycle.3 Water loss due to evapotranspiration (ET) contributes significantly in resulting crop-water stress. Adequate water has to be supplied so that the crop-water stress is nullified and water wastage due to inundation of the field can be reduced. There exist a lot of method for the determination of evapotranspiration but the Penman-Monteith FAO 56 (PM FAO 56) is the most widely accepted method4 in determining the ET losses. The PM FAO 56 model is principally dependent on five climatic factors which are atmospheric temperature, wind speed, relative humidity, solar radiation and atmospheric pressure. Crop type, nature of the soil, the growth stage of the crop also contribute to the ET loss, but the effects are negligible. The soil has its own pH value depending on the macro and micro mineral composition and also gets affected by the crops be cultivated on it. Reference Evapotranspiration is the loss registered by an extensive surface having uniform crop coverage of 0.12-meter height, adequately and fully shading the ground.5-8
The PM FAO 56 method is also known as the combination method and it can determine the ET losses based on five meteorological parameters which are air temperature, wind speed, solar radiation, relative humidity, and atmospheric pressure. The accuracy of measurement is very good although the results vary based on the geographical locations and other factors like leaf area index, canopy index and others. The PM equation9 is shown in (1).

ET0 = Reference evapotranspiration [mm day-1],
Rn = Net radiation at the crop surface [MJ m-2 day-1],
G = Soil heat flux density [MJ m-2 day-1],
T = Mean daily air temperature at 2 m height [°C],
u2 = Wind speed at 2 m height [m s -1],
es = Saturation vapor pressure [kPa],
ea = Actual vapor pressure [kPa],
es-ea = e0(T) = Saturation vapor pressure deficit [kPa],
D = D = Slope vapor pressure curve [kPa °C-1],
g = g = Psychometric constant [kPa °C-1].
P = Atmospheric pressure [kPa],
z = Elevation above sea level [m],
e0 (T) = Saturation vapour pressure at the air temperature T [kPa],
λ = Latent heat of vaporization, 2.45 [MJ kg-1],
Cp = Specific heat at constant pressure, 1.013 10-3 [MJkg-1 °C-1],
ε = Ratio molecular weight of water vapour/dry air =0.622
On successful determination of how much water is lost due to evapotranspiration, it is important to take into account of the water quality that is to be supplied to compensate for this loss. A decision support system is built based on Fuzzy logic 10 to equip the control module of the model to make the necessary decisions.Regions which receive high seasonal rainfall develop acidic soil with a pH of 5.5 and less due to leaching of minerals like Calcium, Magnesium, Potassium and Sodium. Again humid regions with higher evaporation rates than precipitation also lead to acidic soil.11-13 The toxicity of H+ ions proves to a limiting factor for proper growth of vegetation.14 Soils across different regions have their own pH values that can be both acidic and alkaline. On supplementing the acidic soil with water in the acidic pH domain or vice versa, further deteriorates the condition. Neutralizing effects or sufficient time between watering interval and rate can reduce this noxiousness. The soil pH levels cannot be altered in a short period of time. Therefore regulating the water flow mitigates the situation significantly.
In subsequent sections, we will illustrate the model designed based on fuzzy rule-base in the materials and methods section, discussion on the results obtained and finally the conclusion.
Materials and Methods
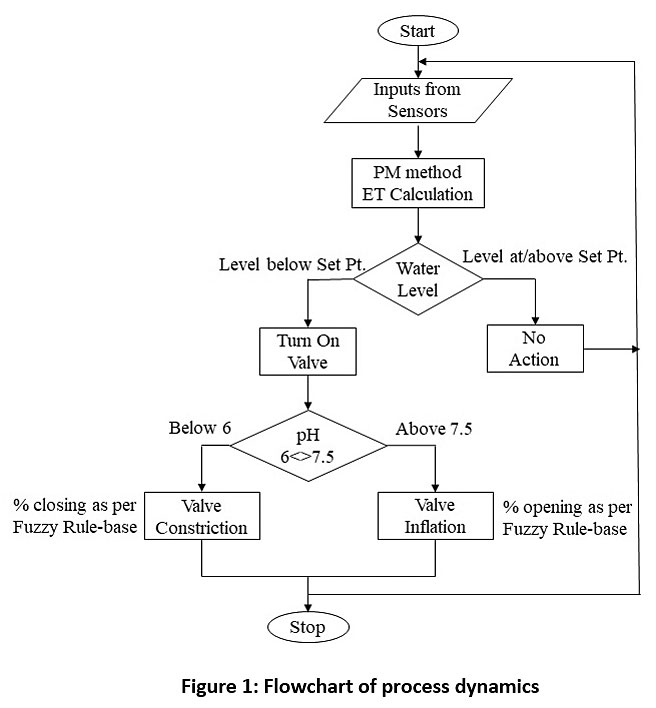
As two factors are to be considered for proper utilization of water, also maintaining favourable mixing conditions, firstly the ET loss is determined by feeding on the required meteorological data to the PM FAO 569 model. Once the ET estimation block is configured, different acid combinations are generated to simulation a dummy environment. The output of the function block “detphwfd” emulates a practical scenario of water flow. The fuzzy controller runs a rule-base for different combinations of water-soil pH mixes. The fuzzy rule-base takes into consideration of the different sources of water and their pH values, and also keeps a knowledge-base to predict what value of pH is best suited for any particular crop type. This exhaustive knowledge-base then create the different valve positions which will function to provide the best possible results. The precision of the controller largely depends on how comprehensive the rule-base of the controller is. The flowchart as shown Fig 1 below depicts the process dynamics.
 |
Figure 1: Flowchart of process dynamics Click here to view Figure |
A thorough illustration of the operation is elucidated in the algorithm. The algorithm dictating the terms for the control logic is given as below.
Step 1: The water deficiency is calculated by the PM FAO model.
Step 2: This data is forwarded to the control block, and provided with two separate disturbances of Gaussian followed by Rayleigh, to simulate a practical environment compensating for other factors.
Step 3: “detphwfd" function generates numerous combinations of the effluent water that vary from strongly acidic to strong alkaline.
Step 4: The second logic controller instructs the final control element to regulate the opening based on the influent nature, to maintain a proper mix between the acidic and alkaline compositions.
Step 5: The valve position is observed under conditions of acidic and alkaline water supply.
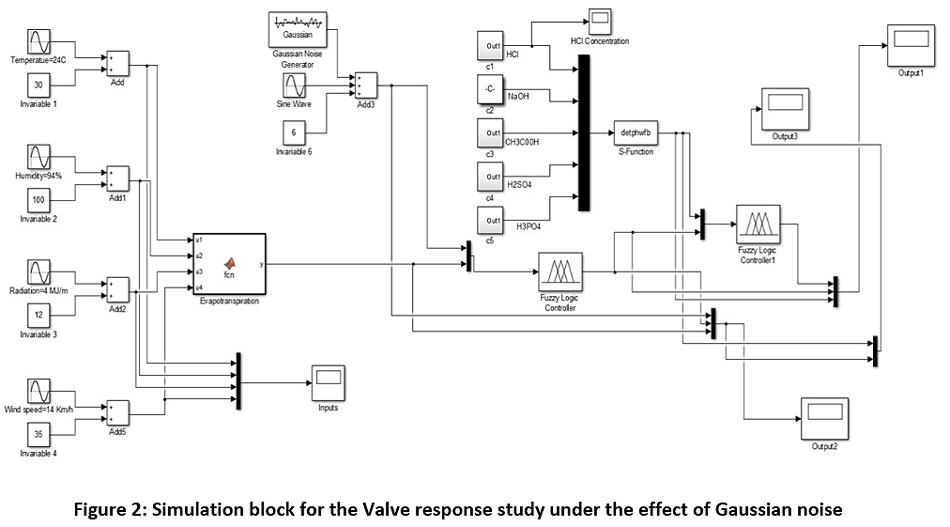
The model block diagram of two different noise components is illustrated in Fig 2 and 3.
 |
Figure 2: Simulation block for the Valve response study under the effect of Gaussian noise Click here to view Figure |
 |
Figure 3: The valve opening study in the presence of Rayleigh noise Click here to view Figure |
Results and Discussion
The simulation results are recorded to check and validate for satisfying the aimed objective. Fig 4 corroborates the input response obtained from the imitative meteorological dataset. The output response of the "detphwfd" is obtained in Fig 5, with a zoomed-in response shown in Fig 6 indicating that acid response of the mix considerably dominant over the alkaline response. The reason for this kind of output is that titration simulation was carried out between strong acids and weak bases.
 |
Figure 4: Response of the Evapotranspiration Model Click here to view Figure |
 |
Figure 5: Output response of “detphwfd” Click here to view Figure |
 |
Figure 6: Zoomed in the response of the acid-base mix Click here to view Figure |
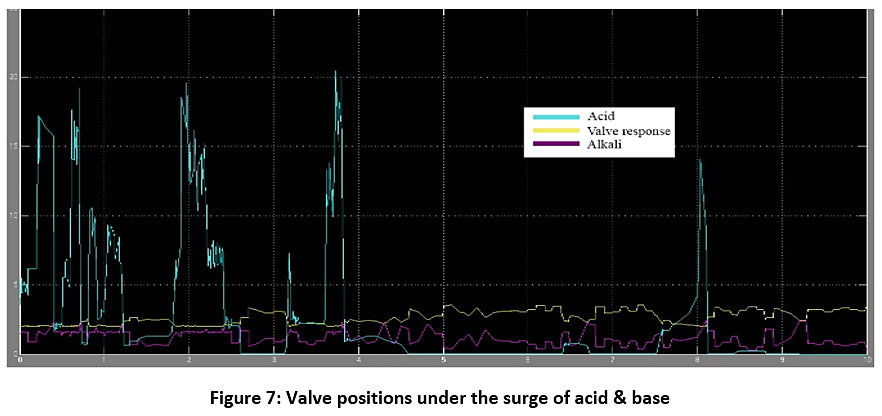
It is evident from Fig 7 that the valve deflates and inflates on encountering surge of acidic flow and alkaline flow, respectively.The reason behind restricting the water flow in case of high acidity is that, normally the farm lands which are situated in tropical to sub-tropical areas are rich in micro-nutrients which make up for the soil pH and make it acidic. High flow of acidic water will not provide sufficient time to the soil surface to adjust and materials like aluminum and others will form a precipitation layer blocking the root-zones necessary for mineral absorption. As the controller has considered the soil type under study to be acidic in nature, when the source of water is alkaline in nature, this leads to a natural process of neutralization and hence the valves not restricted.
 |
Figure 7: Valve positions under the surge of acid & base Click here to view Figure |
Conclusion
The model designed has two functional blocks, one for the determination of ET loss, followed by valve-position control to regulate the water flow based on the rule-base determining numerous combinations of water-soil pH. Weather data as recorded by the sensors are fed to the PM ET block which determines the water loss and hence compensation required. And as the valve opens to compensate for the water loss, sensor measures the pH value of water and the controller operates on the position control of the valves by restricting and inflating with acidic and alkaline surge respectively. This model is therefore capable to monitor and control the flow of water maintaining the desired levels along with determination of water loss due to evapotranspiration. The pH of the soil-water combination is kept between 6 and 7.5 which is optimal for any cultivation. The results obtained are satisfactory and therefore the next step is to implement the prototype model of this controller for field validation.
Acknowledgement
We express our sincere thanks and gratitude to the Dept. of AEIE, UIT, The University of Burdwan and Dept. of Electrical Engineering, FET, Jadavpur University for their infrastructural and logistic support. This study would not have been possible without the laboratory facilitation of the mentioned departments.
Funding
The author(s) received no financial support for the research, authorship, and/or publication of this article.
Conflict of Interest
The authors do not have any conflict of interest.
References
- Hashemi, M., Mazandarani Zadeh, H., Daneshkare Arasteh, P., & Zarghami, M. (2019). Economic and Environmental Impacts of Cropping Pattern Elements Using Systems Dynamics. Civil Engineering Journal, 5(5), 1020-1032. doi: 10.28991/cej-2019-03091308
- Solangi, G., Siyal, A., & Siyal, P. (2019). Analysis of Indus Delta Groundwater and Surface water Suitability for Domestic and Irrigation Purposes. Civil Engineering Journal, 5(7), 1599-1608. doi: 10.28991/cej-2019-03091356
- Obianyo, J. (2019). Effect of Salinity on Evaporation and the Water Cycle. Emerging Science Journal, 3(4), 255-262. doi: 10.28991/esj-2019-01188
- Allen, R. (1998). Crop evapotranspiration (pp. 300-305). Rome: FAO. ISBN: 92-5-104219-5
- Doorenbos, J., & Pruitt, W. (1977). Guidelines for predicting crop water requirements (pp. 59-62). Rome: Food and Agriculture Organization of the United Nations. ISBN: 92-5-100279-7
- Burman, R., & Pochop, L. (1994). Evaporation, evapotranspiration and climatic data (pp. 45-53). Amsterdam: Elsevier. ISBN: 0444819401
- Jensen, M., Burman, R., & Allen, R. (1990). Evapotranspiration and irrigation water requirements (pp. 295-300). New York, N.Y.: The Society. ISBN: 0-87262-763-2
- Poyen, F., Ghosh, A., & Kundu, P. (2016). Review on Different Evapotranspiration Empirical Equations. International Journal Of Advanced Engineering, Management And Science, 2(3), 17-24. ISSN: 2454-1311
- Poyen, F., Ghosh, A., Kundu, P., & Sen, K. (2016). Analysis of Evaluation Stages Involved in Penman Monteith Equation. Sensors & Transducers Journal, 202(7), 83-88. ISSN: 2306-8515
- George, B., Reddy, B., Raghuwanshi, N., & Wallender, W. (2002). Decision Support System for Estimating Reference Evapotranspiration. Journal Of Irrigation And Drainage Engineering, 128(1), 1-10. doi: 10.1061/(asce)0733-9437(2002)128:1(1)
- Charman, P., & Murphy, B. (2007). Soils (2nd ed., pp. 113-120). South Melbourne: Oxford University Press. ISBN: 0195517628
- Nikita. (2020). Acid Soils: Origin, Classification, Effects and Reclamation. Retrieved 18 January 2020, from http://www.biologydiscussion.com/soil/acid-soils-origin-classification-effects-and-reclamation/7189
- Allaway, W. (1957). Soil, the 1957 yearbook of the Department of Agriculture (p. 748). Washington, D.C: The United States Department of Agriculture.
- P., & Proctor, J. (2001). Why plants grow poorly on very acid soils: are ecologists missing the obvious?. Journal Of Experimental Botany, 52(357), 791-799. doi: 10.1093/jexbot/52.357.791


