Environmental Assessment of Imiringi River in South-South Nigeria: The Water Quality Index Approach
Ayobami Aigberua1
*
 , Timi Tarawou1
and Young Erepamowei1
, Timi Tarawou1
and Young Erepamowei1
http://dx.doi.org/10.12944/CWE.15.1.09
The water quality index (WQI) is important because it aids in understanding complex water quality data. Hence, WQI of Imiringi River was evaluated in order to classify quality grade of the water in unambiguous terms. Apart from seepages emanating from oil installations that are located further upstream of Oswan community, dumpsite leachates and agricultural run-offs are some of the likely nonpoint sources of pollution. Because the river ebbs away during the dry term, samples were collected in the rainy period of August 2019 at duplicate points across five field locations. Physical and chemical tests were carried out for ten (10) water samples following standard analytical protocols. Results obtained are: conductivity (32.7 ± 2.7 µs/cm), iron (2.57 ± 0.53 mg/L), dissolved solids (18.1 ± 1.4 mg/L), pH (5.2 ± 0.1), alkalinity (1.1 ± 0.1 mg/L), hardness (1.4 ± 0.2 mg/L), calcium (0.34 ± 0.03 mg/L), magnesium (2.08 ± 0.32 mg/L), dissolved oxygen (10.5 ± 0.7 mg/L), chloride (9.8 ± 0.7 mg/L), nitrate (0.12 ± 0.04 mg/L) and biochemical oxygen demand (0.36 ± 0.08 mg/L). Generally, iron and pH values fell short of regulatory standards while pH represented the most significantly varying parameter (p < 0.05) across all locations owing to human influences and dilution effects across the watercourse. Also, conductivity and dissolved solids depicted the strongest inter-parameter association. Overall, the downstream section of river revealed the poorest water quality condition while the entire river stretch was classified as being unsuitable for drinking even though it can support aquatic life.
Copy the following to cite this article:
Aigberua A, Tarawou T, Erepamowei Y. Environmental Assessment of Imiringi River in South-South Nigeria: The Water Quality Index Approach. Curr World Environ 2020; 15(1).
DOI:http://dx.doi.org/10.12944/CWE.15.1.09Copy the following to cite this URL:
Aigberua A, Tarawou T, Erepamowei Y. Environmental Assessment of Imiringi River in South-South Nigeria: The Water Quality Index Approach. Curr World Environ 2020; 15(1). Available from: https://bit.ly/2VUGh7R
Download article (pdf)
Citation Manager
Publish History

Introduction
In Nigeria, the poor structure and framework for the utilization of gas deposits associated with crude oil drilling has led to the continuous flaring of reusable gases (Ajugwo, 2013; Ifenkwe et al., 2018) and the consequent loss of foreign exchange earnings to the country. Following the presence of numerous gas flaring stacks at Imiringi community, some of the most affected environmental aspects include the surrounding vegetation, agricultural farm lands and the overall health of nearby rural settlers (Olukoya, 2013). Generally, the Niger Delta environment is vastly impacted from oil and gas drilling activities; consequently, gaseous wastes associated with drilled oil is continuously flared leading to public health concerns, ozone layer depletion, poor agricultural yield, global warming and green house consequences within operational areas (Raji and Abejide, 2013). Furthermore, the continuous occurrence of oil spills emanating from either equipment failure or sabotage has often led to unresolved conflicts between host communities and oil industries operating in the area. At the period of sampling, the Imiringi River was been influenced by the potential redistribution of spilled crude oil from the river cross-section between Otuasega and Imiringi river, located further upstream of Oswan sub-community. Also, the river receives effluents from agricultural run-offs from cassava and vegetable crop cultivation along the banks of the water stretch. However, heavy metal pollution indices have been reported below the critical index limit (100) irrespective of seasonal variations as long as there is constant flow of the river course across the different seasons (Matta et al., 2018a).
While the provision of clean water remains a worldwide concern, river water quality is constantly under the threat of various waste streams which include domestic squanders, abattoir effluents, industrialized emissions, human’s faecal dung, tourism, amongst others (Adewoye, 2010; Aigberua et al., 2017; Matta et al., 2018b; Aigberua and Tarawou, 2019). Usually, overall water quality aids in the categorization of water according to the suitability of purpose, for instance, identifying those suitable for public consumption, biodiversity sustenance, agricultural and irrigation purposes. Surface waters are the most prevalent water sources in most rural/urban communities of developing nations. Usually, water from these sources is prone to domestic, agricultural and industrial waste contamination, which in turn results in the spread of water-borne diseases (Akoteyon et al., 2011). For example, surface waters from Warri metropolis have been reported to show the positive populations of faecal coliform bacteria which may have originated from the dead remains of intestines from various species of aquatic animals. This may be attributed to poor waste management practices amongst rural dwellers along coastal communities (Asibor and Ofuya, 2019). Hence, describing the true quality of water environments by physicochemical attributes alone may not be sufficient without the incorporation of microbiological parameters (Olasoji et al., 2019). In addition, the compliance of water quality indicator parameters to regulatory limits does not independently determine the true condition of public water supply.
In view of the persistent degradation of water quality resulting from oil and gas activities, the current quality status of Imiringi River was evaluated in comparison to recent studies in the area. This was done to determine the extent of cross-contamination of spilled oil from a connecting creek, while measuring the impact on physicochemical parameters and the resulting water quality index along the downstream flow direction of the river.
Materials and Method
Study Area and Sample Collection
Bayelsa state which is situated in the Niger Delta zone of South-South Nigeria is known for its vast oil and gas reserves and characterized by the heavy flux of oil and gas related activities (Ajugwo, 2013; Ifenkwe et al., 2018). Imiringi is a community in Ogbia local government area of Bayelsa State, within the South-South Niger Delta region of Nigeria. The Imiringi River stretches across the entire Imiringi town. The river is connected upstream to Otuasega and Oruma communities which play host to oil installations, while its downstream section is linked to Emeyal 1 and 2, with further link to Kolo creek. The river lies between latitude 04.8788, longitude 06.3758 at the upstream end, and latitude 04.8527, longitude 06.3703 at the downstream zone. It is bound by neighbouring settlements such as Oswan, Olem, Obodo and Agothoman amongst others. The river serves the residents for fishing and recreational activities before ebbing away during the dry season. The river bank is also massively used for the cultivation of cassava and other vegetable crops. Its climate is characterized by dry and rainy periods with temperatures tending to 35oC all year round (Okafor and Opuene, 2006). Water samples were collected along the flow direction of river from upstream at Oswan sub-community to the downstream area at Agothoman. The sampling design aimed to capture the impact of redistributed spilled oil on average water quality indicators at sub-community levels, whilst considering the water flow course. Also, sampling was carried out in the month of August 2019 to represent the rainy season and ascertain the contribution of heavy rainfall and increased water movement on the redistribution of contaminants. Apart from the upstream community of Oswan, where four (4) representative samples were collected as two (2) distinct duplicates at two spatially varying locations of Oswan 1 and 2. Also, two (2) samples were collected at each of the other three sub-communities at Olem, Obodo and Agothoman. All samples were collected along the direction of river flow from upstream to downstream. Samples were collected in clean 1 litre plastic containers (for physicochemical components), two of 100 mL narrow-stemmed amber bottles (for Dissolved Oxygen and Biochemical Oxygen Demand) and 100 mL plastic vials acidified with nitric acid, HNO3 (for iron, calcium and magnesium analysis). In-situ readings were recorded in the field, while samples were kept in ice coolers prior to laboratory transit.
Statistical Analysis
Statistical package for social science (SPSS) version 20 was used to evaluate the affiliation and differences among the various physical and chemical parameters been assessed in the surface waters of Imiringi river. Data was recorded as mean ± standard deviation. The scope (minimum and maximum) of values obtained across sampling points was also presented. One way analysis of variance (ANOVA) was used to reveal significant variation at P < 0.05. In the event of having significant differences, Waller-Duncan statistics was used to compare mean values of test parameters being investigation.
Physicochemical tests of water
Test procedures for the analysis of water samples are as described in Standard Methods for the Examination of Water and Wastewater (APHA, 1998) and as cited in Aigberua and Tarawou, (2019).
Physicochemical parameters such as electrical conductivity (EC), total dissolved solids (TDS), pH, total alkalinity (TA), total hardness (TH), iron (Fe), calcium (Ca), magnesium (Mg), dissolved oxygen (DO), chloride (Cl-), nitrate (NO3-) and biochemical oxygen demand (BOD5) were tested. Parameters such as pH, EC and TDS were measured electrometrically using standard calibrated HANNA HI model meters. DO and BOD5 were titrimetrically determined after fixation with winkler solutions at day 1 (for DO) and day 5 (for BOD5) respectively. The calculated difference between DO (Day 1) and (Day 5) was recorded as BOD5 concentration in mg/l units. TA, TH and Cl- concentrations were titrimetrically determined. NO3- colorimetrically determined. Fe, Ca and Mg concentrations were determined after a wet digestion process using nitric acid. This was followed by aspiration into an atomic absorption spectrometer (Aigberua and Tarawou, 2019). Water quality index calculations were applied similar to the works of Aigberua and Tarawou, (2019); Oshurhe et al. (2014); Qureshimatva et al. (2014); Thakor et al., (2011).
 |
Table 1: Set-up of the atomic absorption spectrophotometer Click here to view Table |
Table 1 shows the optimum working conditions of the atomic absorption spectrometer. The parameters above represent the recommended manufacturer settings for obtaining consistent and repeatable data on the GBC Avanta PM A6600 AAS.
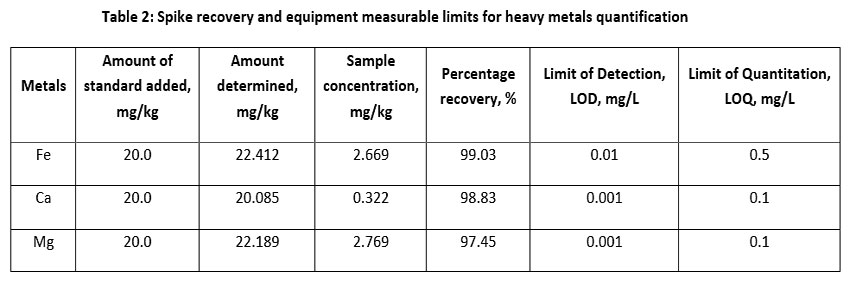 |
Table 2: Spike recovery and equipment measurable limits for heavy metals quantification Click here to view Table |

Quality considerations for trace/heavy metals analysis
A key quality protocol which was used to validate metal extraction method was spike recovery. A minute amount of a high concentration test metal standard was added to a measured volume of water sample. A spiked portion of the water sample and another without spike was analyzed for metals of interest. The difference in sample concentrations was calculated from the volumes and actual concentration amount of known solution. The % spike recovery is the % measured difference compared to the calculated difference. The percentage spike recoveries of the different metals are listed in Table 2. The values obtained were within the acceptable range of 97.45 to 99.03%.
Calculation of Water Quality Index (WQI)
The water quality indicator was computed in a stepwise manner. This was based on methods previously applied by Aigberua and Tarawou (2019); Oshurhe et al., (2014); Qureshimatva et al., (2014); Thakor et al., (2011). For this work, unit weights were assigned to each of the twelve (12) test parameters (EC, TDS, pH, TA, TH, Fe, Ca, Mg, DO, Cl-, NO3- and BOD5).
Firstly, unit weight (Wn) was annotated by applying the equation:

Where,
Sn = standard regulatory limit of nth water quality variable.
k = proportionality constant, calculated as:
Secondly, the proportionality constant (k) was determined using the equation:
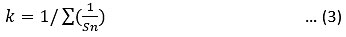
Where;
Sn = 1, 2,…..n water quality test parameters
Thirdly, the quality rating (Qn) was calculated using the formula:

Where,
Vn = Measured value of nth water quality parameter for test sample.
Vid = Ideal value for nth parameter (assuming water is ideally pure).
(Vid values are: pH = 7, DO = 14.6, other water parameters = 0)
Sn = Standard regulatory limit of nth water quality parameter.
Finally, WQI is calculated using the expression:

Where,
Qn = quality rating of nth water quality test parameter.
Wn= unit weight of nth water quality test parameter.
The quality rating Qn is calculated using the mathematical expression in Equation 4.
 |
Table 4: Water quality index ranges and respective status Click here to view Table |
Result and Discussion
Water quality test results were prevalently similar across the different spatial locations of Imiringi River (Table 5). Iron concentrations ranged from 2.00 mg/L to 3.31 mg/L across the study locations. The highest amount of dissolved iron was reflected in Obodo community, which is downstream of the river flow direction. Meanwhile, the least iron level was recorded in the midstream field area of Olem community. In addition, calcium concentration ranged between 0.31 mg/L and 0.37 mg/L. The highest calcium mineral content was observed at the midstream and downstream communities of Olem and Obodo respectively, while the least concentration was observed at the farthest downstream location of Agothoman community. Furthermore, magnesium levels spanned from 1.59 mg/L to 2.39 mg/L with the least and most concentrations recorded at the upstream area (Oswan 2 community) and downstream location (Agothoman community). Overall, communities located downstream of the river depicted the most distribution of trace/heavy metals. The result of this study is similar to Egun and Ogiesoba-Eguakun (2018) that reported iron and calcium to exceed permissible limits of Nigerian Standard for Drinking Water Quality (NSDWQ) and World Health Organization (WHO) in the Okhuarhe River in Edo state, Nigeria. These trends may have resulted from the increased tidal movement of water and its impact in the translocation of micropollutants. In partial similarity to this study, Aigberua and Tarawou (2019) had reported the most calcium and magnesium enrichment of Taylor creek at the midstream location of Obunagha and upstream area of Polaku communities respectively.
Electrical conductivities (EC) ranged between 31.00 µS/cm and 37.50 µS/cm, showing no significant variation (p > 0.05) across spatial variations. Iron (Fe) levels ranged from 2.00 mg/L to 3.31 mg/L (Table 5) and all sampling locations reflected no significant difference (p > 0.05) in iron distribution. Similarly, total (TDS), total hardness (TH), magnesium (Mg), dissolved oxygen (DO), nitrate (NO3-) and biochemical oxygen demand (BOD5) ranged from 17.00 mg/L to 20.50 mg/L, 1.25 mg/L to 1.75 mg/L, 1.59 mg/L to 2.39 mg/L, 9.60 mg/L to 11.35 mg/L, 0.09 mg/L to 0.19 mg/L and 0.29 mg/L to 0.48 mg/L respectively, with these test parameters showing no significant differences across the different sampling points. On the other hand, test parameters such as pH showed the strongest significant variation (p < 0.05) and the absence of similarities across all sample locations, being an acidic environment with values ranging between 5.10 and 5.30. Apart from samples of Oswan 2 and Obodo communities, TA showed no significant difference (p > 0.05) between samples of Oswan 1, Olem and Agothoman communities. TA amounts ranged from 0.95 mg/L to 1.30 mg/L. Similarly, only samples of the upstream Oswan communities showed no significant difference (p > 0.05) in calcium concentrations, while the pair of communities (Oswan 1, Olem and Agothoman) and (Oswan 2 and Obodo) revealed no significant chloride concentration (p > 0.05) (Table 5). Contrary to the levels of conductivity and total dissolved solid recorded in this study, Akinbile and Omoniyi (2018) had reported values exceeding limits stipulated by World Health Organization (WHO), Food and Agriculture Organization (FAO) and Nigeria Standards for Drinking Water Quality (NSDWQ). Akoteyon et al., (2011) had reported pH and hardness levels to be homogeneous and heterogeneous respectively. This was in partial agreement to this work, where both parameters depicted relative homogeneity by virtue of the close range of values recorded across the different sections of the river. The likely sources of variation in the environment may have resulted from human influences such as the occasional spills from oil installations situated further upstream of Oswan community, infiltration of waste dumpsite leachates and agricultural run-offs emanating from farms located along the embankments of the river, alongside fishing activities. However, the river is not used for transportation purposes because it seasonally ebbs away.
Most notably, inter-parameter statistical significant differences amongst locations depicted the trend: pH > TA > Ca > Cl- > EC = Fe = TDS = TH = Mg = DO = NO3- = BOD5 (Table 5). Consequently, the cause of pH alteration differs across the environment and may have resulted from anthropogenic inputs (crude oil spill) and the effects of water dilution.
 |
Table 5: Physicochemical characteristics of surface water of Imiringi River Click here to view Table |
EC revealed the most significant positive correlation with TDS (r = 0.965, p < 0.01) and depicted the most significant negative correlation with DO (r = -0.312, p < 0.05). Fe showed the most significant positive correlation with pH (r = 0.500, p < 0.05) while reflecting the most significant negative correlation with DO (r = -0.068, p < 0.05). TDS showed the most significant positive correlation with Cl- (r = 0.907, p < 0.01) and depicted the most significant negative correlation with DO (r = -0.357, p < 0.05). Water pH showed the most significant positive relationships with TA (r = 0.846, p < 0.01) and NO3- (r = 0.848, p < 0.01), whilst depicting the most significant negative correlation with DO (r = -0.357, p < 0.05). TA showed the most significant positive and negative correlations with NO3- (r = 0.916, p < 0.01) and DO (r = -0.304, p < 0.05) respectively. TH showed the most significant positive and negative correlations with NO3- (r = 0.580, p < 0.05) and Mg (r = -0.279, p < 0.05) respectively. Ca showed the most significant positive and negative correlations with NO3- (r = 0.483, p < 0.05) and DO (r = -0.332, p < 0.05) respectively. Mg revealed the most significant positive and negative correlations with Cl- (r = 0.188, p < 0.05) and DO (r = -0.455, p < 0.05) respectively. In contrast, DO showed no positive correlation with other test parameters apart from TH (r = 0.314, p < 0.05), while Cl- reflected no negative correlations with test parameters, revealing the most significant positive correlation with NO3- (r = 0.890, p < 0.01). Finally, NO3- showed most significant positive correlation with BOD5 (r = 0.116, p < 0.05) whilst BOD5 showed most positive significant relationship with Fe (r = 0.377, p < 0.05) (Table 6). Overall, EC and DO representing the most significant positive and negative correlating test parameters respectively.
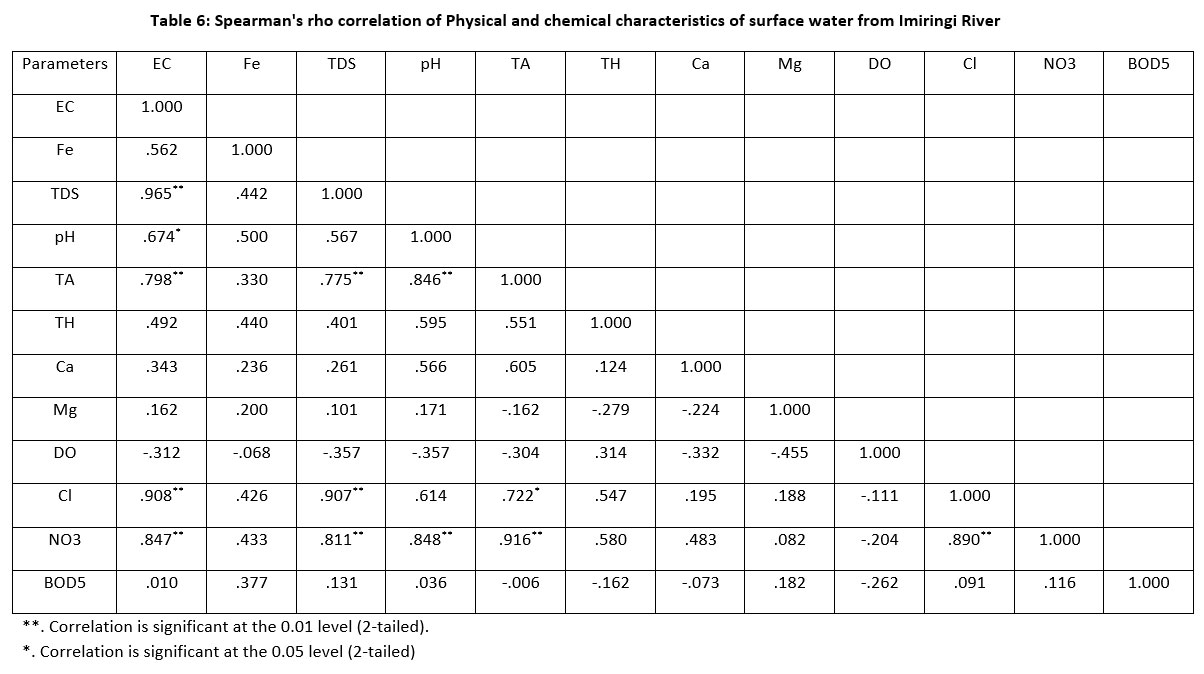 |
Table 6: Spearman's rho correlation of Physical and chemical characteristics of surface water from Imiringi River Click here to view Table |
The different sections of the Imiringi River that were evaluated revealed similarities in their water quality trend. This is owing to the fact that water quality index calculations generally depicted its waters to be unsuitable for drinking. All the examined water quality parameters were within WHO/DPR limit except for pH (5.10 – 5.30) and Fe (2.00 – 3.31 mg/L) (DPR, 2018; WHO, 2008) (Table 5). The pH values reported for Imiringi River was slightly more acidic than the reported range for Kwale, Ashaka and Osemele rivers in Delta State, Nigeria (5.45 to 5.90) during the dry term (Oshurhe et al., 2014). Contrary to the findings from this study (Leizou et al., 2017) had obtained near-neutral pH values for Brass River. Also, (Oshurhe et al., 2014) reported DO levels spanning between 5.45 and 12.00, representing values that exceed the DPR daily minimum of 5.0 mg/L (DPR, 2018). Also, Anyanwu and Ukaegbu (2019) recorded water parameters like pH and DO at values that were short of regulatory recommendations in all sampling locations of a South-Eastern Nigeria river, while BOD was only deficient in sample location 1. The overall water quality was suitable to sustain biodiversity while effluent discharge activities did not produce negative effect on water quality.
From the antecedent, the continuous monitoring of Imiringi River is required due to its economic importance to local inhabitants of the area. More so, the result of the calculated water quality indicator falls within the range of 122.46 to 203.65 (Tables 7 to 11). Even though some communities reflected a greater degree of non-reusability as compared to others, the water quality status of Imiringi River was generally “unsuitable for drinking” (Table 4). In a similar manner, Amadi et al. (2010) had recorded WQI of 174.49 for rivers Otamiri and Oramiriukwu in Rivers State, signifying very poor water quality status. Results from this study reflected the most deterioration of water quality for the downstream, followed by the upstream and lastly the midstream sections of Imiringi River. Oshurhe et al. (2014) corroborates this report with increased degree of deterioration at the downstream end of Ase River. In a similar manner, Aigberua and Tarawou (2019) had reported the upstream segment (Polaku community) of Taylor creek to be of relatively better quality than the midstream and downstream ends. While 16.7% of water quality test parameters being considered in the Imiringi River failed to meet regulatory expectations, Orashi River recorded increased non-conformance (50.0%) for water quality variables being tested. Reports from Ezeilo and Oba (2016) and Ibiam et al. (2016) had revealed poor and unfit classification for some water bodies in Delta State and its environs using the water quality index. Likewise, River Brass water was reportedly far from perfect (Leizou et al., 2017). However, River Isiodu located in the Niger Delta region of Nigeria was evaluated to be unpolluted in spite of ongoing dredging activities (Iyama and Edori, 2013). The different communities that cut across Imiringi River depicted the following order in their deteriorating water quality tendencies: Obodo > Agthoman > Oswan 2 > Oswan 1 > Olem (Tables 7 to 11), thereby revealing poorer water quality at the downstream communities of Obodo and Agothoman. Similarly, the downstream section of river Gamla, Zaria, in Northwestern Nigeria showed the highest water quality index value of 105.77 and 126.34 during the dry and rainy periods respectively. On the other hand, the upstream zones of the river showed lower values of 62.71 and 78.09 for the dry and wet terms respectively (Aliyu et al., 2019). Ahaneku and Animashaun (2013) had reported river Asa in Ilorin, Nigeria to have failed the Drinking Water Quality Index, hence, it was unhealthy for public consumption with WQI ranging between 41.3 and 52.9, with 3 of the 4 sampling stations reflecting poor status and only one showing marginal status. On the other hand, WQI was calculated for the Minichinda stream using methods recommended by World Health Organization (WHO), Bureau of Indian Standards (BIU) and Indian Council for Medical Research (ICMR) for drinking water quality. Water quality indices reportedly ranged from 28.13 to 79.34, thus reflecting most of the stations to be void of pollutants while station 3 depicted very poor quality, being the point most influenced by anthropogenic waste deposition (Otene and Nnadi, 2019).
The redistribution of contaminants via water mixing processes during the tide may have contributed to the diminishing quality of water at the downstream portions of the river. Therefore, water from this area does not satisfy the considerations for human ingestion.
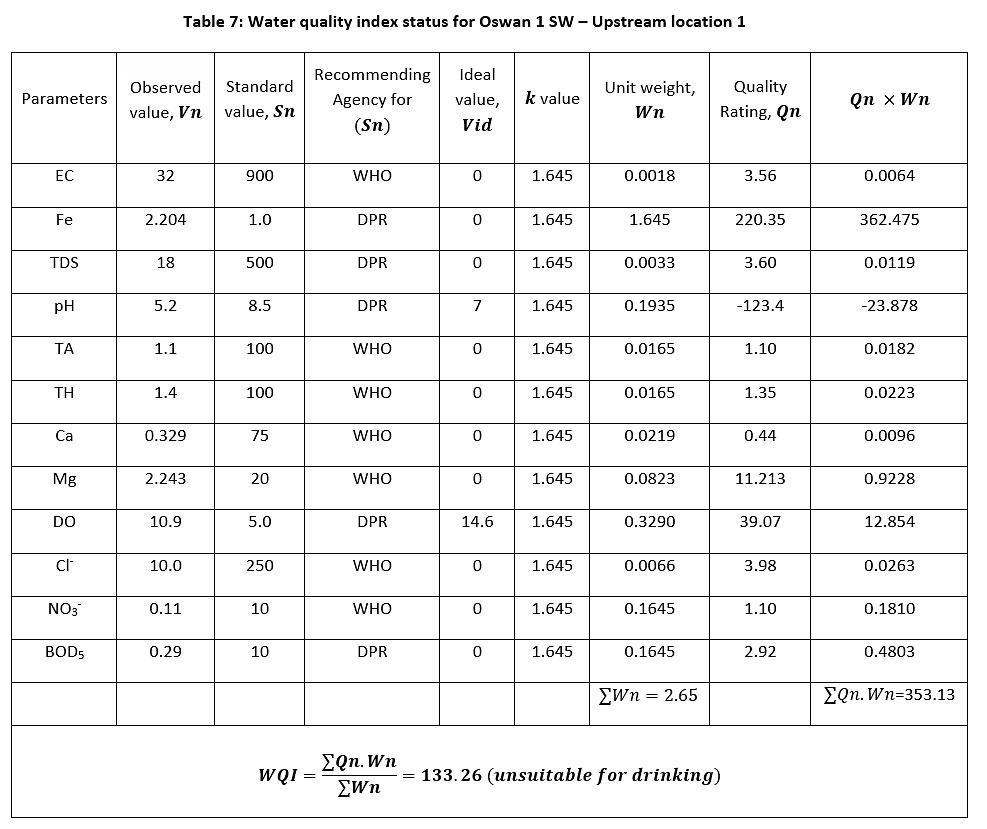 |
Table 7: Water quality index status for Oswan 1 SW – Upstream location 1 Click here to view Table |
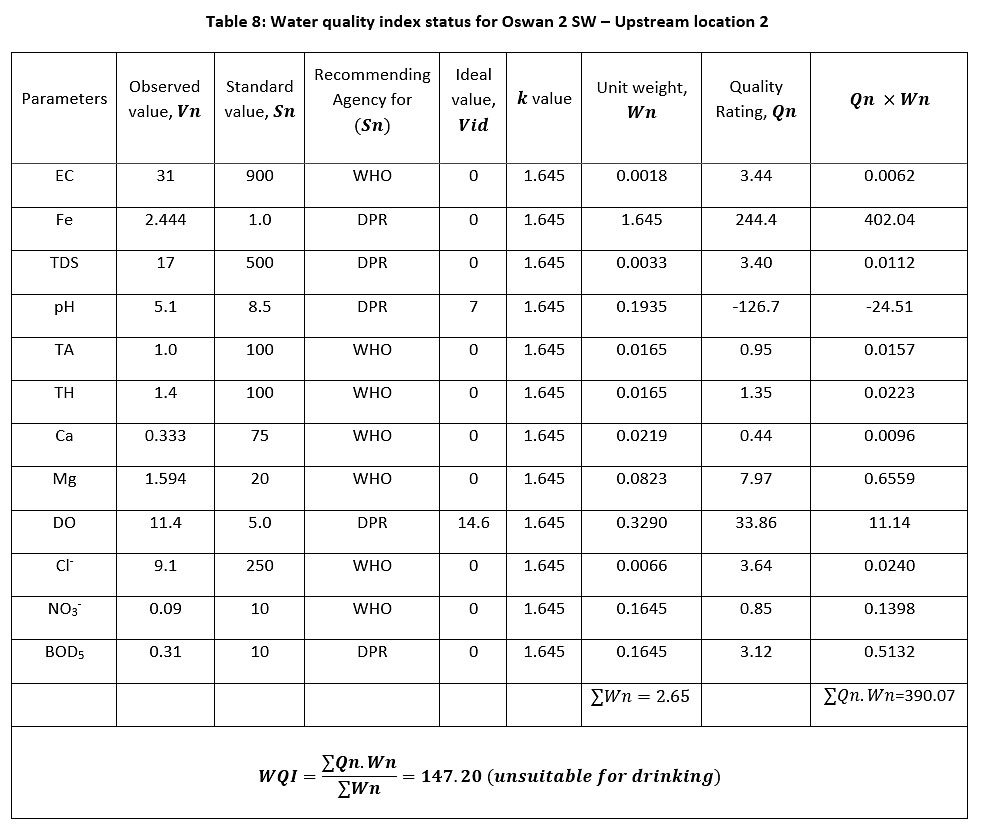 |
Table 8: Water quality index status for Oswan 2 SW – Upstream location 2 Click here to view Table |
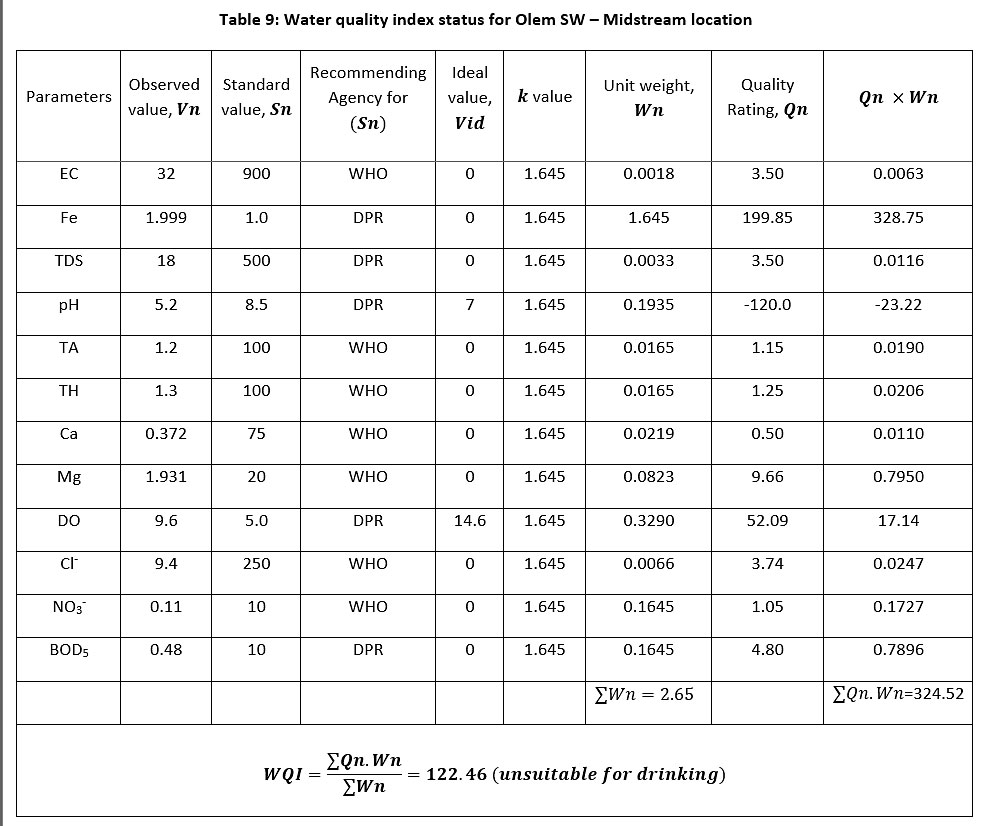 |
Table 9: Water quality index status for Olem SW – Midstream location Click here to view Table |
 |
Table 10: Water quality index status for Obodo SW – Downstream location 1 Click here to view Table |
 |
Table 11: Water quality index status for Agothoman SW – Downstream location 2 Click here to view Table |
Conclusions
The water quality condition of river Imiringi reportedly diminished along the downstream communities owing mostly to the infiltration and redistribution of dumpsite leachates and agricultural run-offs in the direction of water flow. Consequently, the location of Obodo and Agothoman communities at the downstream section of the river reflected increased heavy metal enrichment. Generally, WQI evaluation of Imiringi River revealed its unsuitability for public consumption even though it supports aquatic life. Since the river ebbs seasonally, it will be important to continuously assess the water environment in order to identify changing trends and the impact of human influences on the pollution regime. The acid level and considerable iron levels of the water environment contravened regulatory limits while electrical conductivity and total dissolved solids content showed the strongest association across field locations been studied. In addition, it will be important to incorporate the enumeration of microbial population densities in future studies of WQI so as to reveal in-depth information on water quality status.
Acknowledgement
We appreciate the technical laboratory support given to us by Anal Concept Ltd (Department of Environment, Research and Development).
Funding
The author(s) received no financial support for the research, authorship, and/or publication of this article.
Conflict of Interest
The authors do not have any conflict of interest.
References
- Adewoye, S. O. (2010). Effects of detergent effluent discharges on the aspect of water quality of ASA River, Ilorin, Nigeria. Agriculture and Biology Journal of North America, 1(4): 731-736.
- Ahaneku, I. E., Animashaun, I. M. (2013). Determination of water quality index of river Asa, Ilorin, Nigeria. Advances in Applied Science Research, 4(6): 277-284.
- Aigberua, A., Tarawou, T., Abasi, C. (2017). Spatial and seasonal assessment of heavy metals in surface waters of the Middleton River in the Niger Delta, Nigeria. International Journal of Natural Resource Ecology and Management, 2(5): 94-98.
- Ajugwo, A. O. (2013). Negative Effects of Gas Flaring: The Nigerian Experience. Journal of Environmental Pollution and Human Health, 1: 6-8.
- Aigberua, A., Tarawou, T. (2019). Water Quality Index (WQI) Assessment along Inland Freshwaters of Taylor Creek in Bayelsa State, Nigeria. Journal of Environmental Treatment Techniques, 7(3): 260-269.
- Akinbile, C. O., Omoniyi, O. (2018). Quality assessment and classification of Ogbese river using water quality index (WQI) tool. Sustainable Water Resources Management, 4: 1023-1030.
- Akoteyon, I. S., Omotayo, A. O., Soladoye, O., Olaoye, H. O. (2011). Determination of Water Quality Index and Suitability of Urban River for Municipal Water Supply in Lagos – Nigeria. European Journal of Scientific Research, 54(2): 263-271.
- Aliyu, G. A., Jamil, N. R. B., Adam, M. B., Zulkeflee, Z. (2019). Assessment of Guinea Savanna River System to evaluate water quality and water monitoring networks. Global Journal of Environmental Science and Management, 5(3): 345-356.
- Amadi, A. N., Olasehinde, E. A., Okosun., Yisa, J. (2010). Assessment of Water Quality Index of Otamiri and Oramiriukwa Rivers. Physics International, 1(2): 102-10
- American Public Health Association (APHA) (1998). Standard Methods for the Examination of Water and wastewater. 20th ed. American Public Health Association. Inc. New York.
- Anyanwu, E. D., Ukaegbu, A. B. (2019). Index approach to water quality assessment of a South eastern Nigerian river. International Journal of Fisheries and Aquatic Studies, 7(1): 153-159.
- Asibor, G., Ofuya, O. (2019). Surface Water Quality Assessment of Warri Metropolis Using Water Quality Index. International Letters of Natural Sciences, 74: 18-25.
- Department of Petroleum Resources (DPR) (2018). Environmental Guidelines and Standards for the Petroleum Industry in Nigeria, DPR, Lagos, Nigeria, Pg 22-23.
- Egun, N. K., Ogiesoba-Eguakun, C. U. (2018). Physico-chemical and Water Quality Index analysis of the Okhuaihe River, Edo State, Nigeria. African Journal of Aquatic Science, 43(4): 345-351.
- Ezeilo, F. E., Oba, K. M. (2016). Evaluation of Water Quality Index of Orashi River, Rivers State, Nigeria. International Journal of Environmental Issues, 12(1-2): 60-75.
- Ibiam, N. A., Nwajei, G. E., Agbaire, P. O., Verla, A. W. (2018). Determination of Water Quality Index of Selected Water Bodies in Warri, Delta State, Nigeria. World News of Natural Sciences, 16: 42-52.
- Ifenkwe, J. C., Nwanjo, H. U., Nwosu, D. C., Solomon, E. A., Bot, Y. S. (2018). Heavy Metal Bioaccumulation and Liquid Peroxidation Damage in Residents of a Gas Flaring Community. International Journal of Advances in Scientific Research and Engineering, 4(7): 140-151.
- Iyama, W. A. Edori, O. S. (2013). Water Quality Index Estimate for Isiodu River Water During Dredging in Niger Delta, Nigeria. Global Journal of Pure and Applied Sciences, 19:163-167.
- Leizou, K. E., Nduka, J. O., Verla, A. W. (2017). “Evaluation of Water Quality Index of the Brass River, Bayelsa State, South-South, Nigeria”. International Journal of Research Granthaalayah, 5(8): 277-287.
- Matta, G., Kumar, A., Kumar, A., Naik, P. K., Kumar, A., Srivastava, N. (2018a). Assessment of Heavy Metals Toxicity and Ecological Impact on Surface Water Quality Using HPI in Ganga River. INAE Letters, 3: 123-129.
- Matta, G., Kumar, A., Bhatnagar, S., Kumar, A., Nayak, A., Kumar, P. (2018b). Repercussions of tourism on water quality of River Ganga in Lower Himalayas. ESSENCE International Journal for Environmental Rehabilitation and Conservation, 9(1): 90-103.
- Okafor, E. C., Opuene, K. (2006). Correlations, partitioning and bioaccumulation of trace metals between segments of Taylor Creek, Southern Nigeria. International Journal of Environmental Science and Technology, 3(4): 381-389.
- Olasoji, S. O., Oyewole, N. O., Abiola, B., Edokpayi, J. N. (2019). Water Quality Assessment of Surface and Groundwater Sources Using a Water Quality Index Method: A Case Study of a Peri-Urban Town in Southwest, Nigeria. Environments, 6(2):
- Olukoya, O. A. P. (2013). Negative Effects of Gas Flaring on Buildings and Public Health in Oil Producing Communities: The Ogbia Community, Bayelsa State Case. International Journal of Environmental Monitoring and Protection, 2(5): 52-61.
- Oshurhe, O., Origho, T., Ohwohere-Asuma, O., Ewhuwhe-Ezo, J. (2014). A Comparative Assessment of Water Quality Index (WQI) and Suitability of River Ase for Domestic Water Supply in Urban and Rural Communities in Southern Nigeria. International Journal of Humanities and Social Science, 4(1): 234-245.
- Otene, B. B., Nnadi, P. C. (2019). Water Quality Index and Status of Minichinda Stream, Port Harcourt, Nigeria. IIARD International Journal of Geography and Environmental Management, 5(1): 1-9.
- Raji, A., Abejide, T. S. (2013). An assessment of environmental problems associated with oil pollution and gas flaring in the Niger Delta region Nigeria, C.1960s-2000. Arabian Journal of Business and Management Review (OMAN Chapter), 3(3): 48-62.
- Thakor, F. J., Bhoi, D. K., Dabhi, H. R., Pandya, S. N., Chauhan, N. B. (2011). Water Quality Index (WQI) of Pariyej lake District Khada, Gujarat. Current World Environment, 6: 225-231.
- Qureshimatva, U. M., Maurya, R. R., Gamit, S. B., Patel, R. D., Solanki, H. A. (2014). Determination of Physico-Chemical Parameters and Water Quality Index (Wqi) of Chandlohia Lake, Ahmadabad, Gujarat, India. J Environ Anal Toxicol, 5(4): 288.
- World Health Organization (WHO) (2008). Guidelines for Drinking water Quality. Incorporating 1st and 2nd Addenda, vol. 1 Recommendations.


