Assessing Land Use and Land Cover Change in River Beas Floodplain, Punjab
Gursewak Singh Brar1
*
 , Vishwa B.S. Chandel1
and Karanjot Kaur Brar1
, Vishwa B.S. Chandel1
and Karanjot Kaur Brar1
http://dx.doi.org/10.12944/CWE.15.1.08
Copy the following to cite this article:
Brar G. S, Chandel V. B. S, Brar K. K. Assessing Land Use and Land Cover Change in River Beas Floodplain, Punjab. Curr World Environ 2020; 15(1). DOI:http://dx.doi.org/10.12944/CWE.15.1.08
Copy the following to cite this URL:
Brar G. S, Chandel V. B. S, Brar K. K. Assessing Land Use and Land Cover Change in River Beas Floodplain, Punjab. Curr World Environ 2020; 15(1). Available from: https://bit.ly/2J1cswj
Download article (pdf)
Citation Manager
Publish History

Introduction
Floodplains are one of the most important and fertile ecosystems of the earth. These are depositional smooth features created by the river along its course (Wooldridge and Morgan 1959; Wolman and Leopold 1970; Gregory and Willing 1973) characterized by periodical overflow of river and wet and dry spells. Regular floods are an important characteristic of the floodplains which deposit a layer of fertile soil. Several great ancient civilizations of the world developed in the floodplains due to this character of these lands (Qi 2008). With the passage of time, these floodplains attracted more human population all over the world. The encroachment of these floodplains took place and large human colonies were developed here. As a result, a large alteration in land use and land cover has been witnessed in the floodplains (Zope et al., 2016).
Land use (human aspect) and land cover (biophysical aspect) are the two basic indicators which are used to understand human relation with nature (Sala et al., 2000). Land use and land cover change (lulcc) reshapes the natural landscapes and modifies earth system functionality. (Turner et al., 1994; Lambin et al., 2001). It is the most ancient human phenomenon induced in the biosphere (Turner II 2001; The Encyclopedia of Earth 2016). Land use includes the arrangements, activities and inputs implemented by humans to obtain benefits through land cover (FAO/UNEP, 1999; Lillesand and Kiefer 2008; Chandel et al., 2013). On the other hand, land cover reflects the biophysical state of the earth’s surface and immediate subsurface, thus embracing the soil material, vegetation, and natural water bodies (Campbell 1987; Lillesand & Kiefer 2008; Prakasam 2010; Brar 2013, 2014). Land use and land cover are different terms despite the two terms often being used interchangeably. Land use refers to how land is used by humans. On the other hand, Land Cover refers to the vegetation, structures, or other features that cover the land (Duhamel 2003; Brar et al., 2014). To investigate the changes on the surface of the earth, both terms are jointly used, because human beings affect land use as well as land cover. The consequences of these changes can be seen on local, regional, and global environments, biodiversity, water and sediment flow and soil conditions (Turner et al., 1994). These changes also lead to the increased vulnerability of people and places to natural and anthropogenic perturbations (Kasperson et al., 1995; Kabanda and Palamuleni 2013). The information about this change in land use and land cover is very helpful in understanding vulnerability to the hazards, environment degradation and planning of haphazard growth.
The present work is an effort to understand the dimensions of landscape change and its implication for sustainable planning using geospatial technology. River Beas Floodplain of Punjab is chosen as study unit which has gone through several changes in land use and land cover mainly for agricultural purposes (Brar and Chandel 2011). The present work is an attempt to identify land use and land cover changes in the floodplain using remote sensing and GIS.
Study Area
River Beas originates from Beas Kund near Rohtang Pass in Pir-Panjal range of Himalayas. It has a total length of 460 kilometers. After covering a distance of 256 kilometers in the hilly terrain of Himachal Pardesh and cutting the Solasinghi range of Siwaliks near Talwara, it enters into Punjab where it makes its floodplain (Singh and Kaur 2005). In Punjab plain River Beas is considered as an important river which contributes to the development of great plain of the Indo-Gangetic river system. The River Beas floodplain has an aerial extent from 31°07’08”N to 32° 08’07”N latitude and 74°56’25”E to 75°54’02”E longitude (Figure 1, Source: Landsat OLI 2015). The floodplain of River Beas is known as ‘Bet’. It is much wider in east part than west part of the river due to westward shift of the river. The presence of cliff like bluff demarcates its western boundary which separates it from upland plains, while in eastern direction its extent is upto the Black Bein (Gosal 2004). The height of cliff like bluff varies from 6 meters to 30 meters. The origin of this bluff is considered the effect of tectonic uplift in Pleistocene Age (Gazetteer Amritsar 1976).
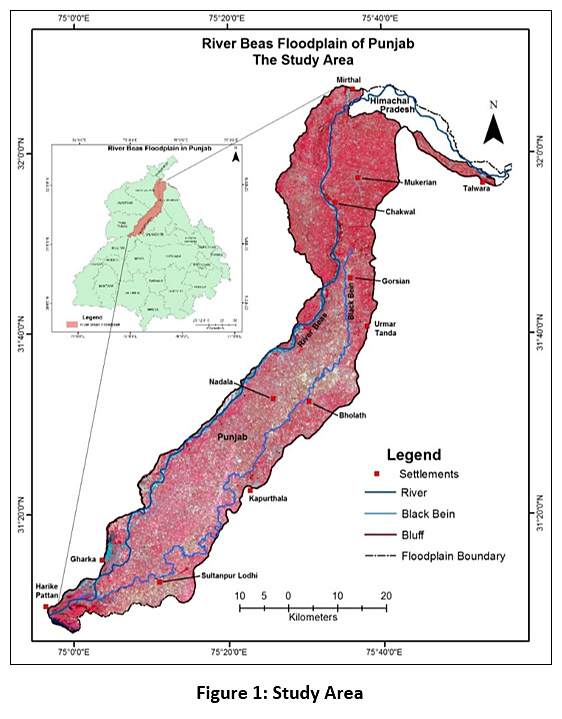 |
Figure 1: Study Area Click here to view Figure |
The River Beas floodplain comprises a large part of Dasuya Tehsil of Hoshiarpur, western part of Kapurthala, Eastern part of Gurdaspur and margins of Amritsar, Tarn Taran and Jalandhar districts. The settlement size in the floodplain varies from small villages to towns like Mukerian and Sultanpur Lodhi. Main villages of the floodplain are Begowal, Ratta Kadim, Khairanwali, Gopipur, Talwandi Choudhrian, Dulowal etc. Most of the villages are small sized dispersed in the floodplain. Agriculture is the main occupation of the rural people in the study area. They are using even small pieces of land like river islands for cultivation.
Data Sources and Methodology
The analysis of the changes in land use and land for a period is an important task to understand issue related to the land transformation. The changes in land use and land cover in River Beas Floodplain of Punjab were extracted from multi-temporal data of Landsat for the period of 1989-2015. The remotely sensed data include imageries of Landsat TM (1989), Landsat ETM+ (2000) and Landsat OLI (2015). The spatial resolution for the above satellite imageries is 30 meters. In addition to this data, Survey of India Toposheets, GPS and Google Earth data was used for verification, validation and accuracy assessment of the results. The cloud free data was taken from the post-harvest (autumn) season. The use of satellite imageries of the same season also reduces the problem associated with different vegetation conditions and solar zenith angle.
Unsupervised classification method was used to classify the satellite data. Erdas Imagine 2014 was used to process and classify the remotely sensed data and ArcGIS 10.3 was used for mapping purposes. The classes further verified and rearranged after validation (Figure 2). More than 90% accuracy level was achieved in all satellite imageries. In analysis 14 classes of land use and land cover were identified: River Beas, Black Bein, Chakki Khad, forest, scrubs, perennial wetlands, seasonal wetlands, ponds, sandy area, barren land, agriculture, plantation, canal and settlements.
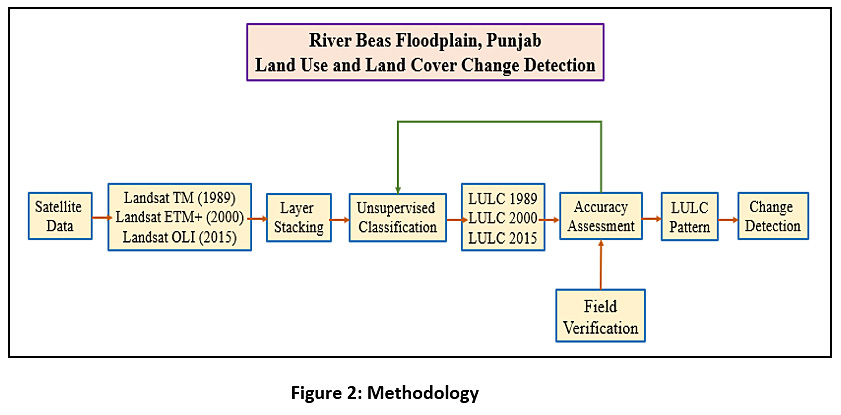 |
Figure 2: Methodology Click here to view Figure |
Results and Discussion
Land Use and Land Cover 1989
In 1989, the ratio of land use and land cover was 86:14. In land use, agricultural land was a dominating category with 83.71% area of the floodplain. Settlements occupied 1.55% area of the floodplain. The share of plantation and canal was 1.05% and 0.05% respectively. In land cover, the area under wetlands (perennial and seasonal) was 6.05%. River Beas occupied 2.96% of the total area (table 1). Barren land and sandy area which are mainly concentrated along the River, captured 2.23% and 1.58% share of the floodplain respectively (figure 2(1)). The other remaining 0.83% area of the floodplain is occupied by Black Bein, Chakki Khad, scrubs, forest and ponds.
Table 1: Land Use and Land Cover Change: 1989-2015
|
LULC Categories |
Area (Percent) |
Percent Change (1989-2015) |
||
|
1989 |
2000 |
2015 |
|
|
|
River Beas |
2.96 |
2.95 |
2.48 |
-16.23 |
|
Black Bein |
0.32 |
0.30 |
0.28 |
-12.77 |
|
Chakki Khad |
0.08 |
0.07 |
0.05 |
-37.43 |
|
Forest |
0.09 |
0.07 |
0.05 |
-47.47 |
|
Scrubs |
0.24 |
0.24 |
0.11 |
-56.40 |
|
Perennial Wetlands |
3.02 |
1.75 |
1.50 |
-50.18 |
|
Seasonal Wetlands |
3.03 |
2.82 |
1.80 |
-40.64 |
|
Ponds |
0.13 |
0.12 |
0.07 |
-46.46 |
|
Sandy Area |
1.58 |
1.55 |
0.55 |
-64.92 |
|
Barren Land |
2.23 |
1.23 |
0.41 |
-81.77 |
|
Agricultural Land |
83.71 |
85.10 |
88.20 |
5.36 |
|
Plantation |
1.05 |
1.67 |
1.56 |
48.63 |
|
Canal |
0.05 |
0.05 |
0.09 |
65.45 |
|
Settlements |
1.55 |
2.09 |
2.86 |
84.44 |
|
100 |
100 |
100 |
|
|
Source: Landsat TM, Landsat ETM+, & Landsat OLI
Land Use and Land Cover 2000
During this time period, the share of agricultural activities was 85.10% to the total area of the floodplain. The area under settlements, plantation and canal was 2.09%, 1.67% and 0.05% respectively. The share of wetlands (seasonal and perennial) was 4.57%. River Beas occupied 2.95%, whereas the area under other land cover categories was 0.8% of the total floodplain (figure 2(2)).
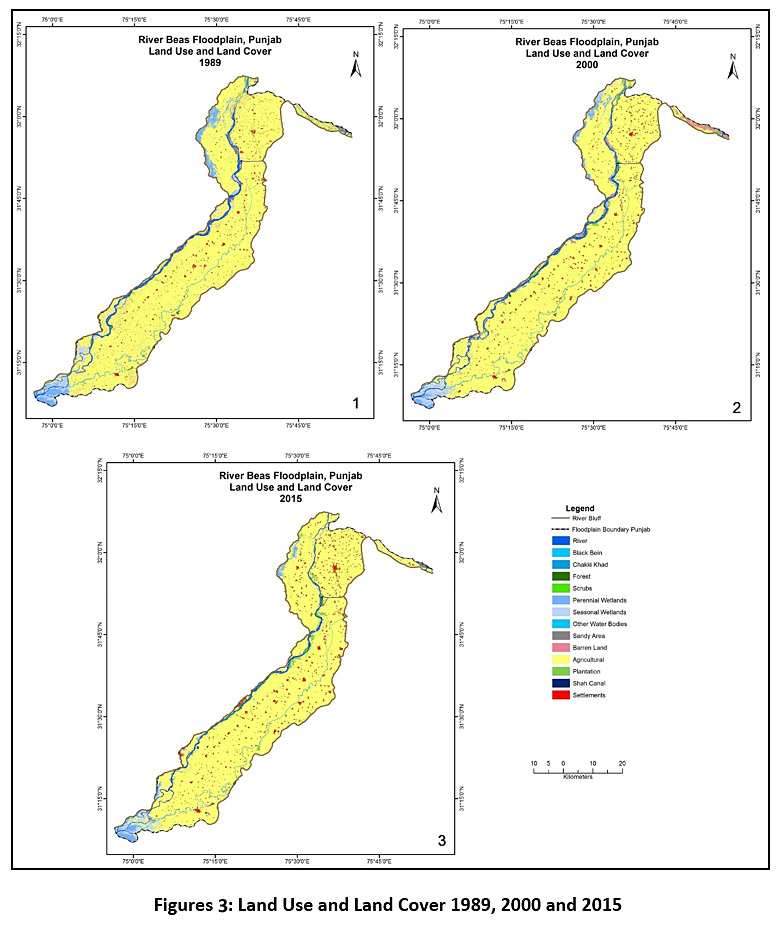 |
Figures 3: Land Use and Land Cover 1989, 2000 and 2015 Click here to view Figure |
Land Use and Land Cover: 2015
In 2015, the ratio of land use and land cover was 93:07. Agriculture was the leading activity during this time with 88.20% area of the floodplain. Settlements, mainly rural in nature and distributed in the whole study area, occupied 2.86% of floodplain. Plantation and canal captured 1.56% and 0.09% area of the floodplain respectively. In land cover, wetlands comprised 3.30% of the total area. River Beas occupied 2.48% area, whereas sandy area, barren land, Black Bein, scrubs, ponds, forest and Chakki Khad occupied 0.55%, 0.41%, 0.28%, 0.11%, 0.07%, 0.5% and 0.5% area respectively (figure 2(3)).
Land Use and Land Cover Change: 1989-2015
The land use and land cover change for the study period depicts vast changes. The ratio of land use to land cover categories for the years 1989, 2000 and 2015 was 86:14, 89:11 and 93:07 respectively, showing a virtual elimination of natural areas. Agricultural land recorded a total increase of 95.23 km² (5.36%) to its area. The size of human settlements increased 88.44% from 1989 to 2015. The other land use categories i.e. plantation and canal were increased by 48.63% and 65.45% respectively. On the other hand, natural land cover lost a major proportion of its area. All categories of land cover lost their significant share during this period. The most affected categories which had lost their area were barren land (81.77%), sandy area (64.92%), scrubs (56.40%), wetlands (perennial 50.18%, seasonal 40.64%) and forests 52.80%. Other land cover categories which recorded decrease in their respective area from 1989 to 2015 were: ponds (46.46%), Chakki Khad (37.43%), River Beas (16.23%) and Black Bein (12.77%).
Factors Responsible for Land Use and Land Cover Change
Anthropogenic activities were the main responsible factors for lulcc from 1989 to 2015. The area under land use was expanded at the expense of land cover. The construction of Pond Dam, artificial embankments and canals were the main agents of change. As a result, the discharge to river water was reduced, the floods were controlled and recharging points of the wetlands were blocked. Due to these, the area of streams was shrunk. This also paved way for clearance of wetlands and conversion of barren land for agricultural activities. Terkiana Jhil (original source of Black Bein) was cleared for agriculture and Black Bein was connected to an artificial channel from Shah Canal. Illegal sand mining along the river reduced the area under sand. Moreover, the mechanization of agriculture and development of transport network in the area exaggerated the process of change. Even the small river islands were not exempted from human influence and were utilised for agriculture. Agricultural land is further contributed to expand other human activities i.e. plantation and settlements. People started to grow trees in the flood prone area due to their more resistivity to the floods than crops. Increasing population in the area also contributed to expand settlements.
Conclusion
The human-environment relationships can better be understood by analysing land use and land cover of an area. Imbalances in their relations can be seen from the proportion of land use to the land cover. The dominance of anthropogenic or natural processes can be better understood from this fraction. In River Beas Floodplain of Punjab, the data of land use and land cover of different time periods shows that human activities were over taking the natural processes. This was a clear sign of depleting of man-nature relationships. The ratio of area under land use and land cover was 86:14 in 1989 which indicates that the human activities were already overtaken the natural processes in the floodplain. This relation was further worsened during next years and the ratio of land use and land cover was 89:11 and 93:07 for the years 2000 and 2015 respectively. The increasing human activities in the floodplain were depleting the natural resources of the floodplain. The increasing share of land use was also increased the vulnerability from the floods. There is need to check the human activities and conservation of natural resources in the floodplain.
Acknowledgement
This article is a part of the work of the author. This author received an SR-Doctoral fellowship during his Ph.D. We are also thankful to U.S. Geological Survey (USGS) for allowing us to download Landsat TM, Landsat ETM+ and Landsat OLI images from their website without any charge..
References
- Wooldridge S. W, Morgan R. S, An Outline of Geomorphology - The Physical Basis of Geography. 2nd Edition. London, UK: Longmans, Green and Co. Ltd; 1959.
- Wolman M. G, Leopold L. B, Flood Plains. In: Dury G. H, ed. Rivers and River Terraces. London, UK: MacMillan and Co. Ltd; 1970:166-196.
- Gregory K. J, Willing D. E, Drainage Basin Form and Process – A Geomorphological Approach. London, UK: Edward Arnold (Publishers) Ltd; 1973.
- Qi D, Early Capital Cities – The Key Symbols of Early Chinese Civilization. Frontiers of History in China 2008:3(1):1-11.
- Zope P. E, Eldho T. I, Jothiprakash V, Impacts of land use–land cover change and urbanization on flooding: A case study of Oshiwara River Basin in Mumbai, India. Catena. 2016:145:142-154.
- Sala O. E, Chapin III F. S, Armesto J. J, et al., Global Biodiversity Scenarios for the Year 2100. Science. 2000; 287:1770-1774.
- Turner II B. L, Meyer W. B, Skole D. L, Global Land-Use/Land-Cover Change: Towards an Integrated Study. Ambio. 1994:23(1): 91-95.
- Lambin E. F, Turner B. L, Geist H. J, et al., The causes of land-use and land-cover change: moving beyond the myths. Glo Envir Change. 2001; 11:261-269.
- Turner II B. L, Land-Use and Land-Cover Change: Advances in 1.5 Decades of Sustained International Research, Emergent: Sustainability Science, GAIA. 2001:10: 269-272.
- The Encyclopedia of Earth. Land-use and Land-cover Change. http://editors.eol.org/eoearth/wiki/Land_use#Land-use_and_land-cover_change. 2016. (last accessed 22 December 2016).
- Food and Agriculture Organization (1997). Land Use. http://en.wikipedia.org/wiki/Land_use (last accessed 22 February 2013).
- Lillesand T. M, Kiefer R. W., Remote Sensing and Image Interpretation. US: John Wiley & Sons; 2008.
- Chandel V. B. S, Brar K. K, Kahlon S, Land Use/Cover Change and its implications for Kullu District of Himachal Pradesh, India. International Journal of Geomatics and Geosciences; 2013:3(3): 538-551.
- Campbell J. B, 1987. Introduction to Remote Sensing. New York, US: The Guilford Press; 1987.
- Prakasam C, Land Use and Land Cover Change Detection through Remote Sensing Approach: A Case Study of Kodaikanal Taluk, Tamilnadu. Inter J. Geom and Geosci. 2010:1(2):150-158.
- Brar G.S. Detection of land use and land cover change with remote sensing and GIS: A case of Punjab Siwaliks. Int. J. of Geomatics and Geosci. 2013:4(2):296-304.
- Brar G. S, Application of Geospatial Technology in Land Use/Cover Change Detection: The Case of Jayanti Rao Watershed, India. Int. J. of Man and Social Sci Res. 2014:3(6):37-40.
- Duhamel C. Land Use and land cover, including their classification in Land use, land cover and Soil Sciences vol 1. http://www.eolss.net/sample-chapters/c19/E1-05-01-01.pdf. 2003. (last accessed 01 February 2020).
- Brar G. S, Singh V. B, Brar K. K, Siswan Choe Watershed, Punjab, India: Land Use Land Cover Change Detection. In: Seema B, ed. Climatic Change and Water Resource Management. Patiala, IN: Twenty First Centaury Publications; 2014:161-166.
- Kasperson J. X, Kasperson R. E, Turner II B. L, Regions at Risk: Comparisons of Threatened Environments. New York US: United Nations University Press; 1995.
- Kabanda T. H, Palamuleni L. G, Land use/cover changes and vulnerability to flooding in the Harts catchment, South Africa. S. African Geog Jour. 2013:95: 105-116.
- Brar K. K, Chandel V. B. S, The Lost Natural Wetlands of Punjab (India): An Inventory. J. Indian Soc of Remote Sensing. 2011:40(1): 97-107.
- Singh, M., and H. Kaur. Punjab Today. New Delhi, IN: Deep and Deep Publications Pvt. Ltd; 2005.
- Gosal G. S, Physical Geography of the Punjab, J. of Punjab Studies. 2004:11(1): 19-37.
- Gazetteer Amritsar (1976). General. http://punjabrevenue.nic.in/gaz_asr1.htm#CONT. (last accessed 28 February 2013).


