Seasonal Water Quality Study of Nche Stream, A Water Body in Imo State, Nigeria
Duru Majesty1 * , Alisa Christopher2 , Ike Christian3 , Akubugwo Emmanuel4 , Chinyere Godwin4 , Onyeabo Chimaraoke5 , Odika Prince6 , Edeh Paul1 and Adindu Eze7
1
Department of Biochemistry,
University of Calabar,
Calabar,
Nigeria
http://dx.doi.org/10.12944/CWE.14.3.11
Copy the following to cite this article:
Majesty D, Christopher A, Christian I, Emmanuel A, Godwin C, Chimaraoke O, Prince O, Paul E. Seasonal Water Quality Study on Nche Stream, A Water Body in Imo State, Nigeria. Curr World Environ 2019; 14(3). DOI:http://dx.doi.org/10.12944/CWE.14.3.11
Copy the following to cite this URL:
Majesty D, Christopher A, Christian I, Emmanuel A, Godwin C, Chimaraoke O, Prince O, Paul E. Seasonal Water Quality Study on Nche Stream, A Water Body in Imo State, Nigeria. Curr World Environ 2019; 14(3). Available from: https://bit.ly/2LRFLDB
Download article (pdf)
Citation Manager
Publish History


Introduction
The saying that no water body is pure cannot be overemphasized. No matter how clean water from a natural water body appears through direct physical assessment, it is still believed that it has been affected by pollutants.1-2 Water is vital for the existence and survival of all living organisms.3 However, this valued resource is increasingly being affected by pollution.3-4 Pollution could be inherent from nature or through anthropogenic activities of humans.1 Natural water bodies such as rivers, streams, lakes, and reservoirs provide domestic water for populace in most under-developed and developing nations.1
Nche stream is one of those natural water bodies that provide water for the populace in Umunchi and its environs. Umunchi is a community in Isiala Mbano, a local government of Imo State, Nigeria. It is on record that groundwater table is far, and cannot be easily accessed within the community. Hence, efforts made by rich individuals, philanthropists and governments to sink functioning boreholes within the community have proved abortive. Due to nearness to the people and share perceived belief that natural water is not polluted, the local population especially the people of Ihuorie and Umuarusim Owerre villages found within the community, depend on this water body for domestic water supplies.
Since it has been noted that the quality of water humans take is among the factors that ensure good health,5-6 there is need to ascertain the water quality of Nche stream and then inform the people of the community as well as appropriate authorities as the case maybe.
This study monitored the seasonal variation in the water quality of Nche stream for two seasons, with a view to ascertain the physicochemical characteristics and microbial load of the water body.
Materials and Methods
Study Area
Isiala Mbano has an average elevation of 149 meters, which is equivalent to about 489 feet. The local government area is situated within latitude 5.667Ëš (5°40´ 3.6´´) North and 7.2034Ëš (7° 12´ 22.2´´) East. Nche stream found in Umunchi, lies within the aforementioned latitude and longitude.
Water Sample Collection from Nche Stream
The water samples used for this study were collected from Nche stream between the months of April, 2014-March, 2015. The sampling was always done in the evening, when human activities on the stream were high, and on every last Saturday of each month while the sampling lasted. The sampling was done against the water current. Twelve composite samples were collected from the stream (including all the points where the local population accesses the stream), and pooled together as one.
Water sampling for physicochemical analysis was carried out with the method as described by Nwanebu.7 Water samples for physicochemical analysis were collected in plastic cans (Four liter capacity). Water samples for dissolved oxygen (DO) and biochemical oxygen demand (BOD) were collected using transparent amber-coloured bottles of 250 ml capacity. The methods as described by Nwanebu and Nwabueze,8 were used for microbiological studies and they were conveyed to the laboratory for analysis under cold condition.
Physicochemical Analysis
pH and turbidity were determined in situ with digital pH meter and turbidity meter respectively. The method as described by Ukaga and Onyeka9 was employed for colour determination. The methods described by Amadi et al.,10 were employed for determination of total solid (TS), total dissolved solid (TDS) and total suspended solid (TSS). The modified Wrinkler method,11 was used for estimation of biochemical oxygen demand (BOD) through dissolved oxygen of the samples for different days (day zero and day five). Nitrate, phosphate, sulphate, chloride, and total alkalinity (TH) were determined using the methods described by APHA.11 The method as described by Duru12 was used for calculation of pollution index for each physicochemical characteristics and heavy metals of the studied water body.
Heavy Metal Analysis
Heavy metals in the studied water sample were determined using the methods of APHA.11 Heavy metals determined were lead (Pb), zinc (Zn), iron (Fe), cadmium (Cd), manganese (Mn), mercury (Hg), chromium (Cr), and arsenic (As).
Microbial Studies
Colonial morphology, cellular morphology and biochemical tests were used for microbial studies. The methods of Cruickshank et al.,13 were adopted for Gram staining and starch hydrolysis test. The methods described by Cheesbrough14 were adopted for motility test, citrate utilization test, oxidase test, indole test, endospore test, urease test, and coagulase test. The methods described by Onyeagba15 were adopted for sugar fermentation test and triple sugar iron agar test. The methods adopted by Prescott et al.,16 were adopted for Voges Proskauer test, catalase test, and Methyl red test.
Results and Discussion
The monthly variations of physiochemical characteristics (Table 1) reveals that pH of Nche stream ranged from 6.41-6.87 in rainy season to 5.50-6.10 in dry season. The mean pH of 6.59 and 5.72 in rainy and dry seasons respectively were observed in the present study. The pollution index for pH was 1.01 in rainy season against 0.88 observed in dry season. Low pH of a water body could be attributed to ammonia released through the decay of proteins of dead aquatic life forms. The mean pH value of the studied stream for rainy season falls within WHO17 limit whereas that of dry season was lower than WHO limit. Consumption of acidic water according to Akubugwo and Duru18 could lead to peptic ulcer of the stomach. Total dissolved solid (TS), total dissolved solid (TDS), total suspended solid (TSS) are noted for their relationship in water sample. Total solid range of 90.05-268.51 mg/L was observed in rainy season. Total dissolved solid (TS) and total suspended solid (TDS) ranged from 28.00-120.00 mg/l and 62.05-178.04 mg/L respectively in rainy season. 160.00-148.00 mg/L, 47.90-92.01 mg/L and 54.04-82.50 mg/L were the respective observed value range for TS, TDS and TSS in dry season. Mean values for TS, TDS, and TSS for rainy season were 208.32 mg/L, 91.81 mg/L, and 116.50 mg/L respectively, while 139.88 mg/L, 72.47 mg/L, and 67.40 mg/L were the respective values for TS, TDS and TSS in dry season. The observed values for TS and TDS in both seasons were lower than their respective WHO standards of 500 mg/L and 250 mg/L respectively, while the mean values for TSS in both seasons as observed in this study were higher than its WHO standard of 50 mg/L. The pollution index of TS (0.42), TDS (0.37) and TSS (2.33) rainy season were higher than those of TS (0.28), TDS (0.29) and TSS (1.35) in dry season. Consumption of water with high solid content could lead to gastrointestinal irritation NIS.19 Conductivity for Nche stream ranged from 16.68- 68.40 µScm-1 with a mean conductivity value of 51.71 µScm-1 and pollution index of 1.03 in rainy season as against the 26.82- 52.79 µScm-1 range with a mean value of 40.59 µScm-1 and a pollution index of 0.81 observed in dry season. The relationship between conductivity and TDS as noted by APHA20 and Ray et al.,21 was observed in the present study.
Table 1: Monthly variations in physiochemical characteristics of Nche stream between April, 2014-March, 2015.
|
Rainy season |
Dry season |
|||||||||||
|
Parameter |
Apr. |
May |
Jun. |
Jul. |
Aug. |
Sept |
Oct. |
Nov. |
Dec. |
Jan. |
Feb. |
Mar. |
|
pH |
6.41 ± 0.21 |
6.79 ± 0.11 |
6.84 ± 0.18 |
6.87 ± 0.09 |
6.31 ± 0.15 |
6.40 ± 0.81 |
6.53 ± 0.33 |
6.10 ± 0.10 |
5.9 ± 0.06 |
5.60± 0.23 |
5.51 ± 0.45 |
5.5 ± 0.19 |
|
TS (mg/L) |
90.05 ± 1.48 |
223.49 ± 1.00 |
268.51 ± 2.10 |
270.00 ± 2.23 |
178.04 ± 2.02 |
200.01 ± 0.80 |
228.11 ± 1.00 |
160.04 ± 1.12 |
148.00 ± 0.12 |
130.44 ± 2.02 |
130.44 ± 10.00 |
130.48 ± 2.02 |
|
TDS (mg/L) |
28.00 ± 1.20 |
120.00 ± 2.69 |
90.47 ± 4.60 |
103.84 ± 1.40 |
70.39 ± 0.72 |
120.00 ± 2.48 |
110.00 ± 0.10 |
90.00 ± 2.00 |
92.01 ± 1.48 |
76.40 ± 1.07 |
56.03 ± 2.60 |
47.90 ± 0.41 |
|
TSS (mg/L) |
62.05 ± 1.23 |
103.49 ± 1.80 |
178.04 ± 2.00 |
166.16 ± 1.90 |
107.65 ± 1.08 |
80.01 ± 0.56 |
118.09 ± 1.32 |
70.04 ± 1.80 |
55.99 ± 0.80 |
54.04 ± 1.57 |
74.41 ± 0.89 |
82.50 ± 1.12 |
|
Conductivity (µScm-1) |
16.68 ± 2.00 |
68.40 ± 2.01 |
49.76 ± 3.23 |
58.71 ± 4.03 |
40.82 ± 1.20 |
66.00 ± 5.04 |
61.60 ± 0.23 |
49.60 ± 0.11 |
52.79 ± 1.94 |
41.80 ± 3.05 |
31.94 ± 0.12 |
26.82 ± 1.21 |
|
Turbidity (NTU) |
3.07 ± 0.13 |
5.10 ± 0.42 |
4.48 ± 0.70 |
7.05 ± 1.01 |
3.90 ± 0.20 |
5.40 ± 0.17 |
5.00 ± 0.62 |
4.40 ± 0.20 |
3.20 ± 0.11 |
3.00 ± 0. 48 |
3.40 ± 0.10 |
3.08 ± 0.69 |
|
BOD (mg/L) |
3.01 ± 0.18 |
3.30 ± 0.26 |
3.00 ± 0.38 |
2.80 ± 0.67 |
2.80 ± 0.29 |
3.80 ± 0.11 |
3.00 ± 0.02 |
3.00 ± 0.19 |
4.00 ± 0.82 |
3.80 ± 0.12 |
3.00 ± 0.52 |
3.00 ± 0.19 |
|
Nitrate (mg/L) |
0.70 ± 0.12 |
0.80 ± 0.19 |
0.84 ± 0.03 |
0.72 ± 0.10 |
0.65 ± 0.13 |
0.79 ± 0.42 |
0.75 ± 0.06 |
0.60 ± 0.10 |
0.57 ± 0.00 |
0.54 ± 0.11 |
0.54 ± 0.09 |
0.54 ± 0.16 |
|
Phosphate (mg/L) |
0.22 ± 0.10 |
0.26 ± 0.01 |
0.23 ± 0.07 |
0.23 ± 0.50 |
0.18 ± 0.03 |
0.20 ± 0.00 |
0.23 ± 0.32 |
0.20 ± 0.12 |
0.19 ± 0.02 |
0.17 ± 0.09 |
0.19 ± 0.04 |
0.20 ± 0.08 |
|
Sulphate (mg/L) |
49.00 ± 1.80 |
53.90 ± 2.63 |
57.30 ± 3.00 |
54.91 ± 1.23 |
50.41 ± 1.70 |
50.62 ± 2.02 |
50.89 ± 2.43 |
49.34 ± 1.20 |
49.60 ± 3.11 |
49.36 ± 1.02 |
49.30 ± 2.52 |
49.61 ± 4.75 |
|
Chloride (mg/L) |
6.00 ± 0.42 |
7.04 ± 0.10 |
8.11 ± 0.70 |
8.01 ± 0.02 |
7.99 ± 0.41 |
8.05 ± 0.12 |
8.00 ± 0.42 |
8.17 ± 0.90 |
8.34 ± 0.66 |
8.00 ± 0.52 |
8.21 ± 0.61 |
8.40 ± 1.02 |
|
TH (mg/L) |
7.00 ± 0.34 |
7.80 ± 0.36 |
6.10 ± 0.94 |
5.35 ± 0.19 |
9.30 ± 0.10 |
5.90 ± 1.00 |
6.03 ± 0.78 |
6.18 ± 0.12 |
7.09 ± 0.00 |
7.90 ± 1.42 |
9.12 ± 0.70 |
9.00 ± 1.02 |
Values are means and standard deviation of triplicate determinations.
Legend: Apr.= April; Jun=June; Jul=July; Aug.= August; Sept=September; Oct.=October; Nov.=November; Dec.=December; Jan.=January, Feb.=February; Mar.=March; BOD=Biological Oxygen Demand; TS=Total Solid; TDS=Total Dissolved Solid; TSS=Total Suspended Solid; TH=Total Hardness.
Table 2: Monthly variations of heavy metals in Nche stream between April, 2014-March, 2015
|
Rainy season |
Dry season |
|||||||||||
|
Parameter (mg/L) |
Apr. |
May |
Jun. |
Jul. |
Aug. |
Sept. |
Oct. |
Nov. |
Dec. |
Jan. |
Feb. |
Mar. |
|
Fe |
0.65 ± 0.06 |
0.60 ± 0.01 |
0.60 ± 0.11 |
0.59 ± 0.08 |
0.63 ± 0.04 |
0.60 ± 0.01 |
0.61 ± 0.15 |
0.61 ± 0.18 |
0.69 ± 0.10 |
0.71 ± 0.16 |
0.68 ± 0.12 |
0.68 ± 0.10 |
|
Pb |
0.01 ± 0.00 |
0.009 ± 0.00 |
0.009 ± 0.001 |
0.008 ± 0.001 |
0.010 ± 0.003 |
0.010 ± 0.004 |
0.010 ± 0.005 |
0.010 ± 0.002 |
0.012 ± 0.00 |
0.012 ± 0.00 |
0.012 ± 0.001 |
0.013 ± 0.00 |
|
Zn |
0.12 ± 0.01 |
0.10 ± 0.02 |
0.11 ± 0.06 |
0.10 ± 0.01 |
0.13 ± 0.03 |
0.10 ± 0.01 |
0.09 ± 0.00 |
0.12 ± 0.00 |
0.16 ± 0.01 |
0.17 ± 0.06 |
0.17 ± 0.02 |
0.18 ± 0.05 |
|
Mn |
0.008 ± 0.00 |
0.007 ± 0.001 |
0.007 ± 0.002 |
0.006 ± 0.001 |
0.008 ± 0.001 |
0.010 ± 0.003 |
0.010 ± 0.001 |
0.010 ± 0.002 |
0.012 ± 0.001 |
0.010 ± 0.00 |
0.011 ± 0.00 |
0.011 ± 0.05 |
|
Cd |
0.02 ± 0.00 |
0.01 ± 0.00 |
0.01 ± 0.00 |
0.01 ± 0.00 |
0.02 ± 0.00 |
0.02 ± 0.01 |
0.02 ± 0.00 |
0.04 ± 0.01 |
0.03 ± 0.01 |
0.03 ± 0.00 |
0.02 ± 0.01 |
0.02 ± 0.00 |
|
Hg |
ND |
ND |
ND |
ND |
ND |
ND |
ND |
ND |
ND |
ND |
ND |
ND |
|
Cr |
ND |
ND |
ND |
ND |
ND |
ND |
ND |
ND |
ND |
ND |
ND |
ND |
|
As |
ND |
ND |
ND |
ND |
ND |
ND |
ND |
ND |
ND |
ND |
ND |
ND |
Values are means and standard deviations of triplicate determinations.
Legend: Legend: Apr.=April; Jun=June; Jul=July; Aug.= August; Sept=September; Oct.=October; Nov.=November; Dec.=December; Jan.=January, Feb.=February; Mar.=March; ND: Not Detected.
Turbidity is associated with clarity of water. Obasi et al.,22 noted that the higher the turbidity values of water, the more energy and chemicals needed at the treatment plant to treat the water. Turbidity range 3.08-7.05 mg/L with a mean value of 4.86 mg/L, and 3.00-4.40 mg/L with a mean value of 3.42 mg/L were observed in rainy and dry seasons respectively. Turbidity pollution index was 0.09 in rainy season against 0.09 of dry season. Biological oxygen demand (BOD) is noted as the standard water treatment test for the presence of organic pollutants. With the assumption that water as a medium has no bactericidal effect, the putrescible organic matter that microbial metabolism can degrade is also shown by BOD.23 BOD of the present study ranged from 2.80-3.80 mg/L in rainy season and 3.00-4.00 mg/L in dry season. Their mean values were 3.10 mg/L for rainy seasons and 3.38 mg/L for dry season. From Moore and Moore24 category of BOD values, Nche stream water could be considered as being fairly clean since the observed mean values lie between the range of 2-3 mg/L. Nitrate, phosphate and sulphate contents of a water body are used to correlate the influence of human activity on farm lands surround the water body.18, 20 Observed nitrate ranged from 0.60-0.84 mg/L with a mean value of 0.75 mg/L, and a pollution index of 0.02 in rainy season against the range 0.54-0.60 mg/L with a mean value of 0.56 mg/L and a pollution index of 0.01 observed in dry season. Phosphate ranged from 0.18-0.26 mg/L in rainy season to 0.17-0.23 in dry season. High sulphate range 49.00-57.30 mg/L was observed in rainy season against the range 49.30-49.60 mg/L in dry season. The observed high sulphate content of the studied water body against the values of nitrate and phosphate could be indication of predominant usage of sulphate fertilizers on farm lands surrounding the Nche stream. The observed mean values of phosphate, sulphate and nitrate in this study were lower than their respective WHO standards. According to WHO,25 chloride toxicity from water has not been observed in humans except in special cases of impaired sodium chloride metabolism. Hach26 noted that chloride concentration in excess could give rise to detectable taste in water. Chloride values observed in the present study ranged from 6.00- 8.11 mg/L in rainy season with a mean value of 7.60 mg/L and 8.00-8.40 mg/L in dry season with a mean value of 8.22 mg/L. Hardness in water is related to ability of water to form leather easily with soap. According to Ray et al.,21 water with total hardness values of less than 15 mg/L is classified as a very soft water. Nche stream water falls in this category since the mean values of total hardness of the present study did not exceed 15 mg/L in both season considered. The observed variations and mean values for total hardness were lower than WHO standard.
Monthly variations of heavy metals (Table 2) show that iron ranged from 0.60-0.65 mg/L in rainy season to 0.69-0.71 mg/L in dry seasons. Reduction in volume of water could be behind the observed increase in concentration of the metal during dry season in the present study. Zinc was between 0.09-0.13 mg/L in rainy season to 0.010- 0.013 mg/L in dry season. Manganese ranged from 0.007-0.010 mg/L in rainy season to 0.010 – 0.012 mg/L in dry season. The presence of lead with mean values of 0.009 mg/L and 0.012 mg/L for rainy and dry seasons respectively, and cadmium with mean values of 0.02 mg/L and 0.03 mg/L in rainy and dry seasons respectively in the studied water sample makes consumption of water from Nche stream questionable. Though the observed mean values of lead and cadmium metals were lower than their respective WHO standards, but the accumulation ability of the metals could be a threat to life since the local population depends heavily on water from the studied stream. Exhaust lead and chromium from cars that ply the tarred road surrounding the stream could be the source of the lead and chromium detected in this study. Mercury, chromium, and arsenic were not detected in the studied stream water.
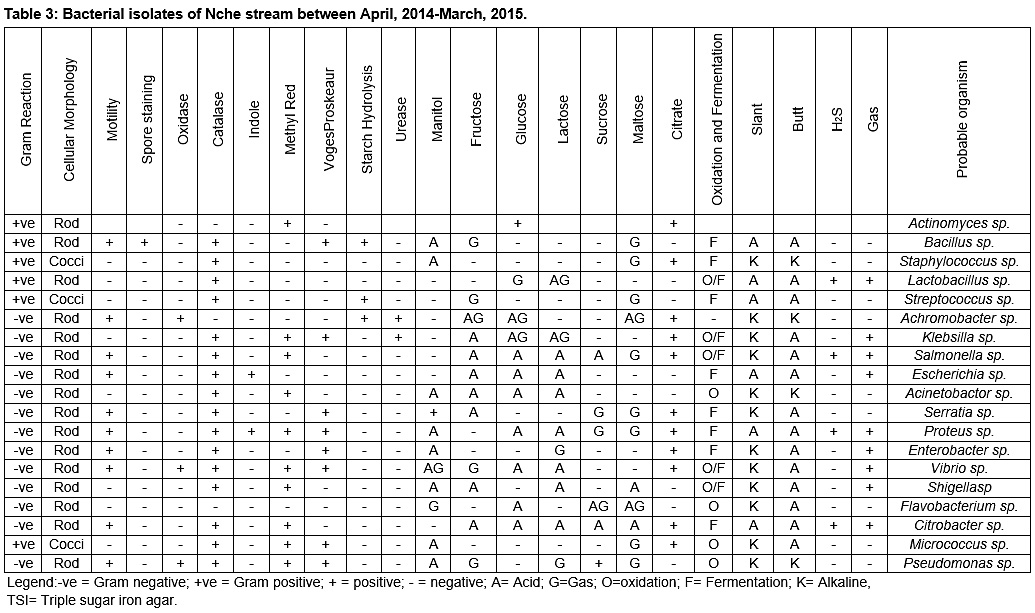 |
Table 3: Bacterial isolates of Nche stream between April, 2014-March, 2015. |
Table 4: Mould isolates from Nche stream water between April, 2014-March, 2015.
|
Morphological characteristics |
Microscopic characteristics |
Probable identity |
|
Dark green granular mycelium |
Conidiodphores with inflated branches at the tip. Conidia chains. |
Penicilum sp. |
|
Green dense velvety mycelium |
Hyaline conidiosphores. Phialides borne on vesicle. Green chain of conidia |
Aspergillus sp. |
|
Dark green granular dense mycelium |
Conidiophores with inflated branches at tip Conidia in chains. |
Penicillium sp. |
|
Cream coloured fluffy mycelium |
Microconidia and macroconidia borne on phialides, microconidia in 3-septate |
Fusarium sp. |
|
Green velvety mycelium |
Branched conidiosphores in cluster. Single celled conidia in chain. |
Cladosporium sp. |
|
Dark cottony mycelium |
Non-septate hyphae, large globose many spored sporangia on single sporangiosphore |
Rhizopus sp. |
|
White fluffy mycelium |
Forked branched septate hyphae, cylindrical hyphae in chains. |
Geotricum sp. |
Table 5: Monthly variations of microbiological load in Nche stream between April, 2014-March, 2015
|
Rainy season |
Dry season |
|||||||||||
|
Microbial load (cfu/mL) |
April |
May |
June |
July |
August |
Sept |
Oct |
Nov |
Dec |
Jan |
Feb |
Mar |
|
THBC(×106) |
0.50 |
1.20 |
1.60 |
1.75 |
1.60 |
2.00 |
1.80 |
1.80 |
1.40 |
1.20 |
0.80 |
0.70 |
|
THUB (×103) |
0.10 |
0.90 |
1.40 |
1.20 |
1.00 |
1.40 |
1.60 |
1.30 |
1.00 |
0.90 |
1.00 |
1.00 |
|
TCC (×105) |
1.00 |
1.30 |
0.90 |
1.70 |
1.10 |
0.80 |
1.00 |
0.70 |
0.65 |
0.70 |
0.80 |
0.70 |
|
SCC (×105) |
0.80 |
1.10 |
1.50 |
2.00 |
1.50 |
1.70 |
1.60 |
1.50 |
1.20 |
1.00 |
0.90 |
1.10 |
|
TVC (×105) |
0.10 |
0.50 |
0.70 |
0.70 |
0.40 |
0.60 |
0.70 |
0. 70 |
0.50 |
0.45 |
0.50 |
0.40 |
|
TFC(×105) |
2.20 |
4.60 |
3.10 |
3.50 |
2.80 |
3.00 |
3.50 |
3.00 |
2.70 |
2.00 |
1.70 |
1.80 |
Values are means of triplicate determinations.
Legend: THBC= Total heterotrophic bacterial count; THUB= Total hydrocarbon utilizing bacterial count; TCC= Total coliform count; SSC= Salmonella-Shigella count; TVC= Total vibrio count; TFC=Total fungal count.
According to Facklam and Peterson,27 organisms such as indigenous species, saprophytic species and human pathogens are among the wide range of organisms present in water. It has been reported that contamination and ability to multiply by organism are factors that guide the existence of microorganism in water.28 Table of bacterial isolates from Nche stream water (Table 3) reveals the presence of nineteen bacterial isolates which include Actinomyces sp., Staphylococcus sp., Bacillus sp., Achromobacter sp., Lactobacillus sp, Streptococcus sp., Klebsilla sp., Salmonella sp., Escherichia sp., Micrococcus sp., Acinetobactor sp., Serratia sp., Proteus sp., Enterobacter sp., Vibrio sp., Shigella sp, Flavobacterium sp., Citrobacter sp., and Pseudomonas sp. Saprophytic mould isolates were also identified (Table 4) as Penicilum sp., Aspergillus sp., Penicilliumsp., Fusarium sp., Cladosporium sp., Rhizopus sp., and Geotricum sp. The risk of using water polluted with microorganisms is amplified by the various uses such water is put to.29-30 Increased risk of infectious diseases is directly proportional to increase in bacterial loads in rivers.30 High bacterial concentrations could be linked to faecal coliform and total coliform.31 Mean values of THBC, THUB, TCC, SCC, TVB, and TFC observed in the studied stream water were higher in rainy seasons than dry season. This could be attributed to washable carried into the stream by flood during rainy season. The observed mean values of the microbial load were higher than their respective WHO standards. Most of these isolated and identified microorganisms are agents of disease conditions.20, 30-34 Hence, the microorganisms observed in Nche stream water become important when their implications on health of humans are considered.30-39
Conclusion
From the observations made in the present study, water from Nche stream has a low pH with high microbial loads. Some of the isolated and identified microorganisms have been linked to incidence of waterborne diseases. The presence of lead and cadmium in Nche stream could be a threat due to their ability to bioaccumulate in the body. The local population that depends on Nche stream should be properly enlightened on the need to purify water from the stream before using it for drinking and other domestic purpose.
Acknowledgement
We acknowledged the effort of Late Mr. Uche Arukwe of blessed memory for his input in the laboratory analysis of this study. The laboratory Technologists in laboratories of Rhema University, Abia State University and Links are high acknowledged. The assistance rendered by Associate Prof. M.I. Nwachukwu of Imo State University is also acknowledged.
Funding
We are thankful to the Vice Chancellor of Rhema University for funding this study.
References
- P.N. Olemeforo and O. E. Obasi (1999): Environmental Pollution: Nigeria in Focus. Istedtion. Achugo Publications, Owerri. pp. 28-30.
- A.S. Ogbuagu, I.J. Okoli, E.U. Ekpunobi, J.O.Ogbuagu, and T.U. Onuegbu (2013): Comparative physicochemical and heavy metal analysis of some water resources for portable drinking water supply in some parts of warri, Delta State, Nigeria. Proceedings of the 36th Annual International Conference of Chemical Society of Nigeria 1: 222-226.
- O. M. Kolawole, T. B. Ajibola, and O. O. Osuolale (2008): Bacteriological investigation of a wastewater discharge run-off stream in Ilorin, Nigeria. J. Appl. Environ. Sci.4:33-37.
- M.K. Olantunji, T. A. Kolawole, B. O. Albert, and L.O. Anthony (2011): Assessment of water quality in Asa River (Nigeria) and its indigenous Clarias gariepius Fish. Int J. of Environ. Res Public Health 8: 4332-4352.
- A.O. Lawal, Z.N. Ali and H. M. S. Haruna (2013): Water quality assessment of hand-dug wells in Kanuri and its industrial area using physicochemical parameters. Proceedings of the 36th Annual International Conference of Chemical Society of Nigeria 1: 142-150.
- G. Brown, and H. Caldwell (2000): Description of commonly considered water quality constituents. Watershed protection plan development guidebook.
- F.C. Nwanebu (2003): Studies on physic-chemical indicators of pollution in Urashi and Iyiechi Rivers, Imo State, Nigeria. Int. J. Environ. Health Human. Dev. 4(2): 22-28.
- F. C. Nwanebu and F. C. Nwabueze (2004): Regime in occurrence of bacteria of public health significance of some natural water bodies in Imo State, Nigeria. Inter. Res. J. Eng. Sc. Tech. 1(1): 23-31.
- C.N. Ukaga and P.I.K. Onyeka (2002): Aquarium and hydrobiology techniques, In: Basic Techniques in Biology. 1st edition. Optimal International Ltd. Enugu. pp. 144 – 149.
- B. A. Amadi, E. N. Agomuo and C. O. Ibegulam (2004): Research methods in biochemistry; Supreme Publishers, Owerri.pp.90.
- APHA (2005): Standard Methods for the Examination of Water and Wastewater 19 (American Public Health Association. APHA, AWWA. Washington. D C, 2005.
- M.K.C. Duru (2015): Studies on pollution status of selected water bodies in osu clan, Isiala Mbano, Imo State, Nigeria. Ph.D. Thesis, Abia State University, Uturu. pp. 160-180.
- R. Cruickshank, J. P. Duguid, B. P Marmion and R. H. A. Swain (1982): Medical Microbiology. Churchill Livingstone London. pp. 170-189.
- M. Cheesbrough (2000): District Laboratory Practice in Tropical Countries. Part II. United Press Cambridge, UK. pp. 137-140.
- Onyeagba, A. R. (2004): Laboratory guide for microbiology, 1st edition, Crystal Publishers, Okigwe, Imo State. pp. 1-335.
- L. M. Prescott, J. P.Hartley, and D. A. Klein (2005): Microbiology, 6th edn., McGraw Hill, London.pp.135-140.
- World Health Organization (2011): Guidelines for drinking-water quality, fourth edition. http://whqlibdoc.who.int/publications/2011/9789241548151_eng.pdf (Retrieved: November 15, 2011).
- E. I. Akubugwo and M.K.C Duru (2011): Human activities and water quality: a case study of Otamiri river, Owerri, Imo State, Nigeria. Global Research Journal of Science 1: 48-53.
- Nigerian Industrial Standard (2007): Nigerian Standard for Drinking Water Quality NIS 554: ICS 13, 060.20.
- American Public Health Association (2005): Standard methods for examination of water and waste water, 13th edition, American Public Health Assocation Inc. New York. p.213.
- K. L. Ray, B.F. Joseph, L.F. David, and T.C. George (1992): Water supply system In: Water resource engineering, 4th edition, McGraw Hill. pp. 49-567.
- R. A. Obasi,O. Balogun, and O. Ajayi, O. (2004): The physiochemical investigation of River Irejo, Etkiti State, South West, Nigeria. Journal of Applied Sci. 7(2): 4121-4134.
- B.A. Amadi (199): The effect of crude oil pollution on trace metal content of some fresh water fishes. Msc. Theses, University of Port Harcourt. pp. 60-120.
- W. T. Moore, and E.A. Moore (1976): Environmental chemistry. Academic Press, London. pp. 360-368.
- World Health Organization Newspaper (1998): Importance of safe drinking water supply. Volume 3. pp. 5-10.
- Hach (1992): Water analysis handbook, HACH company Loveland California.
- R. Facklam and B.E. Peterson (2004): Enterococcus spp. and other gram positive coci. J.Clin. Infection Disease 24:111-126.
- N. Ogbulie (2001): Water and sewage microbiology, In: Introductory microbiology, 2nd edition, Cancave Publishers, Owerri, Nigeria. p.150-153.
- M.I. Nwachukwu, M.K.C. Duru, P. C.Odika, and C.O. Udujih (2013): Microbial evaluation of Njaba River and its effect on body weight of rats following consumption. Journal of Chemical, Biological and Physical Sciences 3(4): 2851-2857.
- T. Kristemann, T. Claben, C. Roch, F. Dangendorf, R. Fuchede, J. Gebel, V. Vacata, and M. Exper (2002): Microbial load of drinking extreme rainfall and runoff. Appl. Environm. Microbial. 32: 316-320.
- J. Crowther, D. Kay, M. D. Wyer (2001): Relationship between microbial water quality and environmental conditions in coastal recreational waters. The Fylde coast, UK. Water Research 35:4029-4038.
- M. Duru and K. Nwanekwu (2012): Physicochemical and microbial status of Nworie River, Owerri, Imo State, Nigeria. Asian Journal of Plant Science and Research 2 (4):433-436.
- E.I. Akubugwo, M.I. Nwachukwu, P.C. Odika and M.K.C.Duru (2013): Water quality assessment of Njaba River, Nigeria. Journal of Environmental Science, Toxicology and Food Technology 4(6): 33-37.
- J. Anudike, M. Duru and F.Uhegbu (2019): Water quality assessment of Nwangele river in Imo State, Nigeria. Journal of Ecobiotechnology 11:1-5.
- M.K.C. Duru, K.E. Nwanekwu, E.A. Adindu, and P.C. Odika. Heavy metal and bioload levels of Otamiri river, Owerri, Imo State, Nigeria. Archives of Applied Science Research 4 (2):1002-1006.
- M. Duru, C. Amadi, B. Amadi, C. Nsofor, and H. Nze. (2013): Effect of different storage vessels on water quality.Global Research Journal of Science 2(2):9-13.
- E. I. Akubugwu, and M.K.C. Duru (2001): Biochemical implication of the consumption of water from otamiri river, Owerri, Imo State, Nigeria. JETEAS 2(6): 934-937.
- M. K. C. Duru, E. A. Adindu, P. C. Odika, B. Amadi, R.O. Chima-Ezika (2012): Consequences of long-term consumption of water from Nworie River (Owerri, Nigeria) on haematological, hepatic, and renal functions using rat model. Biokemistri 24 (1): 52-57.
- M.I. Nwachukwu, S.C. Eziuzor, M.K.C. Duru, I. O. Nwachukwu, C.N. Ukaga, O.S. Udujih, and G.O. Udujih. (2013): Recent biophysical characteristics of domestic water sources in Owerri Metropolis, Nigeria. Journal of Research in Biology 3(6):1066-1071.


