Application of Multi Linear Model for Forecasting Municipal Solid Waste Generation in Lucknow City: A Case Study
Apoorv Verma1 * , Alok Kumar1 and N. B. Singh1
http://dx.doi.org/10.12944/CWE.14.3.10
Copy the following to cite this article:
Verma A, Kumar A, Singh N. B. Application of Multi Linear Model for Forecasting Municipal Solid Waste Generation in Lucknow City: A Case Study. Curr World Environ 2019; 14(3). DOI:http://dx.doi.org/10.12944/CWE.14.3.10
Copy the following to cite this URL:
Verma A, Kumar A, Singh N. B. Application of Multi Linear Model for Forecasting Municipal Solid Waste Generation in Lucknow City: A Case Study. Curr World Environ 2019; 14(3). Available from: https://bit.ly/2P7AjhI
Download article (pdf) Citation Manager Publish History


Introduction
In order to reduce the adverse effects of solid wastes and undesirable environmental degradation, caused by accumulation of solid waste, proper management becomes important (Rushbrook et al., 1988; Rathi 2006; Ray et al., 2005; Kansal 2002). Population explosion is the major factor which drives the changes in waste quantity and composition in current scenario (Adipah et al., 2019). But, in addition to population changes, economic development, employment changes, household size also affects the solid waste generation rate and composition (Dyson and Chang 2005).
India is trying to achieve industrial status by 2020 and future of MSW is expected to increase manifold (Sharma and shah 2005, Shekdar et al., 1992). Hence, reliable prediction of MSW generation quantity becomes a significant aspect of solid waste management (Chang and Lin 1998; Soni et al., 2019). Also, knowledge regarding MSW generation process and accurate forecasting of MSW quantity are imperative for successful deployment and operation of the solid waste management system (Navarro et al., 2002). Short term MSW generation rate forecasting is responsible for ineffective planning of various solid waste management activities like assortment, handling, transportation to the landfill and final disposal (Matsuto and Tanaka 1993). On the other hand, long term prediction facilitates in selecting suitable technologies or planning landfill sites (Navarro et al., 2002). Daskalopoulos et al., (1998) reported that the population and standard of living are important causes affecting solid waste volume and structures. On this basis, he developed a single regression model for forecasting solid waste generation rate. Vivekananda et al., (2014) applied a multiple linear regression model, forecasting generation of MSW from 2010 to 2024 for New Delhi, India and concluded that multiple linear regression model was found quiet accurate in forecasting MSW generation in the study domain. It is clear from literature, that regression model proposed by Daskalopoulos et al., (1998) and, system dynamics proposed by Dyson and Chang (2005) can predict the complete waste trend with good accuracy and for a longer duration. However, they require many data input (major socio-economic factors, trends) for the predictions (Pan et al., 2019) that are not available for such developing countries (Al-Subu et al., 2019) like India. The lack of availability of primary data on per capita waste generation is a major reason for not being able to properly manage solid waste (Joshi and Ahmed 2016; Banerjee et al., 2019). Khan et al., (1989) mainly stated that according to global socio-economic data and solid waste composition, income is a major factor that affects the percentage of all four (recyclables, organic waste, construction and demolition waste and mixed waste) components in solid waste, which has also been used in this study. In case of Lucknow City, there is limited availability of socio-economic data, Kolekar et al., (2017) concluded in his study that lack of availability of data concerning MSW generation, makes it challenging for the rising nations as India. Therefore, considering the simplicity of model and limited availability of socio-economic data with respect to Lucknow City, it would be justified to proceed with MLRA for a prediction of MSW quantities (Boumanchar et al., 2019) of urban Lucknow. Present study also efforts to recognize the pattern of waste composition in various zones of the city and estimate mean composition of MSW for Lucknow city. For the first time, presents study attempts to address this issue scientifically to minimize the gap by applying a MLRA for accurate forecasting of MSW quantity in urban region of Lucknow.
Materials and Methods
Study Area
Lucknow is the metropolis of Uttar Pradesh state located between 26°52″ N latitude and 80°52″ E longitude, on the banks of river Gomati, a tribute of Ganges River, which passes through the middle of the city. Lucknow city, with a jurisdiction of 350.53 km2 of area and population of 28, 17,105 (GOI, 2001, 2011) is a Municipal Corporation administered by Lucknow Municipal Corporation (LMC). With an average decadal growth rate of 26% in last century and 44.87% in the last three decades (1991 to 2011), population of the city has greater than before to 83 persons per hectare in year 2011 from 49 persons per hectare in 1991. The city generated about 1365 M ton d-1 of MSW in 2015 (LMC 2015). Study area was divided into eight zones according to recent reorganization by Lucknow Municipal Corporation in 2016. All the eight zones have been further divided into total 110 wards. Zone 1,2,3,4,5,6,7 and 8 consist of 16, 18, 18, 8, 11, 20, 12 and 7 wards respectively (Fig. 1).
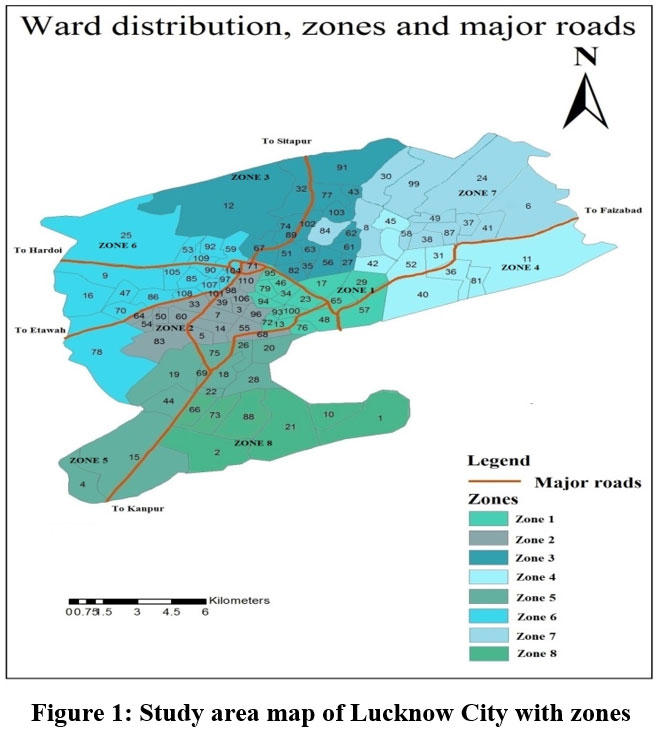 |
Figure 1: Study area map of Lucknow City with zones Click here to view Figure |
Development of Model
SPSS (Statistical Package for the Social Sciences) version 20 has been used for development of model for Lucknow city. Development of prediction model using statistical analysis tools involves various steps as described in succeeding sections. Fig. 2 shows the basic steps of development of a MLRA.
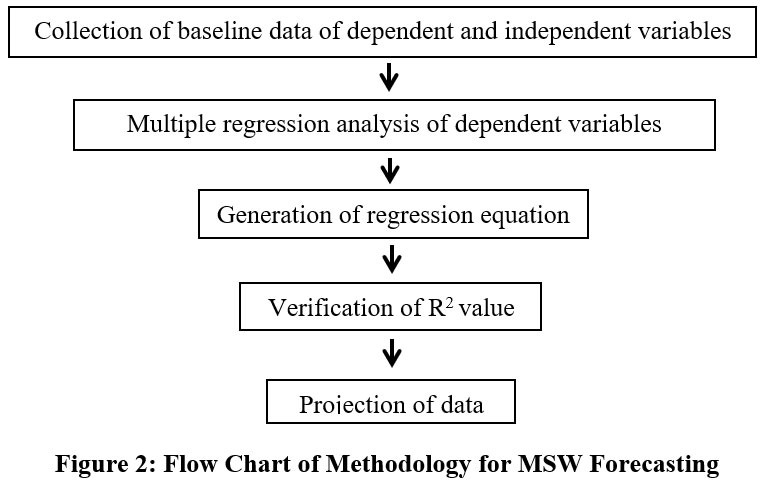 |
Figure 2: Flow Chart of Methodology for MSW Forecasting Click here to view Figure |
Collection of baseline data
Socio-economic data pertaining from year 2006 to 2014 collected from various agencies (LMC, CPCB, Directorate of Economics and Statistics and MoUD) includes per capita income, gross domestic product (GDP), household size, population and solid waste generation of Lucknow city. Selection of these variables were based on literature and availability of data. According to Beukering et al., (1999), the correlation between per capita income and waste generation is positive (R2 = 0.9773), therefore, the per capita income was chosen as first variable that would play an important role in calculating solid waste generation in the urban area of Lucknow city Conferring to Alajmi (2016), GDP and population is directly proportional to solid waste generation. The results of this study proven that GDP and population are much-needed variables to forecast the solid waste generation The findings of Al-Momani (1994), Sujauddin et al., (2008) and Getahun (2012) confirm that family size is positively correlated with waste generation rate per household, hence household size was selected as a third independent variable in this study. Accordingly obtained data was compiled and utilized for forecasting. Among the data MSW generation is a dependent variable whereas; per capita wages, gross domestic product, mean household size and population of past years are independent variables respectively.
MLRA for forecasting of MSW quantity
The trend of MSW has been predicted by developing a multilinear regression model to project the solid waste content of Lucknow City. It is a tool for analyzing interactions between reliant variables and many self-reliant or predictive variables. In other words, many linear regression models attempts to establish a connection between two or more independent variables and a dependent variable, which fittings for the data observed in the graphing equation. Every value of the independent variable 'x' is associated with the value of dependent variable 'y'. A basic multilinear regression model can be represented by the following equation (Vivekananda and Nema 2014)
Yi = b0i + b1ix1 + b2ix2 + bnixn + …………………... + bnixn1 + Ei (1)
Where, Yi is the dependent variable, x1, x2, ... xn are the independent or predictor variables, Ei is the error term and b0i, b1i, b2i, ... bni are the regression coefficients.
A numerical analysis carried out by using SPSS. The analysis made had been taking into consideration socio economic differences. In SPSS, we created four variables so that we could enter our data: Per Capita Income (PCI), household size (HHS), population of the city and Gross Domestic Product (GDP) (the independent variables), and MSW generated (the dependent variable).
Projection of data
After generation of regression equation, projection of MSW generation for Lucknow city has been done using projected values of socio-economic variables. Values of various socio-economic variables in upcoming years were used in above regression equation to give values of MSW generation in M ton d-1 for corresponding years. The amount of MSW generated (M ton d-1) was predicted from the year 2015 to 2025.
Sampling
Samples of MSW were collected from various wards during May 2016 to October 2016 to determine its characteristics. MSW has been sampled and analyzed according to the standard procedures prescribed by Central Public Health and Environmental Engineering Organization (CPHEEO, 2000) in present study. Initial sample size weighed about 100-150 kg. The sample size was reduced to 10-12 kg by method of quartering for physical characterization using 25 kg spring balance. CPHEEO (2000) SWM manual recommends that the number of samples to be taken does not exceed thirty - six for various MSW components. Hence, 12 samples were collected from each ward in each zone distributed over six months and mean composition of MSW for each zone was determined. Mean composition of MSW for the eight zones of Lucknow City has been used to calculate overall MSW composition of Lucknow city.
Results and Discussion
Model for predicting MSW generation
A forecasting model as described in section 2.4 has been utilized in the present work to determine the amount of daily MSW generated in Lucknow City. Past years data of various socio-economic variables has been used to calculate the model regression coefficients. Incorporation of regression coefficients in the model thus yields into following relationship between MSW generation rate and socio-economic variables:
M = −9731.127 + 2.257∗PP + 907.187∗HHS – 13.253∗GDP + 68.069∗PCI (2)
Where, PP-Population of the city, HHS-Household size, GDP-Gross domestic product and PCI represents Per capita Income. Using equation 2 and projected socio-economic variables, MSW generation in Lucknow city up to year 2025 is presented in Table 1.Using data from Table 1, a plot was generated between MSW generation rate and years up to 2025 and is represented in Fig. 3.
Projected population of Lucknow City increases from 29.74 hundred thousand in 2015 to 33.67 hundred thousand in 2025. Analyzing the past trend of population growth, it has been noted that population has been increasing but rate of population growth in Lucknow City shows a decadal declining trend from 70.79% in 1991 to 35.01% in 2001 and 28.87% in 2011. As growth rate is decreasing, arithmetic increase method is most appropriate method to project the population of Lucknow City. Area under Lucknow Municipal Corporation (LMC) has increased from 48 km2 in 1951 to 350 km2 in 2011. Inclusion of new areas under LMC is also an important reason behind increase in population.
Table 1: Projection of MSW generated (in M ton d-1) for Lucknow City
|
S. No. |
Year |
Projected population (thousands) |
Projected MSW generated per day (M ton d-1) |
Per Capita waste generation (kg d-1) |
Mean Household size (no. of persons) |
|
1 |
2015 |
2974 |
1383 |
0.465 |
5.19 |
|
2 |
2016 |
3014 |
1450 |
0.481 |
5.18 |
|
3 |
2017 |
3053 |
1519 |
0.497 |
5.17 |
|
4 |
2018 |
3092 |
1587 |
0.513 |
5.16 |
|
5 |
2019 |
3131 |
1659 |
0.530 |
5.15 |
|
6 |
2020 |
3171 |
1735 |
0.547 |
5.14 |
|
7 |
2021 |
3210 |
1807 |
0.563 |
5.13 |
|
8 |
2022 |
3249 |
1876 |
0.577 |
5.12 |
|
9 |
2023 |
3289 |
1946 |
0.592 |
5.11 |
|
10 |
2024 |
3328 |
2011 |
0.604 |
5.10 |
|
11 |
2025 |
3367 |
2075 |
0.616 |
5.09 |
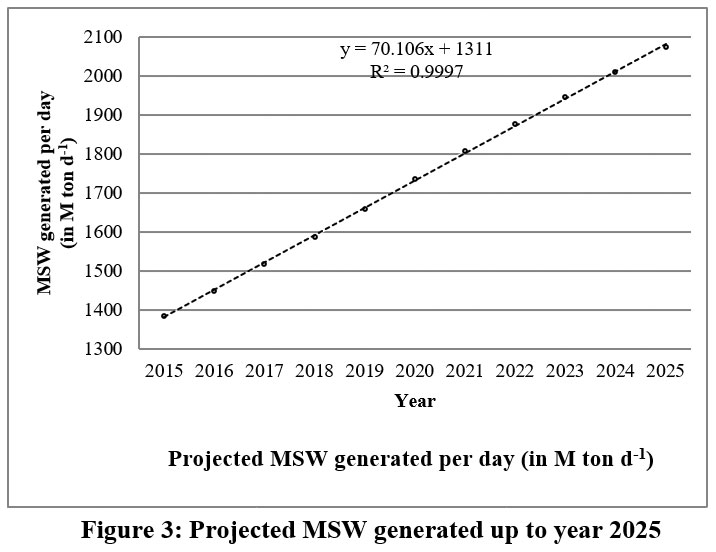 |
Figure 3: Projected MSW generated up to year 2025 Click here to view Figure |
The present study finds that MSW generation in Lucknow increases from 1383 M ton d-1 in the year 2015 to 2075 M ton d-1 in the year 2025. Trend line generated using least square error method reflects a positive slope of 70.106 with R2 value close to 1. Economic development, urbanization, improved living standards and high population growth in Lucknow are most probable reason for such increase the quantum of Municipal Solid Waste. LMC report (2015) also envisages a similar quantum of Municipal Solid Waste in the year 2020 as presented in Table 2; i.e., according to the study projection by LMC, nearly 1748 M ton d-1 of MSW will be generated per day in Lucknow in the year 2020. Comparing the projected MSW quantity by present study with the data (1190 M ton d-1), as provided by LMC, the deviation is found out to be quantum of MSW in significant (0.44 % for the year 2006). This justifies the accuracy of proposed model. It may be noticed that per capita waste generation shows a growth from 0.465 kg capita-1 d-1 in 2015 to 0.616 kg capita-1 d-1 in 2025. The increase may be attributed to rise in consumerism behavior, higher per capita income and urbanization. For cities with population more than 20 lakhs, waste generation rate varies from 0.22 – 0.62 kg capita-1day-1 (Kumar et al., 2009).
It is observed that mean household size declined from 5.19 in the year 2015 to 5.09 in the year 2025. The decline in house hold size is due to fragmentation of joint families, growing township culture and migrating people getting settled in the city in search of livelihood. An inverse relationship is noticed when mean house hold size is compared with per capita waste generation of Lucknow. There is an increase in Per capita MSW generation with reducing household size for there are several items in household waste which are independent of household size like newspapers etc. (Burnley 2007)
Composition of MSW for Lucknow City
Field study has been conducted in all the 8 zones of Lucknow city and physical composition of MSW was calculated by analysing samples from wards distributed throughout 8 zones of Lucknow City. Table 2 represents the zonal composition of MSW in Lucknow City (% by weight). In order to account for the diurnal variation in recyclables samples are collected in morning time in the months of May, July and September and sample collection in months of June, August and October has been done in later part of the day. The decreased amount of recyclables in these months is attributed to segregation and collection done by rag pickers at waste collection points. Moreover, trend reveals generation of higher amount of recyclables in rainy seasons (July and August) as compared to summers (May and June) and autumn/winter season (September and October). Zone 1, 4 and 7 generate higher amount of recyclables as compared to other zones of the city. This may be due to dominant presence of higher income group population in these zones. Apart from this, sudden rise in recyclables is also witnessed whenever some cultural functions or ceremonies took place in the adjoining areas of waste collection points. Overall, recyclables are found to be 20.20 ± 1.3 % by weight of total MSW generated in Lucknow city which is slightly higher than earlier studies done by LMC (2015) (17%) and Gupta et al., (2013) (17.7 %). This indicates that paper is now being progressively replaced with alternative packaging material viz. Plastics. This may be due to inclination towards consumption of packaged materials and processed food items.
Organic wastes mainly include left behind food, waste derived from vegetables, dead and decaying leaves, fruits, flowers etc. Fig. 4 represents variation in Organic waste throughout the eight zones in Lucknow City. It was concluded that organic waste is mainly composed of food waste. Overall, organic waste was found to be 45.40 ± 2.0 % by weight of total MSW generated in Lucknow city which was found to be nearly same as in earlier studies done by LMC (2015) (47.35%) and Gupta et al., (2013) (45.99 %).
Waste generated during construction activities are categorized under Construction and Demolition waste (CDW). Fig. 4 also represents variation in CDW throughout the eight zones in Lucknow City from May to October. In Lucknow city, CDW generates mainly during construction activity, during renovation/ repair work, etc. Excavations produce topsoil, clay, sand, and gravel. Generation of CDW depends on type of activity undertaken like excavation activities generate sand, gravel and clay, demolition activities generate cement, lime and mortar, etc. No standard practices are presently being followed for dumping of CDW. Mostly, it is found mixed with municipal waste. The results obtained in case of Lucknow city show a decreased amount CDW waste in rainy season as compared to succeeding and preceding months. A major portion of CDW waste is used in reconstruction activities or filling up low lying areas. Overall, CDW was found to be 17.40 ± 1.8 % by weight of total MSW generated in Lucknow city which was found to be nearly same as in earlier studies done by LMC (2015) (15.98%) and Gupta et al., (2013) (17.75 %).
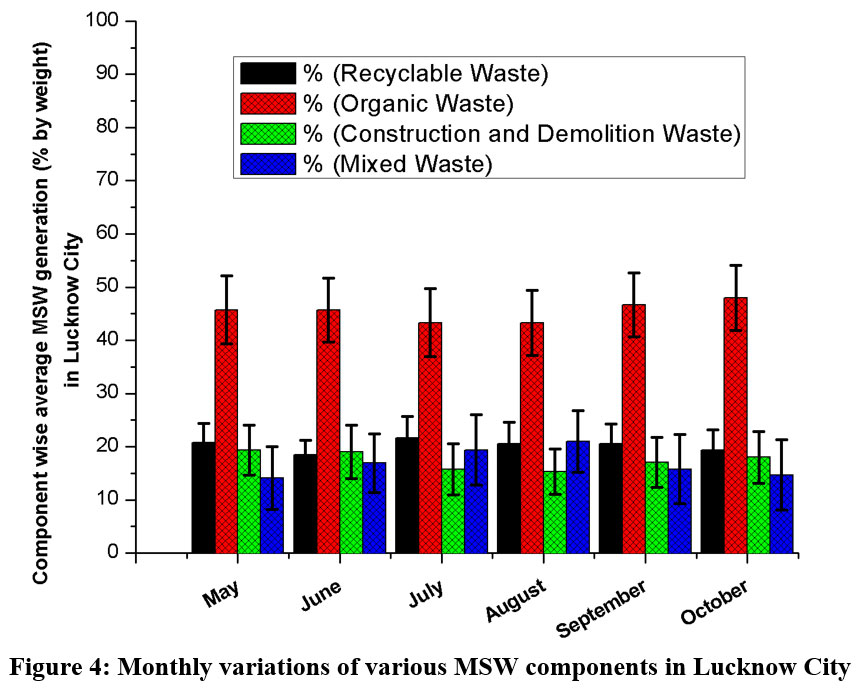 |
Figure 4: Monthly variations of various MSW components in Lucknow City Click here to view Figure |
Mixed waste consisted of those wastes which cannot be segregated into recyclable, organic or CDW. It includes waste arising from drain silt and street sweeping. The results obtained shows that there is an increased amount of mixed waste generated in months of rainy season as compared to other seasons. This may be because of erosion activity taken out by flowing rain water on the surface. Overall, Mixed waste was found to be 17.00 ± 2.9 % by weight of total MSW generated in Lucknow city which was found to slightly less as in earlier studies done by LMC (2015) (19.67%) and Gupta et al. (2013) (19.06 %). The results obtained above were summarized and zone wise mean composition of MSW generated in Lucknow city was obtained as presented in Table 3. Primary sources of recyclable waste in all zones of Lucknow city probably generates from domestic sources, commercial sources, and industrial sources and hospitals were high due to community operations. Percentage of recyclables vary from 14% to 24% with more urbanised areas like Hazratganj, Gomati nagar, Indiranagar, etc. areas showing higher proportion of recyclables in MSW. Organic waste comprises the maximum percentage of MSW in all the zones with values varying from 39 % to 55 %. Biodegradable and recyclable wastes are two major components in MSW stream in Lucknow. Composting may prove to be a very suitable alternative to reduce appreciable quantity of biodegradables in MSW. Similarly recycling in combination with energy recovery may be best suitable for recyclable wastes. Reduction in quantum of MSW will ultimately lead lesser requirement of land for disposal purposes. Leachate generated in landfills is another major environmental concern associated with high level of biodegradables in MSW. As evident in middle and lower income nations (like India), organic matter is the major component followed by paper and plastics (Karak et al., 2012). Fig. 5 represent overall mean composition of MSW in Lucknow city in 2016.
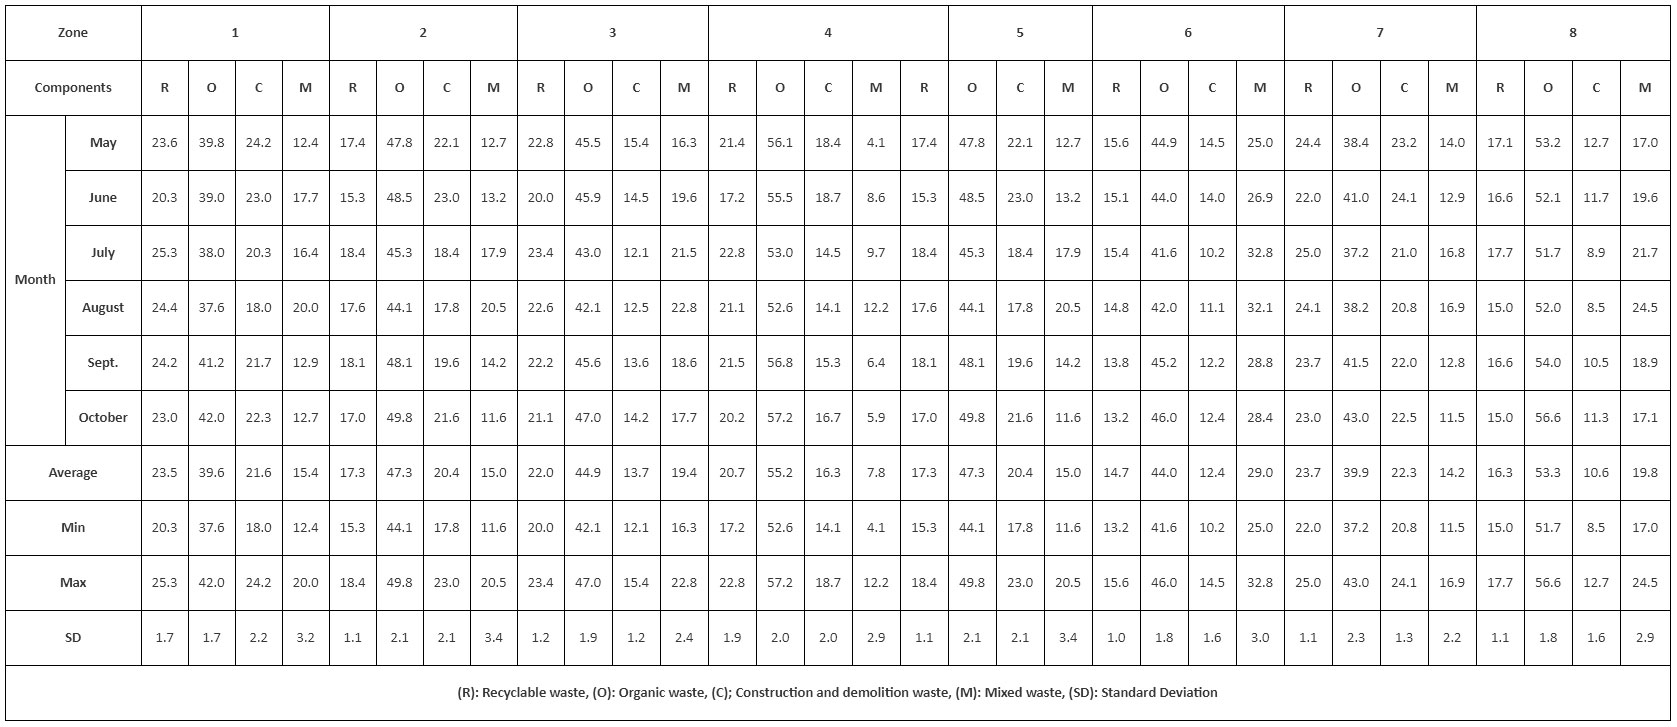 |
Table 2: Zonal composition of MSW in Lucknow City (% by weight) Click here to view table |
Table 3: Zone wise MSW composition for Lucknow City in 2016
|
S. No. |
Zone |
Percentage composition of total waste (%) |
|||
|
Recyclables |
Organic |
Construction Debris |
Mixed waste |
||
|
1 |
Zone 1 |
24.13±2.17 |
39.60±1.75 |
21.58±2.18 |
14.68±3.18 |
|
2 |
Zone 2 |
21.28±2.31 |
55.20±1.95 |
16.28±1.97 |
7.23±2.84 |
|
3 |
Zone 3 |
22.62±1.72 |
44.85±1.88 |
13.72±1.25 |
18.82±2.31 |
|
4 |
Zone 4 |
24.17±2.06 |
39.38±2.20 |
21.80±1.99 |
14.65±3.00 |
|
5 |
Zone 5 |
17.87±1.48 |
47.27±2.13 |
20.42±2.12 |
14.45±3.14 |
|
6 |
Zone 6 |
14.88±1.15 |
43.95±1.79 |
12.40±1.64 |
28.77±2.28 |
|
7 |
Zone 7 |
24.27±1.53 |
39.88±2.27 |
22.27±1.27 |
13.58±1.83 |
|
8 |
Zone 8 |
16.93±1.35 |
53.27±1.85 |
10.60±1.63 |
19.20±2.68 |
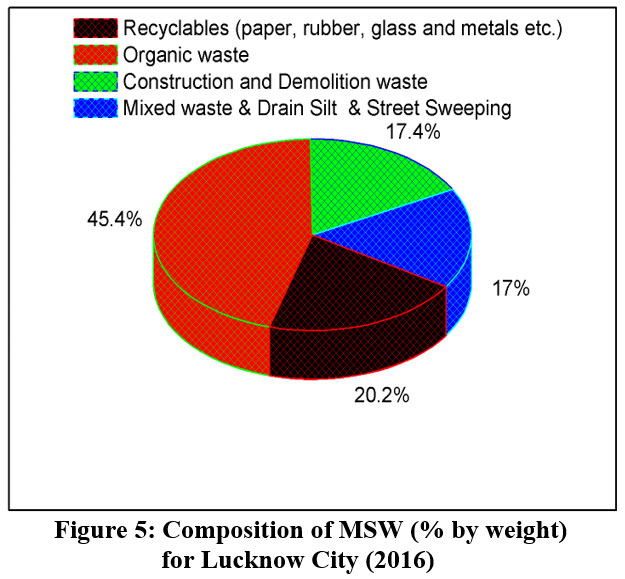 |
Figure 5: Composition of MSW (% by weight) for Lucknow City (2016) Click here to view Figure |
Validation of MLR model
The model cannot be universal owing to a range of variations in living standards, economic status, demographic composition, etc. in an area. As mentioned above, suitable variables affecting MSW generation in an area may be selected on the basis of availability of data and a model can be developed. Further to the above, it is one shoe fit for all approach that has led to failure of MSW management plan in many parts of the world. Validation of forecasted data is founded on two grounds: a. Comparison of predicted values of MSW generation in 2020 (1735 M ton d-1) with Lucknow City Development Plan 2040 (1748 M ton d-1) which is quite accuurate (LMC 2015). b. For cities with population more than 20 lakhs, waste generation rate varies from 0.22 – 0.62 kg capita-1 d-1 which in case of Lucknow city comes out to be 0.616 which is justified.
Conclusion
The prediction model for municipal solid waste quantities of Lucknow City clearly indicates that the waste quantity of MSW generated depends not only on population, but also on many other socioeconomic factors such as gross domestic product, per capita annual income, household size etc. It is also concluded that considered socio-economic variables taken together represent a much better model for estimation of MSW Generation than each of them taken alone. Prediction of MSW generation reflects consistent increase year on year. It is due to the increased population density, consumption pattern, life style behavior and economic development etc. MLR model for prediction of quantity of MSW generated is much more reliable than quantity predicted by thumb rules.
Mean composition of MSW generated for Lucknow City for the year 2016 shows minor variations from past studies. Organic waste is dominant in the waste stream. The high amount of organic waste can be effectively used as organic manure through composting whereas recycling and energy recovery would be an appropriate option for the inorganic fraction of the waste stream. With the availability of data, the forecasting models can further be extended to include more socioeconomic parameters (viz. migratory population, tourists’ population, etc.) and waste fractions. As the above study has shown, there is greater probability of generation of a better model as more and more variables are taken into account. MSW components can be segregated further into sub categories energy content may be studied for in depth analysis. Digitization can be further extended to depict estimated component wise solid waste generation.
Acknowledgement
The study was supported by Technical Education Quality Improvement Program (TEQIP), World Bank project for improving technical education in developing countries and MHRD fellowship. Authors are also thankful to Lucknow Municipal Corporation for their valuable support. Also thanks to LMC for providing data for the study. Authors are also thankful to anonymous reviewers for their valuable comments to improve this article.
Reference
- Adipah, S. and Kwame, O. N. (2019). A Novel Introduction of Municipal Solid Waste Management. J Environ Sci, 3(2), 147-157.http// doi: 10.26502/jesph.96120055
- Alajmi, R.G. (2016). The Relationship between Economic Growth and Municipal Solid Waste & Testing the EKC Hypothesis: Analysis for Saudi Arabia. Journal of International Business Research and Marketing, 1(5), 20-25. http://sci-hub.tw/10.18775/jibrm.1849-8558.2015.15.3003
- Alâ€Momani, A. H. (1994). Solidâ€waste management: Sampling, analysis and assessment of household waste in the city of Amman. International journal of environmental health research, 4(4), 208-222. https://doi.org/10.1080/09603129409356820
- Al-Subu, N. M., Al-Khatib, I. A., and Kontogianni, S. (2019). Forecasting of Municipal Solid Waste Quantity and Quality in a Developing Region Using Regression Predictive Models. The Journal of Solid Waste Technology and Management, 45(2), 186-197. https://doi.org/10.5276/JSWTM/2019.186
- Banerjee, P., Hazra, A., Ghosh, P., Ganguly, A., Murmu, N. C., and Chatterjee, P. K. (2019). Solid waste management in India: a brief review. In Waste management and resource efficiency (pp. 1027-1049). Springer, Singapore. https://doi.org/10.1007/978-981-10-7290-1_86
- Boumanchar, I., Chhiti, Y., M’hamdi Alaoui, F. E., Sahibed-dine, A., Bentiss, F., Jama, C., and Bensitel, M. (2019). Municipal solid waste higher heating value prediction from ultimate analysis using multiple regression and genetic programming techniques. Waste Management & Research, 37(6), 578-589. https://doi.org/10.1177%2F0734242X18816797
- Burnley S J (2007) A review of municipal solid waste composition in the United Kingdom. Waste Management 27:1274-1285 https://doi.org/10.1016/j.wasman.2006.06.018
- Census of India, Govt. of India (2001) and (2011) National summary data page. http://www.censusindia.gov.in/
- Chang N B, Lin Y T (1997) An analysis of recycling impacts on solid waste generation by time series intervention modeling. Resour. Conserv. Recy 19:165–186 https://doi.org/10.1016/S0921-3449(96)01187-1
- Chen H W, Chang N B (2000) Prediction analysis of solid waste generation based on grey fuzzy dynamic modeling. Resources, Conservation and Recycling 29:1-18 https://doi.org/1016/S0921-3449(99)00052-X
- CPCB, 2005. Central Pollution Control Board. Management of Municipal Solid Wastes, New Delhi, India. http://www.cpcb.nic.in/
- CPHEEO Manual, 2000. Manual on “Municipal Solid Waste Management”. Ministry of Urban Development, Government of India.
- Daskalopoulos E, Badr O, Probert S D (1998) Municipal solid waste: a prediction methodology for the generation rate and composition in the European Union countries and the United States of America. Resources, Conservation and Recycling 24:155-166 https://doi.org/10.1016/S0921-3449(98)00032-9
- Dyson B, Chang N B (2005) Forecasting municipal solid waste generation in a fast growing urban region with system dynamics modeling. Waste Management 25:669-679 https://doi.org/10.1016/j.wasman.2004.10.005
- Getahun, T., Mengistie, E., Haddis, A., Wasie, F., Alemayehu, E., Dadi, D., and Van der Bruggen, B. (2012). Municipal solid waste generation in growing urban areas in Africa: current practices and relation to socioeconomic factors in Jimma, Ethiopia. Environmental monitoring and assessment, 184(10), 6337-6345. https://doi.org/10.1007/s10661-011-2423-x
- GOI. Government of India. Ministry of statics and Implementation. http://mospi.nic.in/data
- Gupta S K, Pandey S K, Singh N B, Singh A, Singh V K, Verma T (2013) Municipal Solid Waste Characterizations and Management Strategies for the Lucknow City, India. International Journal of Applied Engineering Research 17:2031-2036
- Joshi, Rajkumar, and Sirajuddin Ahmed. Status and challenges of municipal solid waste management in India: A review. Cogent Environmental Science 2.1 (2016): 1139434. https://doi.org/10.1080/23311843.2016.1139434
- Kansal A (2002) Solid waste management strategies for India. Indian Journal of Environmental Protection 444–448
- Karak T, Bhagat RM, Bhattacharyya P (2012) Municipal solid waste generation, composition, and management: the world scenario. Critical Reviews in Environmental Science and Technology 42:1509-630 https://doi.org/10.1080/10643389.2011.569871
- Khan M Z A, Burney F A (1989) Forecasting solid waste composition-an important consideration in resource recovery and recycling. Resources, Conservation and Recycling 3:1-17 https://doi.org/10.1016/0921-3449(89)90010-4
- Kolekar K A, Hazra T and Chakrabarty S N (2017) Prediction of municipal solid waste generation for developing countries in temporal scale: A fuzzy inference system approach, Global NEST Journal 19:511-520
- Kumar S, Bhattacharyya J K, Vaidya A N, Chakrabarti T, Devotta S, Akolkar A B (2009)Assessment of the status of municipal solid waste management in metro cities, state capitals, class I cities, and class II towns in India: An insight. Waste Management 29:883–895 https://doi.org/10.1016/j.wasman.2008.04.011
- LMC (2015) Lucknow Municipal Corporation. City Development Plan for Lucknow City -2040
- Matsuto T, Tanaka N (1993) Data analysis of daily collection tonnage of residential solid waste in Japan. Waste Management and Research 11:333–343 https://doi.org/10.1177/0734242X9301100407
- MoUD (Ministry of Urban Development), 2011. Slum Free City Plan of Action – Lucknow Regional Centre for Urban and Environmental Studies.
- Pan, A., Yu, L. and Yang, Q. (2019). Characteristics and forecasting of municipal solid waste generation in china. Sustainability, 11(5), 1433. https://doi.org/10.3390/su11051433
- Rathi S (2006) Alternative approaches for better municipal solid waste management in Mumbai, India. Journal of Waste Management 26:10, 1192–1200 https://doi.org/10.1016/j.wasman.2005.09.006
- Ray M R, Roychoudhury S, Mukherjee G, Roy S, Lahiri T (2005) Respiratory and general health impairments of workers employed in a municipal solid waste disposal at open landfill site in Delhi. International Journal of Hygiene and Environmental Health 208:4, 255–262 https://doi.org/10.1016/j.ijheh.2005.02.001
- Rushbrook P E, Finnecy E E (1988) Planning for future waste management operations in developing countries. Waste Management & Research 6:1, 1–21 https://doi.org/10.1177/0734242X8800600101
- Sharma, S, Shah K W (2005) Generation and disposal of solid waste in Hoshangabad. In: Book of Proceedings of the Second International Congress of Chemistry and Environment, Indore, India 749–751
- Shekdar A V, Krshnawamy K N, Tikekar V G, Bhide A D (1992) Indian urban solid waste management systems – jaded systems in need of resource augmentation. Journal of Waste Management 12:379–387 https://doi.org/10.1016/0956-053X (92)90041-G
- Soni, U., Roy, A., Verma, A., & Jain, V. (2019). Forecasting municipal solid waste generation using artificial intelligence models—a case study in India. SN Applied Sciences, 1(2), 162. https://doi.org/10.1007/s42452-018-0157-x
- Sujauddin, M., Huda, S. M. S., and Hoque, A. R. (2008). Household solid waste characteristics and management in Chittagong, Bangladesh. Waste management, 28(9), 1688-1695. https://doi.org/10.1016/j.wasman.2007.06.013
- Van Beukering, P., Sehker, M., Gerlagh, R., and Kumar, V. (1999). Analysing urban solid waste in developing countries: a perspective on Bangalore, India. Collaborative Research in the Economics of Environment and Development.
- Vivekananda B, Nema A K (2014) Forecasting of solid waste quantity and composition: a multilinear regression and system dynamics approach. International Journal of Environment and Waste Management 13:179–198 https://doi.org/10.1504/IJEWM.2014.059618


