Seasonal Trend Analysis in Rainfall and Temperature for Udaipur District of Rajasthan
Vaibhav Deoli1
*
 and Saroj Rana1
1
Department of Soil and Water Conservation Engineering,
G B Pant University of Agriculture and Technology,
Pantnagar,
263145
Uttarakhand
India
http://dx.doi.org/10.12944/CWE.14.2.15
Copy the following to cite this article:
Deoli V, Rana S. Seasonal Trend Analysis in Rainfall and Temperature for Udaipur District of Rajasthan. Curr World Environ 2019; 14(2). DOI:http://dx.doi.org/10.12944/CWE.14.2.15
Copy the following to cite this URL:
Deoli V, Rana S. Seasonal Trend Analysis in Rainfall and Temperature for Udaipur District of Rajasthan. Curr World Environ 2019; 14(2). Available from: https://bit.ly/2wEQ8m4
Download article (pdf)
Citation Manager
Publish History

Introduction
Quantitative estimation of the temporal distribution of rainfall and temperature for an area is important to different purposes such as hydrological modelling, hydraulic structures modelling, flood forecasting, surface water modelling, groundwater modelling, agriculture modelling, crop scheduling, evaporation modelling etc. High temperature can cause worsen drought in an area and also a reason for forest fires. High temperatures are also responsible for reducing yields in the field and crop-damaging. Low temperatures able to cause heavy snowfalls and rime. Heavy rainfall is a cause of flood in plane areas and landslides in hilly areas. A standout amongst all factor which is responsible for climate change, greenhouse gases would be the main factor for the uncertainty of the rainfall and temperature variation and India have been also affected by this factor. Change in the pattern of rainfall and temperature increases have occurred all over the world. In India, most of the agricultural areas depending upon the climate mainly rainfall hence in India rainfall have a major role in deciding the total economy of the country. Hence, the study of trend and pattern by metrological data for an area is important to detect long term climate change and its impact (Jain et al., 2012). According to many researches, climate change and evidences are not the same for the whole world. In certain areas, an increase of rainfall or decrease of temperature is expected, while other areas at the same time may suffer from decreased rainfall or increased temperature. If the temperature is higher it cause a condition of formation of clouds. As the temperature is high the atmosphere may contain more vapour of water which is responsible for heavy rainfall such as summer thunderstorms.
All over the world, to know the impact of climate changes many researchers have been working on the trend of rainfall and temperature to predict long term changes in climate. Cheung et al., (2007) studied trend in annual rainfall for Ethopia to know variability, quantity and changes in rainfall for 13 watersheds. By this study, they determined the significance level and value of change in rainfall for studied area. Haris et al., (2010) used Mann-Kendal test to know the significant trends in rainfall and temperature at three representative agro-ecological zones of Bihar. Jain et al., (2012) analyzed rainfall and temperature trends for the north-east states in India by Mann-Kendal & San-Slope estimator test. Yadav et al., (2014) worked on seasonal trend analysis in rainfall and temperature for Uttarakhand state to know the overall insignificant changes in the area. Meshram et al., (2016) used long term precipitation data to analysis seasonal trend in precipitation for Chhattisgarh state of India by linear regression, Mann-Kendal and San slope’s estimator test. Longueville et al., (2015) studied long-term trend of rainfall and temperature for Burkina Faso. The trend was determined in rainfall, temperature and rainy days. They observed the tren of this area did not show significant trend in rainfall and temperature.
Udaipur is in one of that area in India where average rainfall is less than average rainfall of India and it also suffer from high temperatures. So it is important to determine the rainfall and temperature trend in different seasons for the purpose of agricultural activities, crop water balance model as well as to know about drought condition and productivity of that area.
Study Area and Data Used
This study carried out to Udaipur district of Rajasthan. The longitude and latitude of the study area are 73042’ and 24045’ respectively with 582.17 meters above mean sea level (Figure 1). Udaipur receives maximum rainfall due to the south-west monsoon in monsoon season and in all other seasons rainfall is very low for this area. Hence there is always a wide variation in daily annual rainfall as well as seasonal rainfall.
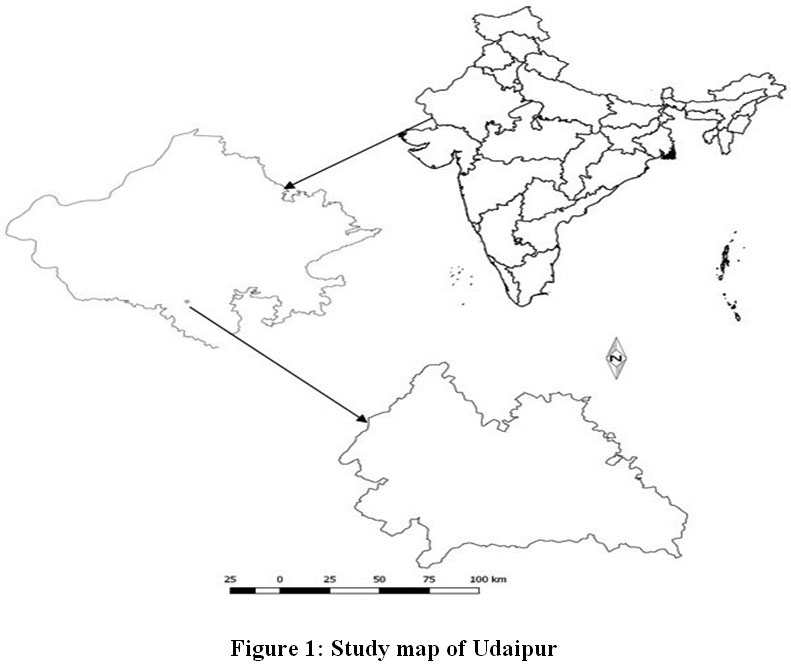 |
Figure 1: Study map of Udaipur Click here to view Figure |
In this study, daily data of 37 years were obtained from the website of the Department of Water Resource, Govt. of Rajasthan. Daily data has been used to determine the rainfall trend, maximum temperature trend and trend in minimum temperature in the basis of different season. Seasonal rainfall data obtained by adding daily rainfall data of particular season of that year and maximum and minimum temperature data has been obtained by the average of the maximum and minimum daily temperature for that particular season of a year.
For seasonal analysis each year has been divided into four climatic season, namely winter season which included 2 months (January & February), pre-monsoon included 4 months (March to May), monsoon included 5 months (June to October), and in last, post-monsoon included 2 months(November &December) (Rao 1981; Jain et al., 2012). After that, data has been analysed season wise.
Methodology
In the present study, to determine the rainfall trend, maximum temperature trend and minimum temperature trend non-parametric test has been used. Non- parametric test tests are less affected by outliers and represent a measure of linear dependence (Yadav et al., 2014; Lanzante 1996; Rosssi et al., 1992). In non-parametric test,for detection of significance trend Mann-Kendall statistic has been used and to determine trend magnitude San slope estimator’s used.
Mann-Kendall statistic: Mann-Kendall statistic is used to ascertain a significant trend in climatically data. To trend analysis Mann-Kendall statistic is one of the best method to detect trend and has been using continuously (Jain et al., 2012; Kumar et al., 2018). In this study, Mann-Kendall statistic has been used to determine a significant rainfall trend as well as maximum temperature trend and minimum temperature trend. In this statistic, the null hypothesis sets as data shows no trend and alternative hypothesis sets as there is a trend in data which may be either increasing trend or decreasing trend. This method is less affected by outliers hence more suitable for data which are non – normally distributed.(Kumar et al., 2018).
Let y1, y2, y3, …, ym are mdata, then the Mann-Kendall statistic can be given by
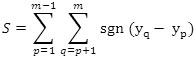
Where S denotes Mann-Kendall statistic, m is the total number of observations taken and yq isqth observation and ypis pth observation in total.
Let (yq - yp) = α
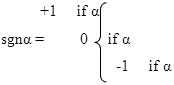
The variance of S is calculated as
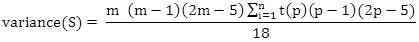
Where, nis the total tied groups present and t(p)is the total number ofdata points in the pthtied group.
San’s Slope Estimator Test: San’s slope estimator is used to determine the magnitude of the trend in data. This method consider temporal series data follow linear trend. If xp & xq are considered as values of time series data at m and n time as p > q.
The slope (Qi) of data pairs is computed as

The median of qvalues of Qiis Sen’s slope estimator of slope, which may be computed as:
Results and Discussions
Statistical parameter of rainfall and temperature: The maximum rainfall obtained in Udaipur district in the monsoonal season with an average of 558.72mm with 203.85 mm standard deviation during the study period. The minimum average rainfall of 5.32 mm has been obtained in winter season with 9.33 mm standard deviation. (Table 1). Minimum variation in rainfall has been obtained in monsoon seasonand maximum variation in rainfall has been obtained in in the season of post-monsoon.
The maximum mean average temperature for 39 years obtained in pre-monsoon followed by monsoon season. Minimum variation in maximum temperature has been obtained in the monsoon season and maximum variation has been obtained in the winter season (Table 2). The average minimum temperature has been incurred in the post-monsoon season with a maximum variation of 27.12% just followed by winter season which has 24.38% variation (Table 3).
Table 1: Statistical parameter of seasonal rainfall
|
Season |
Mean (mm) |
SD (mm) |
CV (%) |
|
Winter |
5.32 |
9.33 |
174.13 |
|
Pre-monsoon |
42.27 |
42.73 |
101.06 |
|
Monsoon |
558.72 |
203.85 |
36.48 |
|
Post-monsoon |
17.46 |
36.17 |
207.15 |
Table 2: Statistical parameter of maximum temperature
|
Season |
Mean (0C) |
SD (0C) |
CV (%) |
|
Winter |
27.92 |
3.67 |
13.14 |
|
Pre-monsoon |
35.80 |
2.16 |
6.03 |
|
Monsoon |
31.13 |
1.49 |
4.78 |
|
Post-monsoon |
26.45 |
2.29 |
8.65 |
Table 3: Statistical parameter of minimum temperature
|
Season |
Mean (0C) |
SD (0C) |
CV (%) |
|
Winter |
7.67 |
1.87 |
24.38 |
|
Pre-monsoon |
20.48 |
2.05 |
10.00 |
|
Monsoon |
20.64 |
1.33 |
6.44 |
|
Post-monsoon |
7.41 |
2.01 |
27.12 |
Significance of Trend: To detection of weather trend is Mann-Kendall significant or not in rainfall, maximum temperature and minimum temperature for Udaipur district Mamm-Kendall statistic has been used. Results obtained by Mann-Kendall test is listed in Table 4.
Table 4: Detection of trend by Mann-Kendall test for seasonal rainfall
|
Z – value for different seasons |
||||
|
Climatic characteristics |
Winter |
Pre-monsoon |
Monsoon |
Post monsoon |
|
Rainfall |
-1.896* |
0.503 |
0.064 |
-1.741* |
|
Max Temperature |
0.064 |
4.347** |
2.077** |
0.284 |
|
Min Temperature |
2.180** |
2.322** |
-0.206 |
-1.419* |
* Significant negative trend and**significant positive trend at 10% level of significance
Based on Mann-Kendall test, in the rainfall winter season & post-monsoon season show a significant negative trend wherein pre-monsoon & monsoon there was positive trend but not significant at 10% level of significance. In maximum temperature significant positive trend for season of pre-monsoon and monsoon whereas maximum temperature in season of winter & post-monsoon also increased but not significantly. In last, minimum temperature shows increasing significant trend in winter and pre-monsoon whereas in post-monsoon minimum temperature trend decreased significantly. Monsoon-season shows negative trend in case of minimum temperature but not significantly at the 10% level.
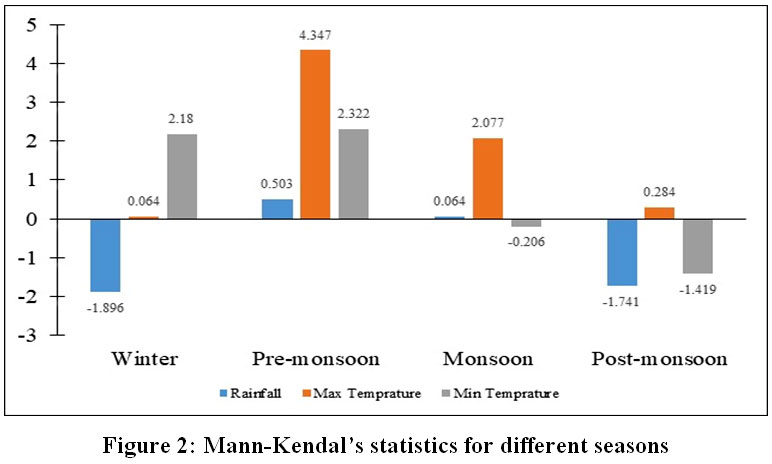 |
Figure 2: Mann-Kendal’s statistics for different seasons Click here to view Figure |
Magnitude of trend: Magnitude of rainfall trend, maximum temperature and minimum temperature was also calculated by San’s slope estimator test and obtained results are in Table 5.
Table 5: San’s estimator of slope
|
|
San’s slope estimator values for different seasons |
|||
|
Climate characteristics |
Winter |
Pre-monsoon |
Monsoon |
Post monsoon |
|
Rainfall |
-0.033 |
0.269 |
0.057 |
0.000 |
|
Max Temperature |
0.004 |
0.789 |
0.043 |
0.002 |
|
Min Temperature |
0.583 |
0.085 |
-0.011 |
-0.040 |
Based on San’s slope estimator, rainfall in winter season decrease by -0.033mm wherein pre-monsoon and monsoon season increased by 0.269mm and 0.057mm. Post monsoon season didn’t show any result because rainfall in post monsoon was not linear for Udaipur district. The maximum temperature of Udaipur district has been observed increases in all season by 0.0040C in winter, 0.7890C in pre-monsoon, 0.0430C in monsoon and 0.0020C in post-monsoon season respectively. Minimum temperature shows an increase of 0.5830C in winter and 0.0850C in pre-monsoon season whereas the decrease of -0.0110C and -0.0400C in monsoon and post-monsoon season.
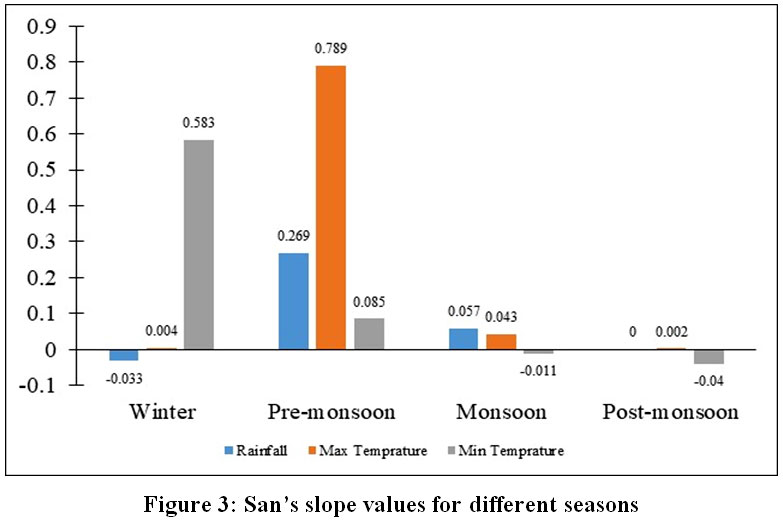 |
Figure 3: San’s slope values for different seasons Click here to view Figure |
Percentage change: In the study, after calculating magnitude of trend, based on that trend magnitude percentage changes in rainfall, maximum temperature and minimum temperature also determined. The total percentage changes for 39 years from 1975 to 2013 has been shown in Table 6.
Table 6: Percentage changes in studied climate characteristics from 1975 to 2013
|
|
Percentage changes |
|||
|
Climate characteristics |
Winter (%) |
Pre-monsoon (%) |
Monsoon (%) |
Post monsoon (%) |
|
Rainfall |
240.16 |
24.82 |
0.40 |
0.00 |
|
Max Temperature |
0.55 |
85.94 |
5.39 |
0.29 |
|
Min Temperature |
296.44 |
16.17 |
-2.08 |
-21.05 |
From Table 6, maximum changes in rainfall 240.16%, observed in winter followed by 24.82% in pre-monsoon season for studied period. As san’s slope magnitude zero in post-monsoon season, hence post monsoon season does not shows any changes in rainfall. Changes in maximum temperature for all season shows positive percentage changes. Maximum increase in temperature is observed in pre-monsoon season by 85.94% and minimum increase in temperature 0.29% is observed in post-monsoon season. Change in minimum temperature is observed maximum in winter season by 296.44% followed by pre-monsoon season with increase of 16.17%. Post-monsoon season shows decrease of 21.05% in minimum temperature and monsoon season also shows decrease of 2.08% in minimum temperature.
Conclusion
Change in climate affect all facets of life. Decreasing rainfall will result in a decrease in water availability. A country like India, where agriculture totally based on climate, it is important to detect a trend in all meteorological data. In rainfall and minimum-maximum temperature (39 years) variability analysis and detection of trends in winter, pre-monsoon, monsoon, post-monsoon study carried out for Udaipur district. As the decrease in winter rainfall will affect the Rabi crop of that area. There is a slight increasing trend in pre-monsoon and monsoon rainfall which may be an indication of early rainfall in monsoon season for that particular district. In winter the temperature of the region shows an increasing trend which may be due to decreasing rainfall trend.
Acknowledgement
The authors wish to acknowledge Yogesh Kumar and Dr. P. S. Kashyap, Department of Soil and Water Conservation Engineering, College of Technology, G. B. Pant University of Agriculture and Technology Pantnagar for their support for successful completion of this research work.
We did not receive any internal fund from college or external fundfrom government or non-government organizations.
References
- Almeida C. T, Oliveiraâ€Júnior J. F, Delgado R. C, Cubo P, Ramos M. C. Spatiotemporal rainfall and temperature trends throughout the Brazilian Legal Amazon, 1973–2013. International Journal of Climatology. 2017;37(4):2013-2026.
CrossRef - Cheung WH, Senay GB, Singh A. Trends and spatial distribution of annual and seasonal rainfall in Ethiopia. International journal of climatology. 2008; 28(13):1723-34.
CrossRef - De Longueville F, Hountondji Y. C, Kindo I, Gemenne F, Ozer P. Longâ€term analysis of rainfall and temperature data in Burkina Faso (1950–2013). International Journal of Climatology. 2016;36(13):4393-4405.
CrossRef - Emmanuel L, Hounguè N, Biaou C, Badou D. Statistical Analysis of Recent and Future Rainfall and Temperature Variability in the Mono River Watershed (Benin, Togo). Climate. 2019; 7(1):8-34.
CrossRef - Guhathakurta P, Rajeevan M. Trends in the rainfall pattern over India. International Journal of Climatology. 2008; 28(11):1453-1469.
CrossRef - Haris A. A, Chhabra V, Biswas S. Rainfall and temperature trends at three representative agroecological zones of Bihar. Journal of Agrometeorology. 2010; 12(1):37-39.
- Jain S. K, Kumar V, Saharia M. Analysis of rainfall and temperature trends in northeast India. International Journal of Climatology. 2013; 33(4):968-78.
CrossRef - Kumar R, Farooq Z, Jhajharia D, Singh V. P. Trends in temperature for the Himalayan environment of Leh (Jammu and Kashmir), India. Climate Change Impacts, 2018; 3-13.
CrossRef - Lanzante J. R. Resistant, robust and nonâ€parametric techniques for the analysis of climate data: Theory and examples, including applications to historical radiosonde station data. International Journal of Climatology: A Journal of the Royal Meteorological Society. 1996; 16(11):1197-1226.
CrossRef - Meshram S. G, Singh V. P, Meshram C. Long-term trend and variability of precipitation in Chhattisgarh State, India. Theoretical and Applied Climatology. 2017; 129(3-4):729-44.
CrossRef - Mondal A, Kundu S, Mukhopadhyay A. Rainfall trend analysis by Mann-Kendall test: A case study of north-eastern part of Cuttack district, Orissa. International Journal of Geology, Earth and Environmental Sciences. 2012; 2(1):70-8.
- Pingale SM, Khare D, Jat MK, Adamowski J. Spatial and temporal trends of mean and extreme rainfall and temperature for the 33 urban centers of the arid and semi-arid state of Rajasthan, India. Atmospheric Research. 2014; 138:73-90.
CrossRef - Rao Y, P. 1981. The climate of the Indian subcontinent. World Survey of Climatology. 1981; 9:67–182.
- Rossi R. E, Mulla D. J, Journel A. G, Franz E. H. Geostatistical tools for modeling and interpreting ecological spatial dependence. Ecological monographs. 1992; 62(2):277-314.
CrossRef - Yadav R, Tripathi S. K, Pranuthi G, Dubey S. K. Trend analysis by Mann-Kendall test for precipitation and temperature for thirteen districts of Uttarakhand. Journal of Agrometeorology. 2014; 16(2):164.


